Linear versus nonlinear acoustic probing of plasticity
in metals: A quantitative assessment
Carolina Espinoza1,∗, Daniel Feliú1, Claudio Aguilar2, Rodrigo Espinoza-González3, Fernando Lund1, Vicente Salinas1,4and Nicolás Mujica1
1 Departamento de Física, Facultad de Ciencias Físicas y Matemáticas, Universidad de Chile, Avenida Blanco
Encalada 2008, Santiago, Chile
2 Departamento de Ingeniería Metalúrgica y Materiales, Universidad Técnica Federico Santa Maria, Av.
España 1680, Valparaíso, Chile
3 Departamento de Ingeniería Química, Biotecnología y Materiales, Facultad de Ciencias Físicas y
Matemáticas, Universidad de Chile, Avenida Beauchef 851, Santiago, Chile
4 Núcleo de Matemáticas, Física y Estadística, Facultad de Estudios Interdisciplinarios, Universidad Mayor,
Manuel Montt 318, Providencia, Chile
1 2 3
4 5 6
7 8 9 10
11
12
* Correspondence:carolinaaespinozao@ug.uchile.cl;Tel.:+56969654363
Abstract: The relative dislocation density of aluminum and copper samples is quantitatively
measured using linearResonantUltrasoundSpectroscopy (RUS).For eachmetallicgroup, four
sampleswerepreparedwithdifferentthermomechanicaltreatmentsinordertoinducechangesin
theirdislocationdensities. TheRUSresultsarecomparedwithNonlinearResonantUltrasound
Spectroscopy(NRUS)aswellasSecondHarmonicGeneration(SHG)measurements.NRUShasa
highersensitivitybyafactoroftwotosixandSHGby14%to62%.Thelattertechniqueis,however,
fasterandsimpler. Asmainaresultweobtainaquantitativerelationbetweenthechangesinthe
nonlinearparametersandthedislocationdensityvariations,whichinafirstapproximationisalinear relationbetweenthesedifferences.Wealsopresentasimpletheoreticalexpressionthatexplainsthe bettersensitivitytodislocationcontentofthenonlinearparameterswithrespecttothelinearones. X-Raydiffractionmeasurements,althoughintrusiveandlessaccurate,supporttheacousticsresults.
Keywords: alloys; nondestructive testing; dislocationdensity; plasticity; ultrasound; nonlinear acoustics
13
1. Introduction 14
Dislocation density is a key variable to describe and, possibly, to control, the plastic behavior
15
of metallic materials. In situ measurement of plastic behavior and thus, directly or indirectly, of
16
dislocation density, has been a particularly active area of research in recent years, especially at the
17
micro and nano scale, using transmission electron microscopy (TEM), scanning electron microscopy
18
(SEM) and atomic force microscopy (AFM). For example, in-situ TEM has been used to perform tensile
19
tests of submicrometer aluminum single crystals [1], to test single crystal aluminum to study the
20
evolution of dislocation patterns [2], to determine the relation between the evolution of the dislocation
21
structures and the flow stress during compression of steel nanoblades [3] and to study dislocation
22
emission in stainless steel [4]. However, these are destructive techniques and, in general, small,
23
specially prepared samples are required. In most engineering applications these conditions can not be
24
satisfied. Therefore, in situ and non-destructive tests are desirable.
25
Acoustics has long been a tool for the non-destructive evaluation of materials [5–8]. It is routinely used for crack detection [9–12]. However, concerning the plastic behavior of metals and alloys, it is only recently that progress in theoretical modeling and instrumentation development have enabled acoustic measurements to emerge as a quantitative tool to measure dislocation density. On the theory side, Maurel et al., [13,14], building on the classic work of Granato and Lücke [15] derived the following
formula, valid for isotropic materials, that relate the change in dislocation density between two samples with the change in the speed of shear waves and with the change in the speed of sound waves:
∆vT
vT
=− 8
5π4∆
(nL3) =− 8
5π4∆
(ΛL2), (1)
where ∆vT/vT is the relative change of shear wave velocity between two samples of a material
26
that differ in dislocation densityΛ=nL, andnis the number of dislocation segments of (average)
27
lengthLper unit volume. This is an extremely simple result that was experimentally verified using
28
Resonant Ultrasound Spectroscopy (RUS) [16] by Mujica et al. [17]. In addition, Salinas et al. [18]
29
measurednL3in-situ and continuously as a function of applied stress for aluminum under standard
30
testing conditions. These measurements provided and experimental verification of Taylor’s rule
31
with unprecedented accuracy [18]. They provide a solid basis to use velocity measurements as a
32
nonintrusive quantitative measure, as opposed to qualitative estimate, changes in dislocation density.
33
From a purely conceptual point of view, it is interesting to notice that the relevant dimensionless
34
parameter that measure dislocation density isnL3.
35
Armed with this new tool, we can use it to assess the accuracy of other proposed techniques
36
to determine dislocation density. For example, nonlinear methods have been proposed because
37
of their potentially superior sensitivity [9]. Nonlinear acoustics has been widely used to probe
38
material properties in many different fields, such as the nondestructive testing of single crystals and
39
homogeneus small samples [19], geomaterials [11,20,21], biomaterials [10,12,22], and thin films [23].
40
Nonlinear behavior has been monitored using Rayleigh waves as well [24]. There appears to be a wide
41
agreement in the literature that nonlinear methods are quite sensitive to small-scale inhomogeneities.
42
Can nonlinear acoustics be used to monitor dislocation proliferation in metals and alloys?
43
2. Materials and Methods 44
The present article provides a quantitative assesment of linear versus nonlinear acoustic
45
measurement of dislocation density in commercially pure copper and aluminum.
46
One nonlinear acoustic experimental method that is widely used as a non destructive evaluation tool is Second Harmonic Generation (SHG) [25]. In this method, a second harmonic wave is generated from a propagating monochromatic elastic wave, due to the anharmonicity of the elastic material and the presence of microstructural features such as dislocations. The second harmonic nonlinear response is quantified by
β= 8 xk2
A2ω
A2
ω
, (2)
wherekis the wave number,x is the elastic wave propagation distance, andAω andA2ω are the
47
absolute physical displacements of the fundamental and second harmonic waves [25].
48
A recent review [26] reports measurements of the amplitude of the second harmonic relative to
49
the amplitude of the first harmonic, in samples of aluminum alloy and of steel before and after plastic
50
elongation (0.2% in aluminum, 1.5% in low carbon steel). There is an unmistakable difference, at least
51
in part attributable to the presumed difference in dislocation density. However, there does not appear
52
to be an accepted model that quantitatively relates this unmistakable difference to a specific increase in
53
dislocation density (see [26] and references therein).
54
As reported above, RUS relies on linear theory. It provides a complete set of elastic constants
using one single measurement of the resonant spectrum in a given ultrasonic frequency range [27].
frequency [9–12,28]. The corresponding frequency shift∆f = fi− f0is related phenomenologically
with the average strain amplitude∆eby the nonlinear parameterα, defined through
∆f
f0 =α∆e=αγVrec=α
0V
rec, (3)
where f0is the resonant frequency in the linear regime. Here, we follow Payan [9]; instead of measuring 55
the straine, we measure the pressure sensor voltage amplitude,Vrec, so we measure the nonlinear
56
parameter α0, which will differ for samples with different dislocation densities. Also, we use the 57
method of Johnson to account for the effect of temperature [29].
58
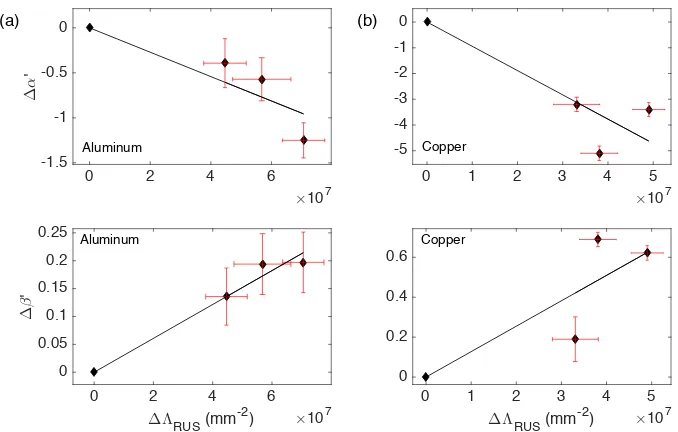
In this work, two groups of aluminum and copper samples have been used to perform RUS,
59
NRUS, SHG, as well as X-ray diffraction (XRD), measurements, the latter as a control method. We
60
show that the results using different acoustic methods are well correlated with those obtained by XRD
61
peak broadening profile analysis. The relative sensitivity of RUS, NRUS and SHG are presented and
62
we show that nonlinear parameters are more sensitive to the presence of dislocations than the linear
63
ones.
64
99.999 at% pure aluminum and 99.95 at% pure copper samples were used to perform RUS, NRUS,
65
SHG and XRD measurements. From the same as-received bar, four pieces were taken to prepare the
66
experimental samples: all samples were cold-rolled at 82.8% and 88.3% in the aluminum and copper
67
groups, respectively. Then, three samples of each group were annealed at about 70% of their melting
68
point for 15, 30 and 60 min, labeled as Roll A15, Roll A30 and Roll A60 respectively. The sample without
69
annealing was labeled only as Roll. It is well known that annealing leads to lower dislocation density,
70
and stronger cold-rolling leads to higher dislocation density [17]. For each one of the four pieces
71
per group, one portion was set aside for ultrasonic testing, and another two for XRD. For a correct
72
application of RUS, the pieces must be modelable as perfect parallelepipeds to avoid resonance shifts
73
[30]. The transverse wave speedvTis measured with RUS. The Al samples we analyzed had average
74
dimensions(0.500±0.003)×(1.704±0.003)×(5.005±0.003)cm3, and average density 2.667±0.005
75
gr/cm3. The Cu samples had average dimensions(0.399±0.005)×(1.701±0.001)×(5.001±0.003)
76
cm3, and average density 8.891±0.010 gr/cm3. Of course, precise measurements were made for
77
each single sample in order to correctly apply the characterization methods. The XRD samples had
78
dimensions(1.704±0.003)×(0.500±0.003)2cm3and(1.701±0.001)×(0.399±0.005)2cm3for the
79
Al and Cu groups, respectively.
80
Both the linear and the nonlinear resonant ultrasound spectroscopy used the same setup [17,31].
81
The positioning of the sample and its assembly conditions are the same as those described in [17].
82
RUS is used to measure the shear wave velocity, because the shear modulusC44can be determined
83
with much higher accuracy. The drive amplitude is 1 V in the linear regime. The frequency sweep is
84
performed between 26 kHz and 175 kHz, with 26 identified modes on average for Al. For Cu samples,
85
the range of frequencies is 19 kHz to 127 kHz, with 21 identified modes on average. Ten independent
86
measurements per sample were made to obtain associated statistical errors.
87
Imposing transverse isotropy, we have computed the anisotropy parametere=1−2C44/(C11− 88
C12) for both groups [32]; within experimental errors its is zero or very small for all samples. 89
Additionally, we have computed the transverse wave speed imposing both isotropy and transverse
90
isotropy in the RUS analysis and the differences obtained are.0.3%. XRD patterns show some degree
91
of texture, which we have quantified using the March-Dollase model. The March-Dollase parameters
92
for most reflections are close to 1. However, Cu peaks (220) and Al peaks (200) have parameters smaller
93
than 1 but with small weight factors. We finally conclude that Al and Cu samples have a low degree of
94
texture [33].
95
For NRUS application, the set up is exactly the same as for RUS. For both the Al and Cu groups,
96
the resonance frequency that was chosen is close to 49 kHz and 39 kHz, respectively. The exact value
97
depends on the specific dimensions of each sample. The reason for this choice was that the selected
98
modes were the most energetic in the frequency range studied. In the non-linear regime, we verified
that the resonance is asymmetric and that its amplitude ceases to be a linear function of the excitation
100
voltage.
101
The third acoustic method used in this work is SHG. In this case the experimental setup for
102
non-linear ultrasonic measurements is simpler than for RUS and NRUS. A continuous sine wave of
103
frequency f =3 MHz is transmitted into the material. Thus, a longitudinal wave is propagated across
104
the lengthd≈ 1.7 cm of each sample of both groups and the resulting response is analyzed for its
105
nonlinear features. Two equal transducers are placed on each side of the specimen (Panametrics - V110,
106
resonant at 5 MHz, with element diameter 8.8 mm). Through Fourier analysis of the received signal,
107
we measure the fundamental (A0ω) and the second harmonic (A02ω) amplitudes, in volts.
108
In general, the non-linear parameter is presented in units of 1/Volts [25]. This is because precise transducer calibrations are difficult at such low driving amplitudes, which occur even in the non-linear regime. Thus, following Matlack [25], instead of calculatingβin dimensionless form we measure
β0= A02ω/(A0ω)2, (4)
which is based on the amplitudes measured in voltage units.
109
XRD measurements were carried out with the same procedure and equipment reported by Salinas et al. [18] Microstructural parameters such as lattice parameteraand microstrainhe2i1/2, were obtained
from Rietveld refinements of the X-ray patterns with the Materials Analysis Using Diffraction (MAUD) software andLaB6(a=4.1565915(1)Å) as external standard for the determination of instrumental
broadening. Using the information provided by MAUD, it is possible to obtain a measurement of
dislocation densityΛXRDfor each Al and Cu sample through
ΛXRD= 24πE
GF
he2i
a2 , (5)
whereF≈5 for FCC materials,Eis Young’s modulus andGis the shear modulus. TheEandGvalues
110
used for Al were 74.4±1.9 GPa and 28.1±0.8 GPa, respectively. These values were calculated as an
111
average of those reported in [27,34,35]. For Cu,EandGused were 124.5±0.7 GPa and 45.4±1.2 GPa
112
respectively, obtained from [36]. We measured two pieces for the same sample of both groups, in order
113
to have an associated statistical error, beyond that provided by the refinement.
114
3. Results and discussion 115
Figure1shows an example of XRD pattern for an aluminum and copper sample. As in recent
116
works [18], there is not one crystallite size, but rather a distribution of sizes that contribute to each
117
diffraction peak, each one having an associated microstrain. Using the information about the volume
118
fraction of each phase provided by MAUD, the results forΛwere calculated as a weighted average of
119
results for differents crystallite sizes.
120
The results of the acoustics measurements are given in Table1, where the behavior of the linear
121
and nonlinear parameters is compared and contrasted. The linear parametervTshows variations
122
between purely rolled and annealed pieces between 1.7% and 2.6% for Al, and 2.9% and 4.4% for
123
Cu. The non-linear parameters are decreasing functions of the shear velocityvT. This means they are
124
increasing functions of dislocation density. The parameterα0shows remarkable changes: 39% to 125% 125
for Al, and 320% to 510% for Cu. Finally,β0has variations from 14% to 20% for Al, and 19% for 62% 126
for Cu.
127
Dislocation density measurements are reported in Table2. A RUS-determined dislocation density
128
ΛRUSis obtained using Eqn. (1), together with a typical dislocation segment lengthL≈150 nm for Al
129
andL≈230 nm for Cu. The results for the shear wave velocityvTreported above provide a variation
130
between samples of∆ΛRUS ≈ (4−7)×107mm−2 for the Al group and∆ΛRUS ≈ (3−5)×107
131
mm−2for the Cu group. In both cases the associated errors are less than 20%. The XRD-determined
132
dislocation densityΛXRD, as expected, is lower for annealed samples than for purely rolled ones.
40 50 60 70 80 90 100 0
70 100 130
Intensity
1/2 (Counts 1/2)
40 50 60 70 80 90
0 50 100 150 200 250 300
Intensity
1/2 (Counts 1/2)
44.7 44.8 44.9 45 45.1
0 50 100 150 200 250 300
Intensity
1/2 (Counts 1/2)
Al Experimental data Calculated data Al1 phase contribution Al2 phase contribution Al3 phase contribution Al4 phase contribution
Cu Experimental data
(a) (b)
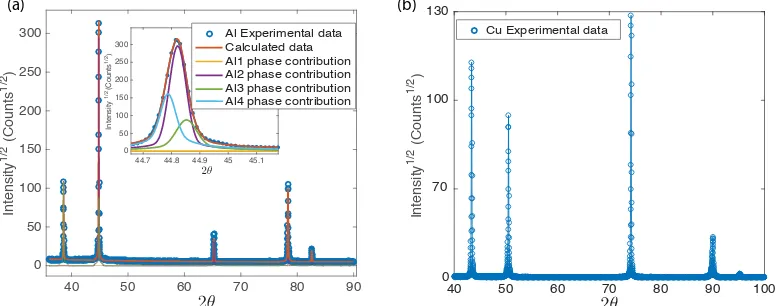
Figure 1.Example of (a) Aluminum and (b) Copper XRD pattern. (a) Five peaks are observed for Al, corresponding to different lattice planes: (111) (2θ=38.55◦), (200) (2θ=44.81◦), (220) (2θ=65.21◦), (311) (2θ=78.35◦) and (400) (2θ=99.22◦). Inset: A distribution of crystallite sizes (Ali,i=1, 2, 3, 4) contribute to the (200) diffraction peak (shown) as well as to the others (not shown). (b) For Cu samples, five peaks are observed in the angular range measured, corresponding to the following lattice planes: (111) (2θ=43.37◦), (200) (2θ=50.51◦), (220) (2θ=74.2◦), (311) (2θ=90.01◦) and (222) (2θ=95.23◦).
Table 1.Acoustic parameters, both linear and nonlinear, obtained for each group of samples compared and contrasted. Nonlinear parametersα0andβ0exhibit a considerably higher change from sample to sample than the linear parametervT. Errors are obtained by standard deviation of ten measurements with each method. See text for symbol definition.
Aluminum
Treatment vT(m/s) α 0
10−4 (V
−1)
β0(V−1)
Roll A60 3116±4 −39±8 0.42±0.02 Roll A30 3130±7 −44±7 0.39±0.02 Roll A15 3146±4 −63±5 0.39±0.02 Roll 3065±4 −28±5 0.49±0.01
Copper
Treatment vT(m/s) α 0
10−4 (V−1) β0(V−1)
Roll A60 2294±6 −168±21 0.90±0.10 Roll A30 2304±4 −244±31 0.35±0.01 Roll A15 2326±3 −176±18 0.42±0.01 Roll 2229±4 −40±10 1.11±0.03
However, the associated errors are so large that it is not possible to clearly differentiate between
134
pieces within each group. In any case, the values obtained are of the same order of magnitude of
135
the acoustically obtained values so they do provide a check on the latter method. In Figure2we
136
present the quantitative relation between the variations of the nonlinear parameters with respect to
137
the changes in dislocation density. In a first approximation, we obtain that∆α0and∆β0are linearly
138
dependent of∆ΛRUS. This method then provides a way to obtain dislocation density variations as
139
function of the changes of the acoustic nonlinear parameters, with a high sensitivity compared to linear
140
measurements. Thus, for a given material and once properly calibrated, one can indeed use the high
141
sensitivity of the nonlinear parameters in order to quantitatively study dislocation proliferation in
142
metals and alloys.
143
The nonlinear parameterβis defined through β ≡ −[3+ (C111/C11)][25], withC11andC111
the second- and third-order longitudinal elastic constants given byσ=C11e+ (C111+C11)e2+. . . ,
Table 2.Comparison of XRD and RUS measurements of relative dislocation density for the Al and Cu samples. Errors for XRD measurements are calculated with the contribution of the Rietveld refinement results and the statistical error from the repetition of the experiment in two pieces of the same sample. These errors are large and preclude a sample-to-sample comparison. By contrast, the errors associated with the acoustic measurements are sufficiently small that a quantitative comparison can be confidently provided.
Aluminum
Compared samples ∆ΛXRD
107 (mm−2) ∆Λ10RUS7 (mm−2)
Roll & Roll A60 1.24±1.47 4.47±0.70 Roll & Roll A30 0.87±1.35 5.68±0.96 Roll & Roll A15 0.42±7.12 7.07±0.69
Copper
Compared samples ∆ΛXRD
107 (mm
−2) ∆ΛRUS
107 (mm
−2)
Roll & Roll A60 2.34±21.74 3.31±0.51 Roll & Roll A30 4.73±19.35 3.81±0.41 Roll & Roll A15 5.04±19.0 4.90±0.35
volume induce a change∆C11given by∆C11/C11 =−32∆(nL3)/(45π2). The influence of dislocations
onβhas been studied by several authors [37–41]. Since this influence is a small effect, one has that the
change induced is proportional to dislocation density:∆C111/C111=B∆(nL3), with a dimensionless
constantBthat depends on the geometry and modeling employed. A simple calculation shows
∆β=−
∆C111
C111
−∆C11
C11
C111 C11
. (6)
Since, for aluminum and copper C111 ∼ −10C11 [42], this formula provides, a rationale for
144
understanding the factor of ten higher sensitivity ofβto dislocation density, compared to the second 145
order coefficient, as well as its increase, as long as∆C111/C111>∆C11/C11.
146
The parameterαdepends on the coupling between the different normal modes of an elastic
147
sample due to nonlinearities. Chakrapani and Barnard [43] have determined, both theoretically and
148
experimentally, the value ofαfor a purely longitudinal mode of a thin beam, and have inferred that 149
β=−KαwithK>0. Our measurements ofα0andβ0are consistent with this result (we remind that 150
from Eqns. (3) and (4), we haveα0∝αandβ0 ∝β). In particular, when the dislocation density increases 151
the material is more nonlinear with respect toβ, as it increases, but less nonlinear forαas it decreases 152
in its absolute value. However, further investigation and modeling is needed to ascertain a precise
153
formula for the influence of dislocations on the parameterα. 154
4. Conclusions 155
We have measured the change in the nonlinear parametersβ0andα0as a function of the change in 156
dislocation density in copper and aluminum, the change in dislocation densitynL3being determined
157
by linear acoustics. We have determined that a change ofnL3by a factor of ten leads to a 20-60%
158
change inβ0, and to a factor of two to six change inα0. We also explain the difference in about a factor 159
10 between the sensitivity of the linear and nonlinear measurements. These results pave the way for
160
the use of nonlinear acoustics as a sensitive, quantitative, probe of dislocation density in metals and
161
alloys.
162
Author Contributions:Conceptualization, C.E., C.A., R.E., F.L., V.S. and N.M.; Sample preparation, R.E.; RUS 163
measurements and analysis, C.E., D.F. and N.M.; NRUS and SHG measurements and analysis, C.E., V.S. and N.M.; 164
XRD measurements and analysis, C.E., V.S. and C.A.; writing, review and editing, C.E., C.A., R.E., F.L., V.S. and 165
0 2 4 6
×107
-1.5 -1 -0.5 0
∆
α
'
0 2 4 6
∆ΛRUS (mm-2) ×107 0
0.05 0.1 0.15 0.2 0.25
∆
β
'
0 1 2 3 4 5
×107
-5 -4 -3 -2 -1 0
0 1 2 3 4 5
∆ΛRUS (mm-2) ×107 0
0.2 0.4 0.6
Aluminum Copper
Aluminum Copper
(a) (b)
Figure 2.Normalized variations of nonlinear acoustic parametersα0andβ0of each sample respect to the purely rolled one as functions of the variations of dislocation density, obtained with the linear measurements. For both groups Al and Cu,∆ΛRUSare similar, which are obtained from changes in the transverse elastic wave speedvT, which are of the order of a few percent. (a) For the Al group,α0 shows changes of 39% to 125% andβ0of 14% to 20% (b) For the Cu group,α0shows changes of 320% to 510%, andβ0of 19% to 62%.
Funding: This work was funded by Fondecyt Grant 1160823, Fondecyt Postdoctoral Grant 3160164 and 167
FONDEQUIP EQM 140095. 168
Conflicts of Interest:The authors declare no conflict of interest. 169
Abbreviations 170
The following abbreviations are used in this manuscript: 171
172
RUS Resonant ultrasound spectroscopy TEM Transmission electron microscopy XRD X-ray diffraction
SHG Second harmonic generation
NRUS Nonlinear resonant ultrasound spectroscopy 173
References 174
1. Oh, S.H.; Legros, M.; Kiener, D.; Dehm G. In situ observation of dislocation nucleation and escape in a 175
submicrometre aluminium single crystal.Nat. Mater2009,8(2), 95-100. doi:10.1038/nmat2370 176
2. Landau, P.; Schneck, R.Z.; Makov, G.;Venkert, A. In-situ TEM study of dislocation patterning 177
during deformation in single crystal aluminum. J. Phys. Conf. Ser. 2010, 241(1), 012060. 178
doi:10.1088/1742-6596/241/1/012060 179
3. Zhang, L.; Sekido, N.; Ohmura, T. Real time correlation between flow stress and dislocation density in steel 180
during deformation.Mater. Sci. Eng.2014,A 611, 188-193. doi:10.1016/j.msea.2014.05.073 181
4. Du, J.; Mompiou, F.; Zhang, W. -Z. In-situ TEM study of dislocation emission associated with austenite 182
growth.Scripta Materialia2018,145, 62-66. doi:10.1016/j.scriptamat.2017.10.014 183
5. McSkimin, H.J. Pulse superposition method for measuring ultrasonic wave velocities in solids.J. Acoust. Soc.
184
Am. 1961,33, 12-16. 185
6. Chen, C.-H.Ultrasonic and Advanced Methods for Nondestructive Testing and Material Characterization; University 186
7. Chanbi, D.; Ogam, E.; Amara, S.E.; Fellah, Z. Synthesis and Mechanical Characterization of Binary and 188
Ternary Intermetallic Alloys Based on Fe-Ti-Al by Resonant Ultrasound Vibrational Methods.Materials2018, 189
11, 746. doi:10.3390/ma11050746 190
8. Tiwari, K.A.; Raisutis, R. Identification and Characterization of Defects in Glass Fiber Reinforced Plastic by 191
Refining the Guided Lamb Waves.Materials2018,11, 1173. doi:10.3390/ma11071173 192
9. Payan, C.; Garnier, V.; Moysan, J.; Johnson, P.A. Applying nonlinear resonant ultrasound spectroscopy 193
to improving thermal damage assessment in concrete. J. Acoust. Soc. Am. 2007, 121(4), EL125-30. 194
doi:10.1121/1.2710745 195
10. Muller, M.; Sutin, A.; Guyer, R.A.; Talmat, M.; Laugier, P.; Johnson, P.A. Nonlinear resonant ultrasound 196
spectroscopy (nrus) applied to damage assessment in bone. J. Acoust. Soc. Am. 2005,118, 3946-3952. 197
doi:10.1121/1.2126917 198
11. Payan, C.; Ulrich, T.J.; Le Bas, P.Y.; Saleh, T.; Guimaraes, M. Quantitative linear and nonlinear resonance 199
inspection techniques and analysis for material characterization: Application to concrete thermal damage.J.
200
Acoust. Soc. Am.2014,136, 537-546. doi:10.1121/1.4887451 201
12. Haupert, S.; Guérard, S.; Mitton, D.; Peyrin, F.; Laugier, P. Quantification of nonlinear elasticity for the 202
evaluation of submillimeter crack length in cortical bone.J. Mech. Behav. Biomed. Mater.2015,48, 210-219. 203
doi:10.1016/j.jmbbm.2015.04.013 204
13. Maurel, A.; Pagneux, V.; Barra, F.; Lund, F. Ultrasound as a probe of plasticity? The interaction of elastic 205
waves with dislocations.Int. J. Bifurcat. Chaos2009,19(8), 2765-2781. doi:10.1142/S0218127409024475 206
14. Maurel, A.; Pagneux, V.; Barra, F.; Lund, F. Wave propagation through a random array of pinned dislocations: 207
Velocity change and attenuation in a generalized Granato and Lücke theory.Phys. Rev. B: Condens. Mater.
208
2005,72, 174111. doi:10.1103/PhysRevB.72.174111 209
15. Granato, A.; Lücke, K. Theory of Mechanical Damping Due to Dislocations.Journal of Applied Physics1956, 210
27, 583. doi:10.1063/1.1722436 211
16. Migliori, A.;U. S. Patent; Patent number: 5.062.296, 1991. 212
17. Mujica, N.; Cerda, M.T.; Espinoza, R.; Lisoni, J.; Lund, F. Ultrasound as a probe of dislocation density in 213
aluminum.Acta Mater.2012,60, 5828-5837. doi:10.1016/j.actamat.2012.07.023 214
18. Salinas, V.; Aguilar, C.; Espinoza-González, R.; Lund, F.; Mujica, N. In situ monitoring of dislocation 215
proliferation during plastic deformation using ultrasound. Int. J. Plast. 2017, 97, 178-193. 216
doi:10.1016/j.ijplas.2017.06.001 217
19. Migliori, A.; Maynard, J.D. Implementation of a modern resonant ultrasound spectroscopy system for 218
the measurement of the elastic moduli of small solid specimens. Rev. Sci. Inst. 2018, 76, 121301. 219
doi:10.1063/1.2140494 220
20. Ulrich, T.J.; McCall, K.R.; Guyer, R. A.; Determination of elastic moduli of rock samples using resonant 221
ultrasound spectroscopy.J. Acoust. Soc. Am.2002,111, 1667-1674. doi:10.1121/1.1463447 222
21. Johnson, P.A.; Guyer, R.A.; Ostrovsky, L.A. Nonlinear mesoscopic elastic class of materials. Proceedings of 223
the International Symposium on Nonlinear Acoustics, Göttingen, Germany, September 1-4, 1999. 224
22. Kinney, J.H.; Gladden, J.R.; Marshall, G.W.; Marshal, S.J.; So, J.H.; Maynard, J.D. Resonant ultrasound 225
spectroscopy measurements of the elastic constants of human dentin. J. Biomech. 2004, 37, 437-441. 226
doi:10.1016/j.jbiomech.2003.09.028 227
23. Nakamura, N.; Ogi, H.; Hirao, M. Resonance ultrasound spectroscopy with laser-Doppler interferometry for 228
studying elastic properties of thin films.Ultrasonics2004,42, 491-494. doi:10.1016/j.ultras.2004.01.048 229
24. Herrmann, J. Assessment of material damage in a nickel-base superalloy using nonlinear Rayleigh surface 230
waves.J. Appl. Phys.2006,99, 124913. doi:10.1063/1.2204807 231
25. Matlack, K.H.; Kim, J.Y.; Jacobs, L.J.; Qu, J. Review of Second Harmonic Generation Measurement Techniques 232
for Material State Determination in Metals.J. Nondestruct. Eval.2015, 34-273. doi:10.1007/s10921-014-0273-5 233
26. Hirao, M.; Ogi, H.Electromagnetic Acoustic Transducers. Springer Japan, Japan, 2017; pp. 209-216; ISBN 234
978-4-431-56036-4. 235
27. Ogi, H.; Sato, K.; Asada, T.; Hirao, M. Complete mode identification for resonance ultrasound spectroscopy. 236
J. Acoust. Soc. Am.2002,112(6), 2553-2557. doi:10.1121/1.1512700 237
28. Van Den Abeele, K.; Carmeliet, J.; Ten Cate, J.A.; Johnson, P.A. Nonlinear elastic wave spectroscopy (NEWS) 238
techniques to discern material damage. Part II: Single-mode nonlinear resonance acoustic spectroscopy.Res.
239
29. Haupert, S.; Renaud, G.; Riviere, J.; Talmant, M.; Johnson, P. A.; Laugier, P. High-accuracy acoustic detection 241
of nonclassical component of material nonlinearity. J. Acoust. Soc. Am. 2011, 130(5), 2664-2661. doi: 242
10.1121/1.3641405 243
30. Spoor, P.S. Elastic Properties of novel materials using PVDF film and Resonant Acoustic Spectroscopy. Ph. D. 244
Thesis, The Pennsylvania State University, 1996. 245
31. Espinoza, C. Caracterización de densidad de dislocaciones mediante espectroscopía de resonancia ultrasónica 246
no lineal. M. Sc. Thesis, Universidad de Chile, 2013. 247
32. Spoor, P.S.; Maynard, J.D.; Kortan, A.R. Elastic Isotropy and Anisotropy in Quasicrystalline and Cubic 248
AlCuLi.Phys. Rev. Lett.1995,75, 3462. doi:10.1103/PhysRevLett.75.3462 249
33. Zolotoyabko, E. Fast quantitative analysis of strong uniaxial texture using a March-Dollase approach.J. Appl.
250
Cryst.2013,46, 1877-1879. doi:10.1107/S0021889813027738 251
34. Lincoln, R.C.; Koliwad, K.M.; Ghate, P.B. Morse-Potential Evaluation of Second- and Third-Order Elastic 252
Constants of Some Cubic Metals.Phys. Rev., Second Series1967,157(3), 463-466. doi:10.1103/PhysRev.157.463 253
35. Vallin, J.; Mongy, M.; Salama, K.; Beckman; O. Elastic Constants of Aluminum. J. Appl. Phys. 1964,35, 254
1825-1826. doi:10.1063/1.1713749 255
36. Ledbetter, H.M.; Naimon, E. R. Elastic Properties of Metals and Alloys. II. Copper.J. Phys. Chem. Ref. Data
256
1974,3(4), 897-935. doi:10.1063/1.3253150 257
37. Cantrell, J.H. Nonlinear dislocation dynamics at ultrasonic frequencies. J. Appl. Phys.2009,105, 043520. 258
doi:10.1063/1.3081972 259
38. Suzuki, T.; Hikata, A.; Elbaum, C. Anharmonicity Due to Glide Motion of Dislocations.J. Appl. Phys.1964, 260
35, 2761. doi:10.1063/1.1713837 261
39. Cash, W.D.; Cai, W. Dislocation contribution to acoustic nonlinearity: The effect of orientation-dependent 262
line energy.J. Appl. Phys.2011,109, 014915. doi:10.1063/1.3530736 263
40. Zhang, J.; Xuan, F.; Xiang, Y. Dislocation characterization in cold rolled stainless steel using 264
nonlinear ultrasonic techniques: A comprehensive model. Europhys. Lett. 2013, 103, 68003. 265
doi:10.1209/0295-5075/103/68003 266
41. Zhang, J.; Xuan, F. A general model for dislocation contribution to acoustic nonlinearity.Europhys. Lett.2014, 267
105, 54005. doi:10.1209/0295-5075/105/54005 268
42. Lubarda, V.A. New estimates of the third-order elastic constants for isotropic aggregates of cubic crystals.J.
269
Mech. Phys. Solids.1997,45(4), 471490. doi:10.1016/S0022-5096(96)00113-5 270
43. Chakrapani, S.K.; Barnard, D.J. Determination of acoustic nonlinearity parameter (β) using nonlinear
271
resonance ultrasound spectroscopy: Theory and experiment. J. Acoust. Soc. Am. 2017,141(2), 919. doi: 272