Article
Quantifying the spatiotemporal patterns of
urbanization along urban-rural gradient with a
roadscape transect approach: a case study in
Shanghai, China
Zhonghao Zhang 1, 2,*, Yaojen Tu 1,* and Xin Li 2
1 Institute of urban studies, Shanghai Normal University, Shanghai 200234, China
2 Cold and Arid Regions Environmental and Engineering Research Institute, Chinese Academy of Sciences,
Lanzhou 730000, China; [email protected]
* Correspondence: [email protected] (Z.Z.); [email protected] (Y.T.); Tel.: +86-150-265-68592 (Z.Z.); +86-136-619-20584 (Y.T.)
Abstract: Quantifying the landscape pattern change can effectively demonstrate the ecological progresses and the consequences of urbanization. Based on remotely sensed land cover data in 1994, 2000, 2006 and a gradient analysis with landscape metrics at landscape- and class- level, we attempted to characterize the individual and entire landscape patterns of Shanghai metropolitan during the rapid urbanization. We highlighted that a roadscape transect approach that combined the buffer zone method and the transect-based approach was introduced to describe the urban-rural patterns of agricultural, residential, green, industrial, and public facilities land along the railway route. Our results of landscape metrics showed significant spatiotemporal patterns and gradient variations along the transect. The urban growth pattern in two time spans conform to the hypothesis for diffusion–coalescence processes, implying that the railway is adaptive as a gradient element to analyze the landscape patterns with urbanization. As the natural landscape was replaced by urban landscape gradually, the urban fringe expanded radically. The results also showed that the desakota region expanded its extent widely. Satellite towns witnessed the continual transformation from the predominantly rural landscape to peri-urban landscape. Furthermore, the gap between urban and rural areas remained large especially in public service. More reasonable urban plans and land use policies should push to make more of an effort to transition from the urban-rural separation to coordinated urban-rural development. This study is a meaningful trial in demonstrating a new form of urban–rural transects to study the landscape change of large cities from a strategic viewpoint. By combining gradient analysis with landscape metrics, we addressed the process of urbanization both spatially and temporally, and provided a more quantitative approach to urban studies.
Keywords: urban-rural gradient; spatiotemporal patterns; landscape metrics; a roadscape transect approach; rapid urbanization; Shanghai
PACS: J0101
1. Introduction
highly fragmented and complicated form [6]. Furthermore, the speed, growth modes, and landscape pattern of urbanization are broadly related to each other. Hence, integrated studies focused on both human and natural systems is necessary in illustrating these complex systems and processes [7]. Scholars argued that understanding this urban–rural interaction and its new landscape patterns is critical to understanding China’s tremendous rapid social and economic transformation in recent years. Thus, quantifying the urbanization patterns and the ecological processes in a spatial and temporal perspective is a key point to solve the societal, economic and environmental problems [4, 8, 9].
The recent rapid urbanization taking place in east Asia has exhibited a process that is distinctly different from that of the Western developed countries. This has contributed to the emergence of a new landscape which is characterized by an intense mix of agricultural, industrial, residential and other land types that are distributed between urban cores and rural areas [10, 11]. Shanghai–Nanjing– Hangzhou urban agglomeration in China’s lower Yangtze Delta is widely known as the desakota regions defined by McGee–Ginsburg model [10]. From an economic, environmental and social viewpoint, the urban–rural interface represents an intricate space that relies on the mutual dependence of both cities and rural areas [8]. Scholars suggested that understanding the rural–urban nexus and this new landscape pattern is a key to realize China’s tremendous social and economic transformation [12, 13].
Urbanization gradients are indirect and complex [14], the regional urbanization is partly determined by its proximity to the urban center [15]. To understand the overall mechanism driving regional urbanization, it is therefore necessary to explore urbanization along the urban-rural gradient and the associated contribution to regional development. Since McDonnell and Pickett [16] proposed a framework that provided a hierarchical approach to detect the multiple environmental changes associated with urbanization, the urban-rural gradient approach has been widely applied in urban landscapes ecology for describing the landscape pattern changes caused by rapid urbanization around the world [14, 17]. Integrating ecological, social, and physical factors, the GIS-based gradient methods have proved to be powerful tools for exploring spatiotemporal dynamics and the ecological consequences of urbanization [8, 18]. In the majority of previous studies, although the urban–rural gradient was identified and investigated widely, the main focus was on the spatiotemporal component of the ongoing urban growth and sprawl. McDonnell and Hahs [14] pointed out that few studies addressed the importance of transect selection itself. Despite this, the gradient approach has made a significant contribution to our understanding of the ecology across urban and rural landscapes. More specific measures can be used to gain mechanistic understanding of spatiotemporally ecological progress responses to urbanization gradients.
Anthropogenic gradients can be indirectly used to evaluate the response to changes in landscape characteristics [19]. As the spatial determinants of urban expansion and a transport system that interacts with surrounding landscapes, road networks can significantly disturb the ecological flows, spatiotemporal patterns of urban expansion, and settlement distribution [20, 21]. Since the roads exerted intense influences on landscape patterns [22], they can serve as indicators of urbanization intensity. In China, railways played an important role in the economic development and urban construction during past decades, and as a result it can indicate the urbanization intensity to a certain extent. Furthermore, railways are the only type of road that run straight through the urban center, because the accessibility to urban core is one of the most striking and important factors to be considered in designing railway routes. Due to its unique characteristics, the roadscape transect approach, which indicates the landscape pattern changes along railway routes, can serve as a potential measure of urban gradient analysis.
paradigm in urban morphology, especially from a comparative perspective of landscape patterns. In order to bring the public’s attention to societal and eco-environmental consequences of the rapid urbanization, the purposes of this study are threefold: (1) methodologically, to test whether the gradient analysis with landscape metrics along the railway route can be an effective approach in detecting the characteristics of urbanization pattern; (2) theoretically, to summarize the general temporal and spatial trends of the individual and entire landscape patches change, and the characteristics of landscape metrics along an urban-rural gradient with the rapid urbanization; and (3) practically, to provide the suggestion and implications for urban land-use planning in dealing with the consequences of rapid urbanization, such as desakota pattern and urban-rural separation. Superior to the previous studies about urban–rural gradient detection and development of city, this study emphasized the urbanization process of individual and entire landscapes in both spatial and temporal pattern, and focus on the landscape patterns from the urban core to rural areas with a gradient along the railway route.
2. Study area
With a residential population of over 20 million and total land area over 6,300 km2, Shanghai is located on the east coast of China, with Jiangsu and Zhejiang province being its northwestern and southwestern neighbors respectively (Figure 1). As a central city of Yangtze River Delta Urban Agglomeration, Shanghai and its suburbs were selected as the study area. By using spatial analysis along railway route through the city, the authors attempted to describe the urbanization intensity and patterns towards different direction from the city center along an urban-rural gradient.
Figure 1. The location of shanghai city and the transect belts along the railway route.
Relying on the hinterlands of the Yangtze River Delta, the richest area in China, Shanghai has been the most important center for manufacturing, commerce, and international trade with the urban area increasing from 91.5 km2 in 1947 to more than 1300 km2 in 2010. With an urbanization rate approaching 90% in the 2010s, Shanghai has experienced unprecedented economic growth and land transformation [26]. However, the desakota pattern of Shanghai was most prominent after the 1990s because of rapid regional urbanization due to the establishment of the Pudong New Area [11]. As a whole, Shanghai could serve as a representative site to explore the generality of desakota pattern to better recognize the spatiotemporal changes of urbanization of metropolitans in China.
3. Data preparation and methods
Land use data was acquired based on a time-series of false-color infrared aerial photos acquired in 1994, 2000 and 2006, respectively. These aerial photos were georeferenced to the WGS84 coordinate system and were mosaicked to cover the whole study area. Based on the digitized aerial photos, the vector land use dataset was drawn by visual interpretation using ArcInfo GIS 10.0 [27]. The land use type was classified into eight classes as below (Figure 2): agricultural land (AL), industrial land (IL), green land (GL), residential land (RL), public facilities (PF), transportation (TR), water (WA) and unused land (UL). Finally, the vector data was converted to raster with a 10 m × 10 m spatial resolution. The map of railway and subway Line 1 at the scale of 1:100,000 were provided by the Shanghai Bureau of Surveying and Mapping in ARCGIS shapefile format. All the data layers were georeferenced to the same coordinate system.
Figure 2. The land use map of Shanghai metropolitan region.
3.2 The urban-rural gradient transect along the railway route
Recently, scholars have attempted to propose a variety of measurements to describe the spatiotemporal landscape pattern changes caused by rapid urbanization. There are two commonly used ways to implement an urban–rural gradient analysis with landscape metrics. One is based on the buffer zones, with which landscape metrics are derived for a series of concentric circles with the urban core as their centers [15, 28]. The other is transect-based approach, landscape metrics are calculated along a transect which is delineated from the urban center to rural area [8, 23]. However, both of the two measures have their own advantages and disadvantages.
3.3 Landscape metrics
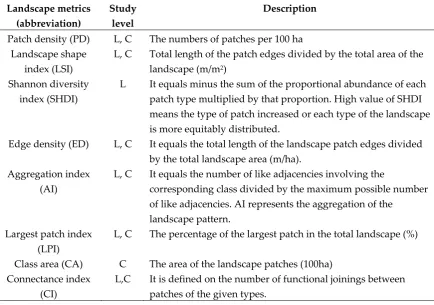
To quantify the changes in landscape patterns along the railway, landscape- and class-level metrics were implemented to capture the synoptic features. Landscape metrics used in ecological studies focused mainly on size, density, shape, edge, connectivity, diversity, etc. The redundancy and overlap among landscape metrics is common [29], so not all of them were needed as the indicators of landscape composition and configuration. Based on previous research [4, 30] and the pre-experiments incorporated in correlation with analysis among metrics, seven landscape-level metrics (PD, ED, SHDI, LPI, LSI, AI and CI) and seven class-level metrics (CA, PD, ED, AI, LSI, LPI and CI) were adopted (Table 1). All the calculation were conducted under the software FRAGSTATS 4.0 [31] based on the LULC data acquired from the aerial photos. By doing this, the authors tried to describe the landscape pattern changes along the railway from rural area to urban center.
Table 1. The landscape metrics and their descriptions (L: landscape level, C: class level).
Landscape metrics (abbreviation)
Study level
Description
Patch density (PD) L, C The numbers of patches per 100 ha Landscape shape
index (LSI)
L, C Total length of the patch edges divided by the total area of the landscape (m/m2)
Shannon diversity index (SHDI)
L It equals minus the sum of the proportional abundance of each patch type multiplied by that proportion. High value of SHDI means the type of patch increased or each type of the landscape is more equitably distributed.
Edge density (ED) L, C It equals the total length of the landscape patch edges divided by the total landscape area (m/ha).
Aggregation index (AI)
L, C It equals the number of like adjacencies involving the
corresponding class divided by the maximum possible number of like adjacencies. AI represents the aggregation of the
landscape pattern. Largest patch index
(LPI)
L, C The percentage of the largest patch in the total landscape (%)
Class area (CA) C The area of the landscape patches (100ha) Connectance index
(CI)
L,C It is defined on the number of functional joinings between patches of the given types.
4. Results
4.1 Synoptic characteristics of the landscape patterns from 1994 to 2006.
Figure 3. Synoptic characteristics of the landscape metrics in the transect at landscape level from 1994 to 2006 (A: Region A; B: Region B).
Because there was very little available data for both the water body (WD) and unused land (UL) along the gradient, and the railway was incorporated in the transportation land (TR), these three types were not considered in our test. The other five kinds of landscape, residential land (RL) (Figure 4.a), agricultural land (AL) (Figure 4.b), industrial land (IL) (Figure 4.c), green land (GL) (Figure 4.d), and public facilities (PF) (Figure 4.e) showed specific trends and patterns individually. The residential land (RL) doubled in area from 1994 to 2006 in both region A and B, while the area of industrial land (IL), public facilities (PF) and green land (GL) all increased by several times, due to the occupation of more than half of the agricultural land (AL) during this period. In general, the PD, ED and LSI of IL, GL and PF showed similar patterns, with a low value in 1994 and a progressive increase in T1 and T2. However, the PD, ED and LSI of AL and RL had peak values in 2000 and exhibited decrease trends in T2 after the exponential growth in T1. The result revealed that changes of IL, GL and PF are not synchronized with that of AL and RL in the urbanization process. In both region A and B, the LPI of IL and AL decreased gradually, whereas the LPI of RL decreased first in T1 and then increased in T2. For the LPI of PF and GL, there was a slightly different trend. The value in Region A decreased gradually, whereas the value in Region B decreased from 1994 to 2000 and then increased from 2000 to 2006. The new patches of public facilities and green land emerged and aggregated into large ones. The CI of GL and AL decreased during two time intervals, indicating that the lower connectivity weakened the function of their ecological services for the city.
Figure 4. The landscape characteristics of individual land use type from 1994 to 2006 (A: Region A; B: Region B).
4.2 The characteristics of landscape-level patterns along the urban-rural gradient
since the 1990s, with its SHDI increasing and CI decreasing. Refer to Sui and Zeng [11], the landscape pattern changes and excessive land conversion in these areas were distinctly consistent with the typical description of desakota pattern. As a whole, the landscape patterns of the urban center matched the three steps according with the urbanization theory, On the other hand, the suburbs (Jiading, Minhang and Songjiang) exhibited a diffusion process with steady-state growth in diversity and fragmentation during the whole study period.
Figure 5. Landscape pattern metrics at landscape level along the transect across Shanghai metropolitan.
4.3 The gradient analysis of landscape patterns with class-level metrics along the railway
residential patches. However, the urban core areas and the suburban areas demonstrated coalescence characteristics in T2, especially at the location from -20km to +20km. LPI exhibited multiple peak pattern in city and suburbs in 1994, with great fluctuation in the gradient belt. In comparison to LPI, AI showed a gentle trend of change. Low LPI combined with high AI in suburbs indicated that residential patches are well separated from each other, with more scattered distribution in space. These two metrics had the largest values in 1994 and decreased gradually as the urbanization progress went on, implying some reasonable plans and effectively measures for residential land had been taken to improve the low land-use efficiency due to loose distribution and uneven regional development. The landscape transect analysis results for RL can be used to test the hypotheses for the spatial configuration and composition dynamic of urban sprawl in different stages.
Figure 6. Landscape pattern metrics for residential land along the transect across Shanghai metropolitan.
30 km) since the agricultural land area was heavily occupied by man-made systems. Considering the changes of landscape metrics, AI and LPI decreased dramatically in both T1 and T2, showing a fluctuating trend along the gradient. Similar to RL, the PD, ED and LSI changed synchronously during 1994-2006, with the highest and lowest values in 2000 and 1994 respectively. These three indices generally increased in T1, but decreased slightly in T2. The irregularity, fragmentation and shape complexity of agricultural land showed a trend of rise to decline. One explanation for this is may be that the shrinking farmland with high fragmentation was occupied and disappeared with the urbanization course proceeding [32].
Figure 7. Landscape pattern metrics for agricultural land along the transect across Shanghai metropolitan.
Figure 8. Landscape pattern metrics for industrial land along the transect across Shanghai metropolitan.
Figure 9. Landscape pattern metrics for public facilities along the transect across Shanghai metropolitan.
Figure 10. Landscape pattern metrics for green land along the transect across Shanghai metropolitan.
5. Discussion and Conclusion
5.1 The metrics varying characteristics for individual and entire landscape
In this study, landscape metrics are informative in distinguishing dynamics and patterns of LULC and varied their descriptive ability and sensitivity. Therefore, a group of meaningful metrics that can be applied in exploring spatial patterns and related temporal landscape changes, should be jointly applied to identify the characteristics of urbanization patterns.
and low connection, and this trend will last until urbanization levels reach a certain degree [23]. These configurational metrics decreased progressively when the samples moving from human-made systems to the natural landscapes and temporally exhibited S-shaped curve during the urbanization period. Urban studies by scholars around the world have found these patterns to be overwhelmingly common [1, 8, 23, 33].
As an indicator of the landscape diversity, SHDI exhibited a wave-like pattern moving from urban to the rural area, with a greater growth in suburbs than that in urban center (Figure 5). A hypothesis indicated that SHDI would increase until the landscape is highly urbanized and intensely heterogeneous [34]. Both high and low values of SHDI existed in urban areas. It is easy to realize that highly urbanized areas would be more homogeneous than developing areas. In contrast, indicating the aggregation and connection of the landscape, AI and CI uniformly decreased during the whole study period. This reflected individual patches that became more scatter and isolate due to urban development, which is consistent with former studies [24, 35]. In regard to the majority of the land use types, LPI for RL, AL and IL showed high variance along the gradient, while higher values appeared in rural and urban center. The dominant species, such as AL in rural areas and RL in the urban core, steady decreased in the process of urbanization. As a whole, these compositional metrics displayed uniform changes in both of the two time stages, and exhibited slightly different patterns when compared to the compositional metrics.
5.2 The spatiotemporal pattern of landscape changes under rapid urbanization
Comparative and temporal analyses of landscape metrics reveal that the urban form of cities can change relatively quickly over short time periods. Previous studies reported that urban growth regularly exhibited a spatiotemporal pattern of U-shaped profile or a wave-like characteristic in response to the land use changes [28, 36]. The outward wave-like patterns of peak values for metrics showed that the continuous spread of urban expansion made Shanghai city push its borders farther from its heartland. Meanwhile, the area with desakota pattern increased in magnitude during the study period. In this study, the spatial evolution of urbanization in the urban center can be described as a two-step process. A shift from diffusion to coalescence when the entire landscape became more compacted and heterogeneous, declined in shape complexity, and increased in diversity, which was characterized by the decrease of PD, LSI and SHDI. This distinct process confirmed the hypothesis proposed by Seto and Fragkias [3].
Moving towards the semi-natural landscapes, the satellite towns surrounding Shanghai’s downtown, such as Jiading, Minhang and Songjiang, absorbed potential suburban development, and witnessed the continual transformation from the predominantly natural landscape to human-made landscape, in accordance with desakota pattern. Higher shape complexity in suburbs is associated with mixed landscapes dominated by residential and industrial land. This was due to their increase in human settlement and industrial investment since the Pudong development and opening up [37]. The landscape patterns in these areas showed increased PD, ED, LSI and SHDI, decreased CI, LPI and AI, which together indicated urbanization resulting in more irregular, scattered, fragmented, isolate, diversified and heterogeneous landscape in suburbs of Shanghai. The results were consistent with Forman and Godron [38], which stated that along a landscape modification gradient patch density and shape would increase, meanwhile landscape connectivity would decrease with urbanization. The results of LPI implied that the residential and industrial land occupied most portions of landscape area within the rural-urban fringes, where natural landscape were originally dominated by agricultural and green land [33]. Highly mixed landscape emerged in suburbs due not only to the “top-down” forces from urban center, but the “down-top” influences exerted by suburbanization from rural industrialization as well [39]. These findings are applicable and helpful to the management of peri-urban areas.
experienced more fragmented and irregular patterns in suburbs. The residents and governments, in order to produce more revenue from land sales, expanded RL and IL outward in a disorderly manner. The new growth of urban districts was often generated by the elimination of semi-natural areas in satellite cities or suburbs around the existing urban places [5]. Great loss due to high vulnerability of agricultural land was a direct consequence of high-intensity land use, and has been highlighted in previous studies [33, 40]. In addition, the constant decrease of AL was partly due to the abandoned farmland which was widespread in Yangtze River delta [9]. Considering the large variation of PF and GL along the gradient, the inequality in basic public service, ecological and environmental conservation is about the gap between urban and countryside, as well as within satellite towns. In addition, the construction of GL and PF had not kept pace with the rapid urbanization, and formed the uneven distribution of public utilities and green facilities in time and space. The gap between urban and rural areas remain large. In general, according to Weng [24], landscape fragmentation, and irregularity and diversity have a positive relationship with urbanization level in the rapid urbanization stage (T1). However, the authors found no significant relationships among them in T2. This is due to its complex changes of landscape patterns in coalescence process of urban expansion. As a whole, the results of spatial and temporal landscape pattern above were similar to that reported for other large cities around the world, urbanization along the urban–rural gradient showed a complex form in this study.
5.3 Gradient analysis along railway route as a new form transects
Human activity is a major force in shaping landscape structure with a mosaic of natural and human-made patches that vary in type, size, shape and arrangement, generating anthropogenic gradients with a specific succession of natural–cultivated–suburban–urban landscapes [33, 41]. From an ecological perspective, the urban–rural gradient belts should be able to capture the structure and function of human influence in the temporal and spatial differences from rural to urban landscapes [13]. An alternating process of diffusion and coalescence, and distinctly gradient variation were observed along the gradient analysis, tested that the railway was effective as a gradient element to analyze the landscape pattern changes with urbanization. Different from the unimodal shape patterns in previous studies [8, 28], multiple peaks of metrics were exhibited in our experiment. Not just intensive natural landscapes but also the land covers dominated by built-ups were characterized with relatively low variability for these metrics. Whereas the urban–rural transitional landscapes had the highest variability for landscape metrics, due to their intrinsic characteristics of the mixed and complicated components in land use data. Comparing the two sides of the urban center along the transect, metrics exhibited similar patterns, but with more peaks exhibited in the region A than region B. This indicated that the urbanization process was more complex in Songjiang and Minhang district. Thus, it can be seen that different results may be obtained using different transect of the partitions in a study area. The selection of transects gradient paradigm should be given enough attention when characterizing the complexity of urban development pattern and the driving forces.
metrics in T2 is smaller than that in T1, demonstrating the railway decreased its disturbances of surrounding landscapes.
5.4 The suggestion and implications for urban development
Combining gradient analysis with landscape metrics, the spatial and temporal pattern of urbanization were discovered by examining landscape metrics variations that stretch from the urban center, through the suburbs, and to the rural area in Shanghai. According to the study, the area loss of agricultural land with high fragmentation, which was stated to have negative effects on humans and nature [46, 47], was already a severe problem in large cities like Shanghai around the world [48, 49]. From the 1980s, decision-making rights of land use were devolved from central government to local levels, and the transfer of land use rights via the land market and land leasing was allowed in China [11]. As a result, the rapid reduction of arable land and the prevailing abandoned farmland in this area not only resulted in great waste of land resources, but also decreased the resilience of eco-environment [50]. From the perspective of landscape ecology, the authors suggested to merge fragmented farmland patches into the core farmland and keep a balance between farmland occupation and compensation. More efficient laws or policies for protecting the valuable farmland desperately need to be introduced in Shanghai metropolitan desperately. Formulation of reasonably overall land use plans for using land resources scientifically is necessary.
Our results showed that the expansion of desakota regions resulted in high land use diversity, fragmented structure and irregular shape of both the individual and entire landscape from 1994 to 2006. With the urban fringe extending outward, the built-ups were spread out disorderly and rural residential areas stood alone in the agricultural land, reflecting the weakness of earlier urban plans in this area. Drawn from the lessons of Western countries, the size of cities as well as geographical extent of desakota regions must be tightly controlled by a threshold [51]. Growth control policies need to optimize the configuration and utilization of land-use within the desakota region [11]. The Jiading, Minhang and Songjiang district should take their own traditionally superiorities on the close interactions with Jiangsu and Zhejiang province respectively. In addition, many industrial polluters within the central districts were forced to move to these suburban areas since the 1990s, because the environmental policies focused strictly on controlling pollution emissions in urban area [52]. Accordingly, the authors suggested plan-makers form reasonable industrial layouts by balancing economic growth with the environmental protection.
With greater insight into the changes of landscape patterns along an urban–rural gradient, the uneven distribution of public facilities and green land reflects the existing dual urban-rural socioeconomic structure that was a main obstacle for regional development. Urban-rural equalized development is considered an effective way to narrow the societal, social-economic, and environmental gaps between urban and rural areas in China [53]. According to our findings, the most effective way is to speed up both rural urbanization and suburbanization by extending public infrastructure and green space from the downtown to satellite towns and rural areas. You [54] pointed out that urbanization in Shanghai involving demographic, social, economic and spatial processes interacted with each other at a low coupling coordination degree. Therefore, the local government should make an effort in transitioning from the urban-rural separation to coordinated urban-rural development. Furthermore, in the context of urbanization and eco-environment protection, the establishment of rational urban planning and land use policies for urban and rural integration frameworks are urgent in order to achieve coordinated urbanization development not only for Shanghai city but for the Yangtze River Delta urban agglomeration.
Limitations
development in depth. Finally, more GIS-based models for the research in driving forces and prediction of urban expansion should be introduced in our future work.
Acknowledgments:
This research was funded in part by the supported by the "13th Five-Year" Key Project of Science and Technology (Grant NO: 2016YFC0502706), and Shanghai Gaofeng & Gaoyuan Project for University Academic Program Development.
Author Contributions:
All authors contributed equally to this work. Zhonghao Zhang, Yaojen Tu and Xin Li conceived and designed the experiments. Zhonghao Zhang and Yaojen Tu analyzed the data; Zhonghao Zhang and Xin Li wrote the paper.
Conflicts of Interest:
The authors declare no conflict of interest.
References
1. Schneider, A.; Woodcock, C. E., Compact, dispersed, fragmented, extensive? A comparison of urban growth in twenty-five global cities using remotely sensed data, pattern metrics and census information. Urban Studies 2008, 45, (3), 659-692.
2. Gan, M.; Deng, J.; Zheng, X.; Hong, Y.; Wang, K., Monitoring urban greenness dynamics using multiple endmember spectral mixture analysis. PloS one 2014, 9, (11), e112202.
3. Seto, K. C.; Fragkias, M., Quantifying spatiotemporal patterns of urban land-use change in four cities of China with time series landscape metrics. Landscape ecology 2005, 20, (7), 871-888.
4. Wu, J.; Jenerette, G. D.; Buyantuyev, A.; Redman, C. L., Quantifying spatiotemporal patterns of urbanization: The case of the two fastest growing metropolitan regions in the United States. Ecological Complexity 2011, 8, (1), 1-8.
5. Xie, Y.; Yu, M.; Bai, Y.; Xing, X., Ecological analysis of an emerging urban landscape pattern—desakota: a case study in Suzhou, China. Landscape Ecology 2006, 21, (8), 1297-1309.
6. Antrop, M., Landscape change and the urbanization process in Europe. Landscape and Urban Planning 2004, 67, (1-4), 9-26.
7. Bagan, H.; Yamagata, Y., Landsat analysis of urban growth: How Tokyo became the world's largest megacity during the last 40years. Remote sensing of Environment 2012, 127, 210-222.
8. Luck, M.; Wu, J., A gradient analysis of urban landscape pattern: a case study from the Phoenix metropolitan region, Arizona, USA. Landscape ecology 2002, 17, (4), 327-339.
9. Li, C.; Li, J.; Wu, J., Quantifying the speed, growth modes, and landscape pattern changes of urbanization: a hierarchical patch dynamics approach. Landscape Ecology 2013, 28, (10), 1875-1888.
10. McGee, T. G., Urbanisasi or kotadesasi? Evolving patterns of urbanization in Asia. Urbanization in Asia: Spatial dimensions and policy issues 1989, 108.
11. Sui, D. Z.; Zeng, H., Modeling the dynamics of landscape structure in Asia’s emerging desakota regions: a case study in Shenzhen. Landscape and urban planning 2001, 53, (1), 37-52.
12. Tavares, A.; Pato, R.; Magalhães, M., Spatial and temporal land use change and occupation over the last half century in a peri-urban area. Applied Geography 2012, 34, 432-444.
13. Schneider, A., Monitoring land cover change in urban and peri-urban areas using dense time stacks of Landsat satellite data and a data mining approach. Remote Sensing of Environment 2012, 124, 689-704. 14. McDonnell, M. J.; Hahs, A. K., The use of gradient analysis studies in advancing our understanding of the
ecology of urbanizing landscapes: current status and future directions. Landscape Ecology 2008, 23, (10), 1143-1155.
15. Li, X.; Zhang, L.; Liang, C., A GIS-based buffer gradient analysis on spatiotemporal dynamics of urban expansion in Shanghai and its major satellite cities. Procedia Environmental Sciences 2010, 2, 1139-1156. 16. McDonnell, M. J.; Pickett, S. T., Ecosystem structure and function along urban-rural gradients: an
unexploited opportunity for ecology. Ecology 1990, 71, (4), 1232-1237.
17. Qureshi, S.; Haase, D.; Coles, R., The Theorized Urban Gradient (TUG) method—A conceptual framework for socio-ecological sampling in complex urban agglomerations. Ecological Indicators 2014, 36, 100-110. 18. Li, H.; Wei, Y. H. D.; Huang, Z., Urban land expansion and spatial dynamics in globalizing shanghai.
Sustainability 2014, 6, (12), 8856-8875.
20. Zhu, M.; Xu, J.; Jiang, N.; Li, J.; Fan, Y., Impacts of road corridors on urban landscape pattern: a gradient analysis with changing grain size in Shanghai, China. Landscape Ecology 2006, 21, (5), 723-734.
21. Ahlfeldt, G. M.; Wendland, N., Fifty years of urban accessibility: The impact of the urban railway network on the land gradient in Berlin 1890–1936. Regional Science and Urban Economics 2011, 41, (2), 77-88.
22. Liu, Y.; Wang, H.; Jiao, L.; Liu, Y.; He, J.; Ai, T., Road centrality and landscape spatial patterns in Wuhan Metropolitan Area, China. Chinese Geographical Science 2015, 25, (4), 511-522.
23. Yu, X. J.; Ng, C. N., Spatial and temporal dynamics of urban sprawl along two urban–rural transects: A case study of Guangzhou, China. Landscape and Urban Planning 2007, 79, (1), 96-109.
24. Weng, Y.-C., Spatiotemporal changes of landscape pattern in response to urbanization. Landscape and Urban Planning 2007, 81, (4), 341-353.
25. Dietzel, C.; Herold, M.; Hemphill, J. J.; Clarke, K. C., Spatio-temporal dynamics in California's Central Valley: Empirical links to urban theory. International Journal of Geographical Information Science 2005, 19, (2), 175-195. 26. Yue, W.; Fan, P.; Wei, Y. D.; Qi, J., Economic development, urban expansion, and sustainable development
in Shanghai. Stochastic Environmental Research and Risk Assessment 2012, 28, (4), 783-799. 27. ESRI, ArcInfo desktop GIS. California, 2010.
28. Li, J.; Li, C.; Zhu, F.; Song, C.; Wu, J., Spatiotemporal pattern of urbanization in Shanghai, China between 1989 and 2005. Landscape Ecology 2013, 28, (8), 1545-1565.
29. O'neill, R. V.; Riitters, K. H.; Wickham, J.; Jones, K. B., Landscape pattern metrics and regional assessment.
Ecosystem health 1999, 5, (4), 225-233.
30. Zhang, Z.; Su, S.; Xiao, R.; Jiang, D.; Wu, J., Identifying determinants of urban growth from a multi-scale perspective: A case study of the urban agglomeration around Hangzhou Bay, China. Applied Geography 2013, 45, 193-202.
31. McGarigal, K.; Marks, B. J., Spatial pattern analysis program for quantifying landscape structure. Gen. Tech. Rep. PNW-GTR-351. US Department of Agriculture, Forest Service, Pacific Northwest Research Station 1995. 32. Cheng, L.; Xia, N.; Jiang, P.; Zhong, L.; Pian, Y.; Duan, Y.; Huang, Q.; Li, M., Analysis of farmland
fragmentation in China Modernization Demonstration Zone since “Reform and Openness”: a case study of South Jiangsu Province. Scientific reports 2015, 5.
33. Vizzari, M.; Sigura, M., Landscape sequences along the urban–rural–natural gradient: A novel geospatial approach for identification and analysis. Landscape and Urban Planning 2015, 140, 42-55.
34. McKinney, M. L., Urbanization as a major cause of biotic homogenization. Biological conservation 2006, 127, (3), 247-260.
35. Gong, J.; Liu, Y.; Xia, B., Spatial heterogeneity of urban land-cover landscape in Guangzhou from 1990 to 2005. Journal of Geographical Sciences 2009, 19, (2), 213-224.
36. You, H., Quantifying urban fragmentation under economic transition in shanghai city, China. Sustainability
2015, 8, (1), 21.
37. Pham, H. M.; Yamaguchi, Y.; Bui, T. Q., A case study on the relation between city planning and urban growth using remote sensing and spatial metrics. Landscape and Urban Planning 2011, 100, (3), 223-230.
38. Forman, R. T.; Godron, M., Landscape ecology. 619 pp. Jhon Wiley & Sons, New York 1986.
39. Yang, S.; Wang, M. Y.; Wang, C., Socio-spatial restructuring in Shanghai: Sorting out where you live by affordability and social status. Cities 2015.
40. Henle, K.; Alard, D.; Clitherow, J.; Cobb, P.; Firbank, L.; Kull, T.; McCracken, D.; Moritz, R. F.; Niemelä, J.; Rebane, M., Identifying and managing the conflicts between agriculture and biodiversity conservation in Europe–A review. Agriculture, Ecosystems & Environment 2008, 124, (1), 60-71.
41. Wu, J., Landscape of culture and culture of landscape: does landscape ecology need culture? Landscape ecology 2010, 25, (8), 1147-1150.
42. Verburg, P. H.; van Eck, J. R. R.; de Nijs, T. C.; Dijst, M. J.; Schot, P., Determinants of land-use change patterns in the Netherlands. Environment and Planning B: Planning and Design 2004, 31, (1), 125-150.
43. Reimets, R.; Uuemaa, E.; Oja, T.; Sisas, E.; Mander, Ü., Urbanisation-related Landscape Change in Space and Time along Spatial Gradients near Roads: A Case Study from Estonia. Landscape Research 2015, 40, (2), 192-207.
44. Solon, J., Spatial context of urbanization: Landscape pattern and changes between 1950 and 1990 in the Warsaw metropolitan area, Poland. Landscape and Urban Planning 2009, 93, (3-4), 250-261.
45. Reimets, R.; Uuemaa, E.; Oja, T.; Sisas, E.; Mander, Ü., Urbanisation-related Landscape Change in Space and Time along Spatial Gradients near Roads: A Case Study from Estonia. Landscape Research 2013, 40, (2), 192-207.
47. Di Giulio, M.; Holderegger, R.; Tobias, S., Effects of habitat and landscape fragmentation on humans and biodiversity in densely populated landscapes. Journal of environmental management 2009, 90, (10), 2959-2968. 48. Deng, J. S.; Wang, K.; Hong, Y.; Qi, J. G., Spatio-temporal dynamics and evolution of land use change and landscape pattern in response to rapid urbanization. Landscape and Urban Planning 2009, 92, (3-4), 187-198. 49. Pătru-Stupariu, I.; Stupariu, M.-S.; Tudor, C. A.; Grădinaru, S. R.; Gavrilidis, A.; Kienast, F.; Hersperger, A.
M., Landscape fragmentation in Romania's Southern Carpathians: Testing a European assessment with local data. Landscape and Urban Planning 2015, 143, 1-8.
50. Larondelle, N.; Haase, D., Urban ecosystem services assessment along a rural–urban gradient: A cross-analysis of European cities. Ecological Indicators 2013, 29, 179-190.
51. Huang, Q.; He, C.; Gao, B.; Yang, Y.; Liu, Z.; Zhao, Y.; Dou, Y., Detecting the 20 year city-size dynamics in China with a rank clock approach and DMSP/OLS nighttime data. Landscape and Urban Planning 2015, 137, 138-148.
52. Zhang, H.; Wang, X.; Ho, H. H.; Yong, Y., Eco-health evaluation for the Shanghai metropolitan area during the recent industrial transformation (1990-2003). Journal of environmental management 2008, 88, (4), 1047-55. 53. Chen, D.; Wang, Y.; Ren, F.; Du, Q., Spatio-Temporal Differentiation of Urban-Rural Equalized Development
at the County Level in Chengdu. Sustainability 2016, 8, (5), 422.
54. You, H., Quantifying the coordinated degree of urbanization in Shanghai, China. Quality & Quantity 2016. 50, 1273.