Western University Western University
Scholarship@Western
Scholarship@Western
Electronic Thesis and Dissertation Repository
11-12-2012 12:00 AM
The Regulation of Prokaryotic Transposable Elements by the RNA
The Regulation of Prokaryotic Transposable Elements by the RNA
Binding Protein Hfq
Binding Protein Hfq
Brian J. Munshaw
The University of Western Ontario Supervisor
Dr. David Haniford
The University of Western Ontario Graduate Program in Biochemistry
A thesis submitted in partial fulfillment of the requirements for the degree in Master of Science © Brian J. Munshaw 2012
Follow this and additional works at: https://ir.lib.uwo.ca/etd Part of the Biochemistry Commons
Recommended Citation Recommended Citation
Munshaw, Brian J., "The Regulation of Prokaryotic Transposable Elements by the RNA Binding Protein Hfq" (2012). Electronic Thesis and Dissertation Repository. 935.
https://ir.lib.uwo.ca/etd/935
The Regulation of Prokaryotic Transposable Elements by the RNA Binding Protein Hfq
(Spine title: Hfq and Transposable Elements)
(Thesis format: Monograph)
by
Brian Munshaw
Graduate Program in Biochemistry
A thesis submitted in partial fulfillment of the requirements for the degree of
Master of Science
The School of Graduate and Postdoctoral Studies The University of Western Ontario
London, Ontario, Canada
THE UNIVERSITY OF WESTERN ONTARIO
SCHOOL OF GRADUATE AND POSTDOCTORAL STUDIES
CERTIFICATE OF EXAMINATION
Supervisor
______________________________ Dr. David Haniford
Supervisory Committee
______________________________ Dr. Christopher Brandl
______________________________ Dr. David Edgel
Examiners
______________________________ Dr. Christopher Brandl
______________________________ Dr. Ze-Chun Yuan
______________________________ Dr. Stan Dunn
The thesis by
Brian James Munshaw
entitled:
THE REGULATION OF PROKARYOTIC TRANSPOSABLE ELEMENTS BY THE RNA BINDING PROTEIN HFQ
is accepted in partial fulfilment of the requirements for the degree of
Master of Science
Date__________________________ _______________________________
Abstract
This thesis investigates the role that the RNA binding protein Hfq has in
regulating the mobility of IS Elements and the expression of their transposase
genes. Hfq is a known regulator of the IS Element IS10 and is a major
component of sRNA pathways in E.coli. In this work, I demonstrate that through
the use of a bioinformatics approach to identify a list of additional IS Elements
from the IS Finder database, one can successfully identify IS Elements
containing Hfq binding sites which may implicate Hfq regulation. One of the
identified elements, IS1413, was characterized by transposition assays and
transposase expression assays. These experiments demonstrated that the
activity level of IS1413 decreases in the presence of Hfq. Another identified IS
Element, IS10, had its 3’ end of its transposase mRNA transcript probed for the
relevance of a putative Hfq binding site through mutational analysis, and through
identifying that there are no post-transcriptional modifications at the 3’ end of the
transcript. Although Hfq bound IS10 mRNA in vitro, genetic mutations to the
putative Hfq binding site resulted in no difference in transposition activity. A
growth condition was identified that increased IS10 transposition frequencies in
wild type cells, but not in cells containing a rpoS gene disruption. Overall, these
studies have identified another IS Element that changes activity in the presence
of Hfq and have linked slow unaerated growth conditions to an increase in IS10
transposition frequencies in E.coli.
Key words: IS10/Tn10, IS1413, Hfq, Stress Conditions, Transposition, E.coli,
Acknowledgements
I would like to thank my supervisor David Haniford. Thank you for your
guidance, feedback, and great conversations about science (and fishing) at lab
coffee meetings. I would also like to extend my thanks to my colleagues (past
and present) Joe Ross, Crystal McLellan, Ryan Trussler, Shahan Hossain, Mike
Ellis and Morgan Black for the support and great conversations. I like to thank
my graduate committee Dr. Edgell, and Dr. Brandl for their support in terms of
motivation and research considerations. I would also like to thank Barb Green
and her administrative team for their help in answering questions regarding
department policies and procedures. A special thank you goes out to my wife
Brie Munshaw who has supported me throughout this thesis and has offered me
nothing but encouragement and motivation to continue this journey. I would also
like to thank my family and friends for all their love and support.
Thank you to the University of Western Ontario and the Province of
Ontario for providing me with this valuable opportunity as well as funding to
Table of Contents
The Regulation of Prokaryotic Transposable Elements by the RNA Binding Protein Hfq
CERTIFICATE OF EXAMINATION ... i
Abstract ... ii
Acknowledgements ... iii
Table of Contents ... iv
List of Tables ... vi
List of Figures ... vii
Chapter 1 - Introduction ... 1
1.1 Lateral gene transfer in bacterial populations: ... 1
1.2 Transposons: ... 2
1.3 Regulation of mobile elements: ... 5
1.3.1 Regulation of transposase expression: ... 5
1.3.2 Post translational regulation of transposons: ... 6
1.4 Hfq and sRNAs: ... 6
1.5 Regulation of Hfq expression:... 12
1.6 Cellular factors that affect Hfq levels: ... 13
1.7 IS1413: ... 15
1.8 Tn10: ... 15
1.9 Thesis topics addressed: ... 18
Chapter 2 - Materials and Methods ... 20
2.1 Bacterial strains used in this thesis: ... 20
2.2 Plasmids used in this thesis: ... 21
2.3 Mating out assay: ... 27
2.4 Finding putative Hfq binding sites in IS Elements: ... 32
2.5 β-Galactosidase assays:... 32
2.6 Hfq protein purification: ... 34
2.7 In vitro transcription and RNA labeling: ... 34
2.8 Electrophoretic mobility shift assays: ... 35
2.9 RNA-sRNA basepairing predictions: ... 36
2.10 3’ RNA ligase-mediated rapid amplification of cDNA ends (3’ RLM-RACE): ... 37
2.12 Verification of sRNA induction: ... 39
Chapter 3 - Results ... 41
3.1 How common is the Hfq mediated repression of transposase expression in IS Elements? ... 41
3.2 Hfq regulation of IS1413: ... 44
3.3 Alternative pathways of IS10 regulation by Hfq at the 3' end of the mRNA transcript. ... 51
3.4 Does Hfq bind the 3' end of IS10? ... 57
3.5 Does the BM1 mutation affect IS10 transposition frequency? ... 64
3.6 Is the expression of RNA-IN regulated by an sRNA? ... 68
3.7 Does limiting the availability of Hfq proteins in E.coli impact on IS10 transposition frequency? ... 74
Chapter 4 - Discussion ... 84
4.1 Using bioinformatics to identify IS Elements that are under Hfq regulation. ... 84
4.2 Hfq and IS1413 transposition: ... 86
4.3 Hfq regulation of IS10 ... 90
4.4 RNA-IN has an Hfq binding site in the 3’ end and it may be relevant under certain physiological conditions. ... 92
4.5 Is IS10 transposition regulated by an sRNA ... 93
4.6 Does modulation of Hfq levels have an impact on IS10 transposition? ... 95
Appendix 1- Obtaining a compiled list of IS Elements from the IS Finder database. ... 99
List of Tables
Table
TABLE 2.1 BACTERIAL STRAINS USED IN THIS THESIS………..
Pg #
21 TABLE 2.2 PLASMIDS USED IN THIS THESIS………... 25-26 TABLE 2.3 OLIGONUCLEOTIDES USED IN THIS STUDY……….. 29-31 TABLE 3.1 ELEMENTS IN THE IS FINDER DATABASE CONTAINING
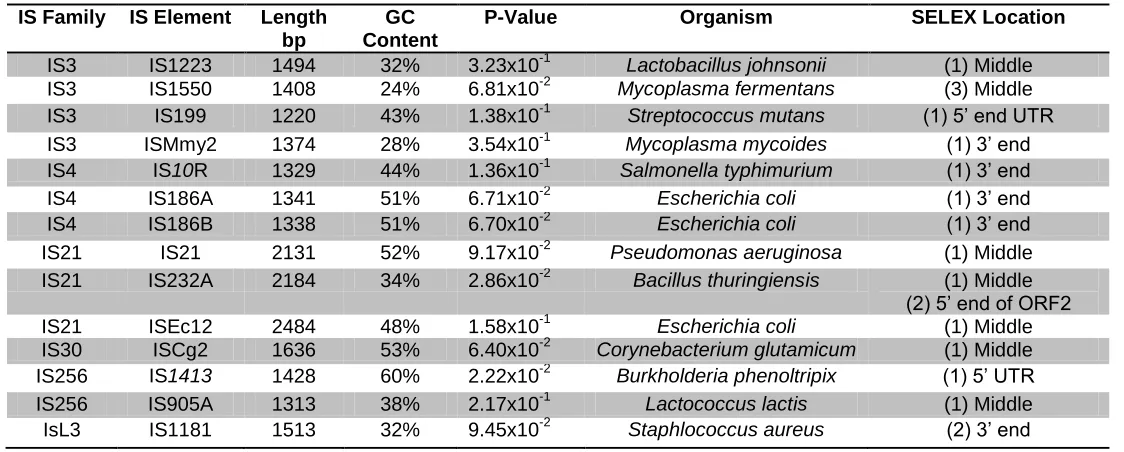
THE PREDICTED HFQ BINDING SEQUENCE AAYAAYAA……… 45
TABLE 3.2 ELEMENTS IN THE IS FINDER DATABASE CONTAINING
THE PREDICTED HFQ BINDING SEQUENCE AYAATAA………... 46
TABLE 3.3 COMPILED SRNAS PREDICTED TO INTERACT WITH IS10
ACCORDING TO INTARNA……… 69
TABLE 3.4 RATIOS OF TRANSPOSITION FREQUENCIES OF
NK5830F’ AND ITS ISOGENIC MUTANTS……….. 79
TABLE 3.5: RATIO OF TRANSPOSITION FREQUENCIES DETERMINED FROM A MATING OUT ASSAY AT ROOM
TEMPERATURE WITH NO AERATION DIVIDED (STARVED) BY THE TRANSPOSITION FREQUENCY DETERMINED AT 37°C WITH
List of Figures
FIGURE Pg #
FIGURE 1.1 MECHANISMS OF LATERAL GENE TRANSFER……… 2 FIGURE 1.2 THE DIFFERENCES BETWEEN INSERTION SEQUENCES,
TRANSPOSONS AND COMPOSITE TRANSPOSONS……… 4
FIGURE 1.3 HFQ MODES OF ACTION………. 9 FIGURE 1.4 FEATURES OF THE INSERTION SEQUENCE 1413……….. 14
FIGURE 1.5 STRUCTURE OF Tn10 AND KEY SEQUENCES OF IS10R 17
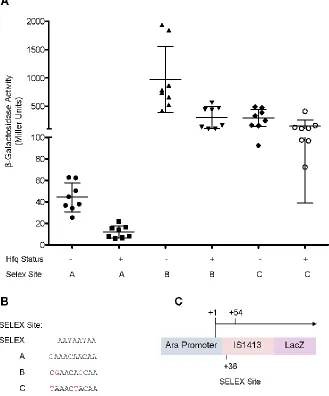
FIGURE 3.1 β-GALACTOSIDASE ACTIVITY FOR IS1413-LACZ
TRANSLATIONAL FUSIONS……… 49
FIGURE 3.2 HFQ REPRESSES IS1413 TRANSPOSITION……….. 52 FIGURE 3.3 THREE PRIME RLM-RACE STUDIES SHOW THAT IS10
TRANSCRIPTS FROM Tn10 HAVE DEFINED STOP POINTS, WITH NO INDICATION OF POLYADENYLATION OR RHO-INDEPENDENT
TERMINATION SEQUENCES……….. 56
FIGURE 3.4 IN-VITRO TRANSCRIPTION SCHEMATIC……… 58 FIGURE 3.5 THE PROPOSED STRUCTURE FOR EACH OF THE
RNA-IN 3’ SPECIES………. 60
FIGURE 3.6 HFQ BINDS THE LAST 107 NUCLEOTIDES OF IS10 AND
MUTATING THE SELEX SITE REDUCES BINDING……… 62
FIGURE 3.7 HFQ BINDS THE LAST 107 NUCLEOTIDES OF IS10 AND BINDING CAN BE COMPETED USING THE PROXIMAL BINDING SRNA
DSRA OR DISTAL BINDING POLYA16………... 63
FIGURE 3.8 THE BM1 MUTATION DOES NOT AFFECT
TRANSPOSITION FREQUENCIES OF A HIGH COPY IS10 ELEMENT AS
MEASURED BY A MATING OUT ASSAY……….. 65
FIGURE 3.9 β-GALACTOSIDASE ACTIVITY FOR IS10-LACZ
TRANSLATIONAL FUSIONS OF VARYING LENGTHS………. 67
FIGURE 3.10 PREDICTED REGIONS OF PAIRING BETWEEN sRNAS
AND RNA-IN ACCORDING TO INTARNA……….. 70
FIGURE 3.11 PAIRING OF sRNAS TO IS10 (BP1-160) ONLY OCCURS
WHEN IS10 IS IN EXCESS………... 73
FIGURE 3.12 HFQ BINDS GLMZ TO FORM 3 COMPLEXES……… 74 FIGURE 3.13 IPTG INDUCED MICC and GLMZ EXPRESSION……… 76 FIGURE 3.14 sRNA OVEREXPRESSION MATING OUT ASSAY…………. 77 FIGURE 3.15 GROWTH CURVES OF NK5830 F’ AND ITS ISOGENIC
MUTANTS………. 82
FIGURE 3.16 WESTERN BLOTS OF NK5830F’ AND RPOS-
CELL LYSATES………... 83
FIGURE 4.1 MODEL FOR POTENTIAL CONDITIONS THAT MAY
Abbreviation Meaning
CRISPR Clustered Regularly Interspaced Short Palindromic Repeats
DAM DNA Adenine Methyl Transferase
DksA- NK5830F' (dska::tet)
HBS Hfq binding site
Hfq- NK5830F' (hfq-1::cat)
I.E Inside End
IHF Integrative Host Factor
IR inverted repeat
IS Insertion Sequences
IS10L Left end of the IS10 sequence (codes a non-functional transposase)
IS10R Right end of the IS10 sequence
Mci multi-copy inhibition
miRNAs micro RNA
M-MuLV-RT Moloney Murine Leukemia Virus Reverse Transcriptase Normal Mating out conditions grown at 37°C with aeration
O.E Outside End
PAP Polyadenylate Polymerase I
PNP Polynucleotide Phosphorylase
PolyA Polyadenylation
R Purine
R Gene resistance gene
RBS ribosome binding site
RNA-IN IS10 Transposase mRNA
RNA-OUT IS10 antisense-RNA
RpoS- NK5830F' nlpD-rpoS::CmR
siRNAs small interfering RNA
sRNA small RNA
Starved Mating out conditions grown at room temperature without aeration
Chapter 1 - Introduction
1.1 Lateral gene transfer in bacterial populations:
One of the driving forces of bacterial evolution is thought to be the ability to
exchange DNA between populations via lateral gene transfer (reviewed in 1).
Promiscuous DNA transfer can result in foreign genes being transferred from
species to species, potentially conferring new survival traits in the recipient
(including pathogenicity or antibiotic resistance) 1. By analyzing the genome of
E.coli MG1655 for DNA with different base compositions and different codon
bias, Lawrence et al. inferred that 17.6% of open reading frames of the genome
were acquired from at least 234 lateral gene transfer events 2. Mechanisms of
lateral gene transfer include transduction, conjugation and transformation (See
Figure 1.1). Transduction involves a bacteriophage incorporating some host
DNA into its capsid and upon infection, incorporating it into the recipient’s
genome. Transformation entails the uptake of DNA from the environment.
Conjugation refers to bacteria transferring self-mobilizing plasmids through sex
pili from one cell to another. Conjugation can occur between bacteria, bacteria
and plants 3, or bacteria and yeast 4, increasing the diversity of transmissible
genes. Transposons are often carriers of antibiotic resistance genes; their ability
to transpose onto phage or self-transmissible plasmids make them a major
1.2 Transposons:
Many bacteria carry DNA transposons which are mobile genetic elements
that can move to various loci throughout the genome. Transposition events can
have consequences on the host such as gene deletions, inversions 6 and gene
activation 7.
Figure 1.1 Mechanisms of lateral gene transfer. Transduction involves a bacteriophage injecting its genetic material into a recipient bacterial cell.
Transformation involves the cellular uptake of DNA from the environment. Conjugation involves the active transfer of DNA from one cell to another through a sex pilus.
There are three major classes of mobile genetic elements found in
bacteria: Insertion sequences (IS Elements), composite transposons, and
conjugative transposons (see Figure 1.2). IS Elements (top of Figure 1.2) are
comprised of genes necessary to facilitate their own mobility, such as a
transposase. Many IS Elements are flanked by inverted repeats which often act
as the boundaries of the IS Element and the transposase binding region. When
two IS Elements flank a common genomic region they can form a composite
transposon (bottom of Figure 1.2). The two IS Elements of the composite
transposon may or may not be completely identical; however, as long as one of
the IS Elements encodes a functional transposase, the entire composite
transposon can move as a single unit. Conjugative transposons are larger
mobile elements than IS Elements and composite transposons (middle of Figure
1.2). Conjugative transposons, such as Tn914, encode genes required for
cell-to-cell transfer, an integrase for integration into the chromosome, an excisionase
which excises the element from the host’s chromosome and often antibiotic
resistance genes such as tetracycline (reviewed in 8). The abundance of IS
Elements in a genome is exemplified with the 37 IS Elements present in E.coli
MG1655 2. Mobile genetic elements are also very prevalent in Burkholderia
cephacia, where the study of catabolite gene activation by IS Elements has been
extensively studied 9. Overall, the abundance of mobile genetic elements in
bacterial genomes may play a role in changing the overall architecture of the host
over time and may confer survival advantage to the host in times of
adaptation. Upon exposure to tetracycline, the rates of CTnDOT excision from
the host chromosome increases 10.
Figure 1.2 The differences between insertion sequences, transposons and composite transposons. Top: Insertion Sequences (IS Elements) are DNA sequences that only encode genes involved in their mobilization (such as a transposase). Many (but not all) IS Elements are flanked by inverted repeats which act as the IS Elements’ boundary and often serve as the binding regions for the transposase. Middle: Conjugative transposons are much larger than IS Elements and contain gene clusters of similar function. Conjugation genes (light blue) are involved in the transfer of the excised circular form of the transposon to a recipient cell. Antibiotic resistance genes (R Gene) can also be carried within the transposon (orange). Regulatory genes (brown) are often general
1.3 Regulation of mobile elements:
Mobile genetic elements depend on the survival of the host to maintain
their existence. With host gene rearrangements and deletions being possible
consequences of transposition, mobile genetic elements are under tight
regulation by both the host and the mobile genetic elements themselves to
maintain the viability of both. Ultimately, the frequencies of transposition are
dependent on the amount of transposase (the enzyme responsible for element
mobilization) present in the cell 11. Down regulation of the transposase at the
expression level and transposon-binding level makes transposition events a rare
occurrence. For example, IS10 transposes at a rate of 10-4 events per cell
generation 12, and Tn10 has an even lower transposition rate of 10-7 events per
cell generation 13.
1.3.1 Regulation of transposase expression:
Transposons and IS Elements are often poorly expressed from moderate
endogenous promoters coupled with suboptimal ribosome binding sites 14,
resulting in small amounts of transposase available in the cell to perform the
transposition reaction. Transcription levels of transposases can also be affected
by host factors. For example, DNA Adenine Methyltransferase (DAM) in E.coli
down regulates IS10 transposase expression at the transcriptional level through
the methylation of an adenine within the -10 region of the promoter, resulting in
expression, such as in IS10/Tn10, where an anti-sense RNA (RNA-OUT) base
pairs with the transposase mRNA (RNA-IN) resulting in the occlusion of the RBS.
1.3.2 Post translational regulation of transposons:
Host factors can also play a role on mobilization of transposons at a post
translational level. Host factors play an important role in the regulation of
transposition (reviewed in 16). Tn10 is both positively and negatively regulated by
host factors. DAM, in addition to regulating IS10 transcription, also methylates an
adenine found within the inside end of IS10 which reduces transposase binding
15
. Another host factor, Integration Host Factor, positively regulates Tn10
transposition through binding the transposon ends promoting the formation of the
paired ends complex (a step in IS10/Tn10 transposition) 17. The host factor Hfq
has also been implicated in IS10 regulation; E. coli strains with a hfq gene
disruptions (Hfq-) show a 50-86 fold increase in IS10 transposition when IS10 is
on a multi-copy plasmid, compared to cells with functional Hfq 18.
1.4 Hfq and sRNAs:
Hfq is an RNA binding protein that forms a homo-hexameric ring from 11.2
kDa monomers 19. It is a member of the SM/LSM family of proteins, containing
the SM1 motif found in Eukaryotic SM and LSM proteins 20 . In Eukaryotes, SM
and LSM proteins are involved in DNA and RNA processing events such as
pre-mRNA splicing and telomere synthesis 21. In bacteria, Hfq is a key component in
small RNA (sRNA) regulation in bacteria. One of the more defined roles of Hfq is
has been shown to be involved in accelerating the rate of pairing a cis-encoded
sRNA (IS10’s RNA-OUT) to RNA-IN in vitro18
. Both trans-encoded and
cis-encoded sRNAs are analogous to Eukaryotic micro RNAs (miRNAs) and small
interfering RNAs (siRNAs) in that they can alter the expression of their mRNA
targets through RNA destabilization or translation inhibition 22.
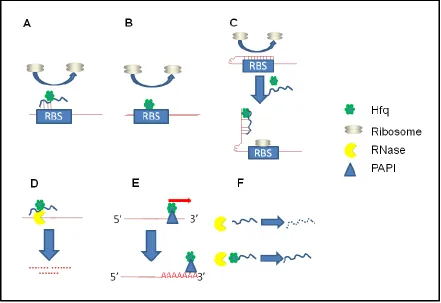
Hfq can affect RNA molecules in at least 6 different ways (see Figure 1.3).
Firstly, Hfq can act in conjunction with an sRNA to block the ribosome binding
site (RBS) on its target mRNA which results in translation inhibition. In this case,
it is thought that Hfq acts to either promote pairing of the two RNA species
through binding and secondary structure alteration, or by physically increasing
the local concentrations of the two RNA species 23 (Figure 1.3A). RBS blocking
by an sRNA and Hfq is found in the regulation of fhl translation (an mRNA coding
for a transcriptional activator involved in the formate pathway in Enterobacteria)
by the sRNA OxyS; in this system, the OxyS binding site overlaps the RBS.
Upon binding to the fhl mRNA, OxyS directly competes with the 30S ribosomal
subunit for binding in an Hfq dependent manner 24. Secondly, Hfq and sRNAs
can actually increase translation initiation as well. An example of this is found in
the study of the DsrA:RpoS interaction. RpoS mRNA contains a secondary
structure in its 5’ UTR that results in the occlusion of the RBS. DsrA relieves this
secondary structure by pairing RpoS mRNA in an Hfq dependent manner making
the ribosome binding site accessible and allowing for ribosome binding 25(Figure
sRNA, which in turn has a destabilizing effect on the half-life of the mRNA and
reduced translation (Figure 1.3B).
RNA stability which is affected by the frequency of translation initiation on
an mRNA by the 16S ribosomal subunit, and the initiator tRNA 26. A reduced
frequency of translation initiation results in reduced mRNA levels in the cell 26.
This is exemplified in the mRNA ompA, a message for an outer membrane
protein, where Vytvytska et al show Hfq can bind to ompA mRNA, preventing the
initiator complex from forming and ultimately making the mRNA vulnerable to
RNase E mediated degradation 27. Hfq is not just a promoter of RNA
degradation; in a fourth mechanism Hfq can also protect sRNAs from RNases by
blocking cleavage sites (Figure 1.3 F). For example, the sRNAs DsrA and RhyB
are protected from RNase E cleavage when Hfq binds and protects the RNase E
cleavage site on the sRNAs 28. In the fifth mechanism of how Hfq can affect
RNA, Hfq facilitated pairings of sRNAs can result in the degradation of both the
sRNA and target mRNA (Figure 1.3D). A study by Massé et al demonstrates
that in the Hfq facilitated binding of the sRNA RhyB to the mRNA sodB, both RNA
species are degraded in an RNase E dependent manner 29. A sixth proposed
mechanism of Hfq is its involvement in the polyadenylation of mRNA transcripts
(Figure 1.3E). In a study by Mohanty et al, total cellular RNA from log phase E.
coli was analyzed for polyAdenylated (polyA) tail length; Hfq disruptions resulted
in a decrease in polyA tail length of greater than 20 nucleotides 30. A
consequence of polyadenylation of mRNA in E.coli is the decrease of mRNA
Figure 1.3 Hfq modes of action. A) Hfq and an sRNA can bind the ribosome binding site (RBS) of a target mRNA and inhibit translation. B) Hfq can directly bind the ribosome binding site of an mRNA preventing the 30S ribosomal subunit from binding. C) Hfq and an sRNA can positively regulate translation by altering the secondary structure of an mRNA that is self-occluding the RBS. D) RNase E can associate with Hfq’s C-terminus and degrade mRNA that the Hfq:sRNA binary complex is base paired with. E) Hfq can recruit poly(A) polymerase to the 3’ end of an mRNA, resulting in polyadenylation and subsequent destabilization of the transcript. F) Hfq can directly bind sRNAs and protect them from
degradation
The impact of Hfq and sRNAs on gene regulation in bacteria is becoming
apparent. To date, there are numerous classes of regulatory RNAs, including:
cis-encoded RNAs encoded on the opposite stand of the mRNA, trans-encoded
sRNAs which are often found in intergenic regions of the genome , and Clustered
Regularly Interspaced Short Palindromic Repeats (CRISPR) RNAs (reviewed in
22
). These 3 subclasses of small RNAs are transcribed from different parts of a
are encoded from the opposite DNA strand that codes for the mRNA, so they
have perfect complementarity to a region of their target mRNA (reviewed in 32).
Trans-encoded sRNAs are often encoded in intergenic regions of the genome
and can have multiple targets with limited complementarity; many trans-encoded
sRNAs are dependent on Hfq to effectively basepair with their target mRNA
(reviewed in 22). CRISPR RNAs are found clustered in 1 or 2 loci of a bacterial
genome and are thought to protect the cell from phage infection; research into
the mechanism of action these CRISPR RNAs is still in preliminary stages
(reviewed in 33).
The first cis-encoded sRNA reported to regulate a transposon was the
RNA-OUT transcript of Tn10 34. RNA-OUT is an anti-sense RNA that base pairs
with RNA-IN (the transposase mRNA) ultimately resulting in the occlusion of the
ribosome binding site and start codon, leading to reduced transposase
expression 34. Hfq may be involved in pairing of IS10’s RNA-IN and RNA-OUT 18
by increasing the half-life of RNA-OUT, by altering the secondary structure of the
two RNA species making pairing more favourable or by increasing the local
concentrations of the two RNA species making binding more probable. Other
examples of cis-encoded RNA control have since been identified and
characterized. An interesting study that found a connection between cis and
trans-encoded sRNAs was on the luxS mRNA and its interaction with the sRNA
MicA. MicA interacts with OmpA as a trans-sRNA; MicA is also a cis-encoded
sRNA that, upon pairing with its target mRNA luxS, results in a processed
targets than their perfectly complementary partner mRNA and thus could be
regulating a multitude of mRNAs by acting as a trans-sRNA as well. Generally,
Hfq is not thought to be required for cis-encoded RNAs to pair with their target
mRNA. However, Hfq’s role in sRNA stability suggests that Hfq may be required
for these sRNAs to have sufficient stabilities in vivo to act on their targets.
Trans-encoded sRNAs in E.coli are encoded from regions distant from their
numerous targets. Trans-encoded sRNAs are frequently expressed in response
to stress stimuli to the cell which can include oxidative stress (which induces the
sRNA OxyS) 36 or low temperature growth (which induces the sRNA MicC) 37.
Trans-encoded sRNAs often require the RNA binding protein Hfq to promote
pairing to their mRNA targets 38. A well characterized sRNA:mRNA pairing
reaction is between the sRNA GlmZ and the glmS mRNA (which encodes an
enzyme involved in glucosamine-6-phosphate synthesis) 39. Without the
activating sRNA glmZ, the 5’ untranslated region of the glmS RNA forms a hairpin
occluding the ribosome binding site; Hfq binds to both GlmZ and glmS RNA
species. GlmZ binds to glmS mRNA upstream of the Shine-Dalgarno in an Hfq
dependent manner, resulting in an secondary structure change of the mRNA and
an available ribosome binding site 39. Overall, sRNAs allow the cell to quickly
respond to cellular stresses through a network of sRNAs without the need to
invest energy in regulatory proteins. Given that there is still a 7-fold increase in
transposition in the absence of Hfq and the anti-sense RNA-OUT, there may be
yet another undiscovered RNA-Hfq interaction involved in down regulating IS10
The Hfq hexamer has two distinct RNA binding surfaces, known as the
proximal and distal faces (reviewed in 40). The two different faces of the Hfq
hexamer are thought to bind different RNA sequences with the proximal face
binding polyA/U sequences and the distal face binding sequences rich in the
sequence ARNx (where R is a purine and N represents any nucleotide)41. Hfq is
also able to bind DNA in a sequence independent manner 42. Physiological
concentrations of Hfq favour hexameric and multimeric forms of Hfq; the
hexameric form is the active RNA and DNA binding form of the protein43. A study
utilizing Genomic systematic evolution of ligands by exponential
enrichment (SELEX) identified additional sequences that Hfq bound with high
affinity: AAYAAYAA and AYAAUAA 44.
1.5 Regulation of Hfq expression:
Transcription of hfq is driven from 3 promoters (two σ70
-dependentand
one σ 35
-dependent) from the hfq operon 45. Hfq self-regulates the amount of hfq
transcripts in the cell though the binding and destabilization of its mRNA in
exponentially growing cells 46. Hfq also self regulates its own translation by
binding to its own mRNA 47. Regardless of such regulation, Hfq remains
abundant in the exponentially growing cell with estimates ranging from 2500
molecules of monomer per cell 48 to 55,000 molecules of monomer per cell 49.
Deletions and disruptions of hfq result in shorter half-lives of small RNAs (sRNA)
28
, pleiotropic responses to cellular stress 50, and increased transposition of
Tn10/IS10. Tn5 transposition frequencies also increase in cells lacking functional
1.6 Cellular factors that affect Hfq levels:
Recent studies by Hussein et al. and Moon et al. have shown that
overexpression of sRNAs can result in a titration effect on cellular Hfq
concentration. Most cellular Hfq is already bound to nucleic acids with 80-90% of
cellular Hfq associated with ribosomes and 10-20% being found in the nucleoid
52
. Further depleting the pool of free cellular Hfq may result in the expression of
genes that are normally repressed by Hfq thus allowing the cell to mount a quick
response to cellular stress 53,54. DksA is a transcription factor that responds to
amino acid starvation conditions in conjunction with ppGpp, which modulates
RNA polymerase activity; dksA deletion strains in E.coli and Shigella flexneri
reduce Hfq protein levels by 50% 54,55. Another cellular stress that results in
reduced Hfq levels, is the transition between exponential phase to stationary
1.7 IS1413:
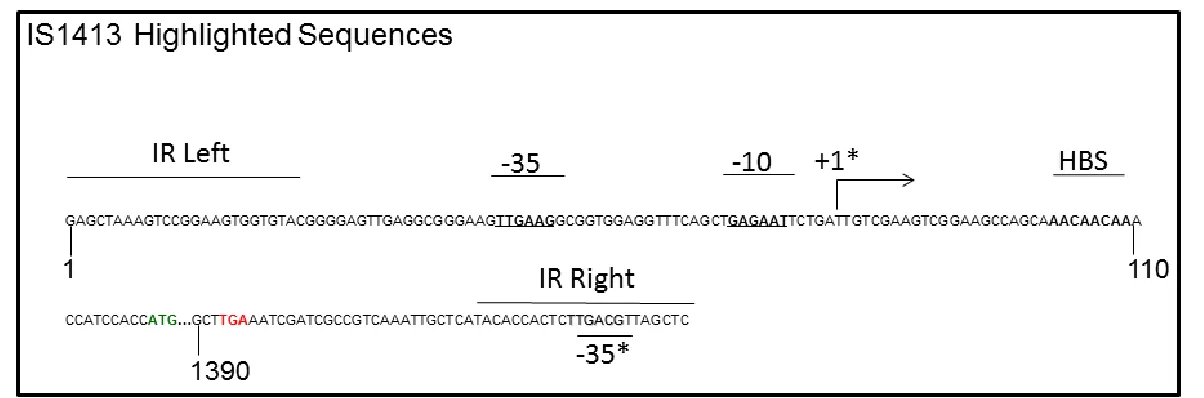
IS1413 is an IS Element (Figure 1.) originally identified in Burkholderia
cephacia AC1100 (now known as Burkholderia phenoliruptrix) which was found
to occasionally create a promoter fusion with a promoterless streptomycin gene
56
. The promoter fusion occurs by the -35 sequence found in the right IR
sequence (Figure 1., shadowed text) inserting in front of a gene with a sequence
resembling the -10 region of a promoter. There are 10 to 12 copies of IS1413 in
the genome 56 and very little is known about the mechanism of transposition or its
regulation. IS1413 was discovered by its 83% similarity to IS1490 (the IS
element thought to be responsible for Burkholderia phenoltripix’s ability to break
down DDT) 56. IS1413 contains a perfect match for a potential Hfq binding site
(HBS) within its 5’ untranslated region (UTR) (Figure 1.). This Hfq binding site
may be indicative of a regulatory mechanism of IS1413 that involves Hfq.
1.8 Tn10:
Tn10 is a well-studied transposon that confers tetracycline resistance to its
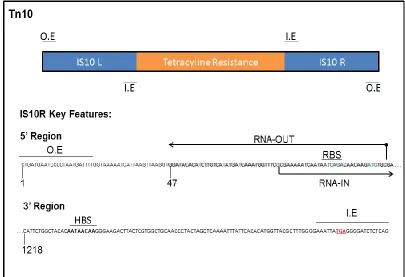
host. Tn10 is a composite transposon comprised of two IS10 copies (IS10L and
IS10R) flanking tetracycline resistance genes (Figure 1.). IS10R is a functional
IS element that can mobilize either as an IS element when the transposase acts
at its inside and outside ends (Figure 1.), or mobilize the entire Tn10 element
when the transposase acts at the two outside ends. IS10L is a degenerate copy
of IS10 and does not encode a functional transposase 57. The expression of
IS10’s transposase is under tight regulation from host factors and an antisense
transposase gene which encodes two RNA species (Figure 1.); RNA-IN (the
mRNA of the IS10 transposase) and RNA-OUT (an anti-sense RNA that contains
35 bases that are complementary to the 5’ region of RNA-IN)34
. Pairing of
RNA-IN and RNA-OUT results in the occlusion of the ribosome binding site of RNA-RNA-IN
58
and an RNase II dependent decrease in the half-life of RNA-IN 59. The
anti-sense control is of particular importance when multiple copies of IS10 are
expressed. When expressing IS10 on a multi-copy plasmid, the transposition
frequency of a single chromosomal copy of Tn10 decreases by about 20 fold 34.
This effect is known as multi-copy inhibition (mci). The mci effect can be
explained by the transposase encoded by RNA-IN being most effective when
acting on sequences close to where it was synthesized 13, in contrast to
RNA-OUT which can freely distribute through the cell. Furthermore, RNA-IN levels are
less than 1% that of RNA-OUT 11. The differences in RNA-IN and RNA-OUT
levels are due to OUT having a stronger promoter than IN and
RNA-OUT having a longer half-life than RNA-IN (70 minutes versus 40 seconds,
Figure 1.5 Structure of Tn10 and key sequences of IS10R. O.E and I.E are the outside ends and inside ends respectively. The IS10R encoded transposase binds to the I.E and O.E. RNA-IN (the transposase mRNA) starts at the G
1.9 Thesis topics addressed:
Transposons are heavily regulated by host factors. Hfq is a host factor
that negatively regulates IS10/Tn10 and IS50/Tn5. Hfq may be a global regulator
of many IS Elements. An RNA interference mechanism has already been
characterized in Eukaryotes that repress mobile genetic elements such as
viruses and transposable elements. Small interfering RNAs (siRNAs) and
microRNAs (miRNAs) are two defense mechanisms eukaryotes use to silence
genes (including transposons and viral genes); siRNAs result in the cleavage of a
target mRNA and miRNAs result in repressed translation or sometimes cleavage
of the target mRNA (reviewed in 60,61). Perhaps sRNAs could be functioning as a
Prokaryotic method of silencing transposable elements. Tn10/IS10 and Tn5/IS50
have already been shown to be repressed by Hfq which is closely connected to
the sRNA regulation in Bacteria. In this thesis I follow up on three main
questions:
1) Can transposons that are subject to Hfq dependent regulation be identified
by searching for putative Hfq binding sites in the transposase transcript?
2) Is an endogenous E.coli sRNA involved in Hfq-mediated regulation of
Tn10/IS10 transposition?
3) Does limiting the amount of synthesis or availability of Hfq influence
Tn10/IS10 transposition?
In this work I explored the effects Hfq has on the regulation of the two IS
binding sites in the IS Finder database. IS10 contains an Hfq binding site in its 3’
region, however disrupting this Hfq binding site through mutation does not result
in a de-repression of Hfq in a transposition assay. IS1413 has an Hfq binding
site found within its 5’ untranslated region and for the first time I show it can
undergo transposition in E.coli at an average frequency of 3.7 x 10⁻⁵ ± 7.8 x 10⁻⁵
in the presence of Hfq and increases its average transposition frequency to 5.0 x
10-4 ± 3.8 x 10⁻⁴ in the absence of Hfq. I also identified that IS10 transposition
increases in wildtype cells by 9.81 ±1.64 fold when cells are starved and put
under non-aerating conditions. Finally I analyzed the 3’ region of IS10 to
determine where the transcript terminates and looked for a potential mechanism
in which Hfq could be acting on the RNA (such as facilitating polyadenylation). A
defined stop point which appears to either be due to a processing event or run off
Chapter 2 - Materials and Methods
2.1 Bacterial strains used in this thesis:
All bacterial strains (E.coli and Burkholderia) used in this thesis are
compiled in Table 2.1. All plasmids used in this study are compiled in Table 2.2.
Bacterial strains with gene disruptions were made via generalized transduction.
Phage P1 was used for generalized transduction 62. P1 Phage was used to infect
E. coli cells containing a “marked” gene of interest (containing an antibiotic
resistance gene). A culture of E.coli containing the “marked” gene was grown
overnight in LB broth with selection and subcultured in the absence of antibiotic
but supplemented with 25 mM MgCl2, 5 mM CaCl2, and 0.2% glucose to grow to
early log phase. Forty μL of P1 phage were added to the subculture of cells, and
further incubated for 3 hours at 37°C with aeration. Fifty μL of chloroform was
added to the infected cells, vortexed, and centrifuged at 6000 rcm for 5 minutes.
The supernatant was removed and stored at 4°C. Phage lysate was titred to a
multiplicity of infection of 1-5 plaque forming units/cell. NK5830 F’ cells
transformed with a temperature sensitive plasmid encoding recA (pET001) were
grown in LB broth overnight at 30°C with aeration. Cells were subcultured (1:20)
in LB broth containing 25 mM MgCl2, 5 mM CaCl2, and 0.2% glucose at 30°C with
aeration and grown to exponential phase. Cells and phage lysate were mixed at
a 1:1 ratio (100 μL of exponentially growing cells (undiluted, diluted by a factor of
10, or diluted by a factor of 100) and 100 μL of phage lysate) and incubated at
30°C for 60 minutes. Two-hundred microlitres of 1 M sodium citrate (pH 5.5) was
incubated at 37°C with aeration for 60 minutes, spun down at 6000 rcm for 5
minutes and resuspended in 0.85% NaCl in H2O. Cells were plated on LB agar
containing 20 μg/mL of chloramphenicol and incubated at 37°C. Individual cells
picked from overnight plates and were serially passaged on LB agar containing
either 20 μg/mL of chloramphenicol as well as LB agar plates containing 100
μg/mL of ampicillin (to ensure the recA plasmid was lost) until colonies were
cured of the recA containing plasmid pET001.
Table 2.1 Bacterial strains used in this thesis
Strain Description Source/
Reference NK5830 F' recA56 su° lacproXII1, Arg-, Ara-, NalR,
RifR/F’ laciq L8 pro
63
DBH16 NK5830F' transduced to hfq-1::Cm 18
DBH48 NK5830F' Transduced to rpoS::cat (phage from NM22542 ΔnlpD-rpoS CmR
)
(Laboratory stock)
DBH144 Burkholderia phenoliruptix AC1100 (Gift from Dr. Zlosnik )
A Gift from Dr. Zlosnik (UBC)
DBH174 NK5830 ΔdksA::Tet (using phage lysate
from MG1655 ΔdksA::Tet from M.Cashel via S Gottesman (CF9239)
This Study
DBH 181 NK5830Δ SroG::IS50-Kan-LacZ Laboratory stock
HB101 F-, leu- ; StrR 64
2.2 Plasmids used in this thesis:
All plasmids used in this thesis are compiled in Table 2.2. Plasmids
pDH694-696 are pACYC184 derivatives; they contain pLlacO1 inducible sRNAs
(DsrA. MicC, and RhyB respectively). These sRNA inducible plasmids were
constructed by PCR amplifying DsrA, MicC or RhyB from a genomic preparation
BM42A for MicC and BM40A and BM39A for RhyB. PCR products were digested
using Nco I and Xmn I and cloned into Nco I/Xmn I digested pACYC184 plasmid.
For DsrA, MicC and DsrA PCR reactions the reaction conditions were as follows:
Genomic DNA preparations of NK5830 were done using the GenElute™
Bacterial Genomic DNA Kit (Sigma) following the manufacterer’s protocol. PCR
reactions were the same for all three pLlacO1 inducible sRNAs. Reactions
consisted of 10 ng of NK5830F’ gDNA,, the sRNA respective forward and reverse
primers [1 μM each], combined with GoTaq Mastermix (Promega) [1x]. PCR
conditions were: 98°C (2 min) for the initial denaturation, followed by 98°C (30s),
65°C (40s), and 72°C (1 min) repeated 30 times. A final extension step was done
at 72°C for 5 min. The resulting amplicon was gel purified using the QIAEX II Gel
Extraction Kit (Qiagen).
The new IS10-Kan construct pDH725 and the BM1 mutant pDH734 were
generated by PCR amplifying IS10 on pDH669 (for WT) or pDH703 (for BM1
Mutant) from bp1 to the end of the stop codon at bp1316 using primers BM27A
and BM26A. Reactions consisted of 10 ng of template (pDH669 or pDH703),
forward and reverse primers [1 μM each], combined with GoTaq Mastermix
(Promega) [1x]. PCR conditions were: 98°C (2 min) for the initial denaturation,
followed by 98°C (30s), 62.2°C (45s), and 72°C (2 min) repeated 35 times. A
final extension step was done at 72°C for 5 min. The resulting amplicon was gel
purified using the QIAEX II Gel Extraction Kit (Qiagen). This IS10 amplicon was
cloned into pGEM-T-Easy (Promega). The kanamycin gene containing IS10’s
inside end was PCR amplified from pDH502 using the primers BM23A and
to the complementary sequence of the kanamycin gene. PCR reactions
consisted of 10 ng of template (pDH502), forward and reverse primers [1 μM
each], combined with GoTaq Mastermix (Promega) [1x]. PCR conditions were:
98°C (2 min) for the initial denaturation, followed by 98°C (30s), 55°C (45s), and
72°C (2 min) repeated 5 times. Another set of PCR parameters of 98°C (30s),
68°C (45s), and 72°C (2 min) was then followed for 30 cycles: A final extension
step was done at 72°C for 5 min. The resulting amplicon was gel purified using
the QIAEX II Gel Extraction Kit (Qiagen).This kanamycin-IS10 I.E amplicon was
digested with Spe I and Xba I and cloned into the IS10-containing pGEM -T-easy
construct digested with Spe I.
The LacZ translational fusion plasmids pDH703 and 704 were made
through site directed mutagenesis of pDH669. For pDH703 primers BM10A and
BM11A were used with pDH669 and Pfu polymerase (Stratagene) according to
manufacturer’s guidelines for site-directed mutagenesis. For pDH704 primers
BM12A and BM13A were used with pDH669 and Pfu polymerase (Stratagene)
according to manufacturer’s guidelines for site-directed mutagenesis
The pDH734 (IS10-Kan BM1 mutation) was constructed by PCR
amplifying the IS10 fragment on pDH703 with primers BM26A and BM18A. PCR
reactions consisted of 10 ng of template (pDH703), forward and reverse primers
[1 μM each], combined with GoTaq Mastermix (Promega) [1x]. PCR conditions
were: 98°C (2 min) for the initial denaturation, followed by 98°C (30s), 62.2°C
(45s), and 72°C (2 min) repeated 25 times. A final extension step was done at
(Promega). The construct was digested with SpeI and the gel purified using the
QIAEX II Gel Extraction Kit (Qiagen).
The IS1413 containing plasmid pDH735 was constructed by PCR
amplifying IS1413 from a genomic DNA preparation from Burkholderia
phenoltripix AC1100 using primers BM1A and BM2A. The Taq polymerase
amplified amplicon was cloned into pGEM T-easy (Promega). The mutated
IS1413 LacZ translational fusion plasmids pDH760 and pDH794 were both made
by amplifying the IS1413 portion of pDH757. The forward primers BM4A and
BM3A contain a Nhe I cut site as well as the IS1413 SELEX mutations C and B
respectively (see Figure 3.1B). The reverse primer used to amplify IS1413 for
LacZ translational fusions was BM5A which contains a Sph I cut site. Amplicons
of IS1413 mutants B and C were digested with Nhe I and Sph I and cloned into a
Nhe I/Sph I digested pBad 24 vector. The kanamycin ‘marked’ IS1413 construct
pDH797, was made by first doing site-directed mutagenesis on IS1413 using
primers BM1A and BM7A with pDH735 as a template to introduce a Xho I cut site
after the stop codon in the IS1413 transposase gene. The resulting amplicon
contained a truncated IS1413 (missing 27 nucleotides), to rectify this, the Xho I
containing amplicon was used as a template for another PCR reaction using
BM1A and BM6A primers. The resulting amplicon was a full length IS1413
sequence containing a Xho I cut site and was cloned into pGEM-T Easy
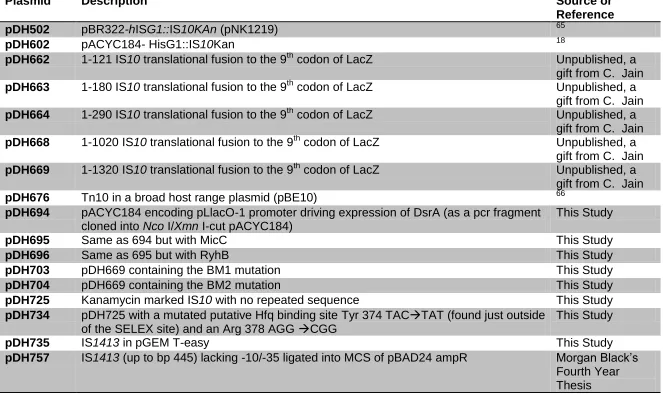
Table 2.2 Plasmids used in this thesis.
Plasmid Description Source or
Reference
pDH502 pBR322-hISG1::IS10KAn (pNK1219) 65
pDH602 pACYC184- HisG1::IS10Kan 18
pDH662 1-121 IS10 translational fusion to the 9th codon of LacZ Unpublished, a gift from C. Jain
pDH663 1-180 IS10 translational fusion to the 9th codon of LacZ Unpublished, a gift from C. Jain
pDH664 1-290 IS10 translational fusion to the 9th codon of LacZ Unpublished, a gift from C. Jain
pDH668 1-1020 IS10 translational fusion to the 9th codon of LacZ Unpublished, a gift from C. Jain
pDH669 1-1320 IS10 translational fusion to the 9th codon of LacZ Unpublished, a gift from C. Jain
pDH676 Tn10 in a broad host range plasmid (pBE10) 66
pDH694 pACYC184 encoding pLlacO-1 promoter driving expression of DsrA (as a pcr fragment cloned into Nco I/Xmn I-cut pACYC184)
This Study
pDH695 Same as 694 but with MicC This Study
pDH696 Same as 695 but with RyhB This Study
pDH703 pDH669 containing the BM1 mutation This Study
pDH704 pDH669 containing the BM2 mutation This Study
pDH725 Kanamycin marked IS10 with no repeated sequence This Study
pDH734 pDH725 with a mutated putative Hfq binding site Tyr 374 TACTAT (found just outside
of the SELEX site) and an Arg 378 AGG CGG This Study
pDH735 IS1413 in pGEM T-easy This Study
pDH760 IS1413-LacZ (from 757) lacking native promoter sequence with a mutated Hfq binding site (GAACACCAA) cloned into MCS (NheI/SphI) of pBAD24
This Study
pDH794 Same as pDH760 only SELEX mutation = TAAACTACAA This Study
pDH796 1413 in pGEM mutations at A1397C,T1402G to make a XhoI cut This Study
pDH797 Sph I-Kan-Sph I PCR product (from 602) cloned into pDH796 Xho I site This Study
pDH763 Empty pLlacO1 vector (pBR322 derivative 67
pDH783 plLac-GlmZ (pBR322 derivative) 67
A kanamycin resistance gene was amplified from pDH502 using primers
BM24A and BM25A. The resulting amplicon was digested with Sph I and cloned
into the Xba I site of pDH796 to make pDH797.
2.3 Mating out assay:
For the mating out assays, NK5830 F’ and its isogenic mutant, Hfq
-,RpoS-,
H-NS-, or DksA-, derivatives were used as donors and HB101 as the recipient.
IS10/IS1413-Kan encoding plasmids (pDH502, pDH602, pDH725, pDH734, or
pDH797) were transformed into donor strains through electroporation and
transformants were selected for on LB plates containing kanamycin [25 μg/mL].
Under normal circumstances (Normal Mating Out), overnight cultures of donor
cells were grown overnight at 37°C with aeration to saturation in LB broth
containing kanamycin [25 μg/mL]. Overnight cultures were subcultured in LB
broth in the absence of antibiotics. For the mating out assay under starvation
conditions (Starved), donor cells were grown at room temperature (~25°C) on
benchtop (no aeration) in LB containing kanamycin [25 μg/mL] for 110 hours then
subcultured in LB broth in the absence of antibiotics. The first step of
subculturing consisted of diluting overnight cultures (1:20) in LB broth and
growing for 2 hours with aeration (250 rpm) for Hfq+ and RpoS-). For Hfq- and
DksA-(cells), the first step consisted of diluting overnight cultures (1:20) in LB
broth and growing for 4 hours with aeration (250 rpm). After the first step of
subculturing, Hfq+ and RpoS- cell cultures were moved to a gentle shaker (50
-extended growth time for the mutant strains allowed the slow growing Hfq- and
DksA- donor cells to reach a similar cell density as the NK5830F’ cells. Recipient
HB101 cells were grown in LB broth at 250 rpm at 37°C to reach an OD600 of 0.5.
Recipient and donor cells were gently mixed at a ratio of (2.5 mL : 1 mL)
respectively and grown at 50 rpm at 37°C for an additional hour. Cell mixtures
were vortexed for 30 seconds. One mL of cell mixture was removed, centrifuged
(4000 rcm for 4 minutes) and resuspended in 1 mL of 0.85% saline. To
determine the number of exconjugates (recipient cells that received the
F-plasmid), cell mixtures were plated on M9 plates containing glucose [0.2%],
leucine [40 μg/mL], thiamine [1 μg/mL] and streptomycin [150 μg/mL]. To
determine the number of transposition events (cells that received an F-plasmid
that also contained a marked IS element), cell mixtures were plated on M9 plates
containing glucose [0.2%], leucine [40 μg/mL], thiamine [1μg/mL] streptomycin
[150 μg/mL], and kanamycin [25 μg/mL]. The transposition frequency was
determined by the following equation:
For the sRNA overexpression mating out assays, the same procedure
outlined above was followed with the following exceptions. NK5830 F’ and its
Hfq- isogenic mutant DBH16 were co-transformed with pDH502 as an IS10-Kan
source and one of the sRNA expression plasmids (pDH694-696) for DsrA, RhyB
or MicC. Transformants were plated on LB-selective media containing
tetracycline [10 μg/mL] and kanamycin [25 μg/mL] either in the presence or
remained the same for overnight cultures. The rest of the procedure remained
the same as outlined above. For GlmZ overexpression, the same procedure was
followed with the exceptions outlined below. The source of IS10Kan was
pDH602 (to avoid plasmid incompatibilities). IPTG was used at a concentration
of 100 μM and the antibiotics used were ampicillin [50 μg/mL] and kanamycin [25
μg/mL]. Cells were checked after the overnight incubation (by using the
Sigma-Aldrich Mini-prep kit) to ensure cells maintained both plasmids.
Table 2.3 Oligos used in this thesis.
Oligo Use Sequence
BM1A Forward primer for IS1413 GAGCTAAAGTCGGAAGT
GGTGTACGGGGAGTTGA GGC
BM2A Reverse primer for IS1413 (Full Length) GAGCTAACGTCAAGAGTG GTGTATGAGCAATTTGA
BM3A Forward primer for IS1413 SELEX site mutation B in the LacZ translational fusion)
CGTAGCTAGCAGCTGATT GTCGAAGTCGGAAGCCA GCGAACACCAA
BM4A Forward primer for IS1413 for mutation C in the SELEX Site for
LacZ-Translational fusions
CGTAGCTAGCAGCTGATT GTCGAAGTCGGAAGCCA GTAAACTACAA
BM5A Reverse primer for LacZ gene for introduction into pBad24 vector
CGATGCATGCACTGTTAT TTTTGACACCAGACC
BM6A Reverse primer to complete the IS1413 sequence in the Xho I mutation
TCAAATTGCTCATACACC ACTCTTGACGTTAGCTC
BM7A Reverse primer for introduction of a Xho I site into IS1413
AGCAATTTGACGGCGCTC GAGTTCAAGC
BM8A Forward primer #1 for IS10 3’
RLM-RACE nested PCR
GAGCCATGGGTTCTAGCA ACTAACTTACC
BM9A Forward primer #2 for IS10 3’
RLM-RACE nested PCR
TACGCCATAGCCGAACGA GCAGC
BM10A Forward primer for introduction of the BM1 mutation in IS10
TTGCGGCATTCTGGCTAT ACAATAACACGGGAAGAC TTACTCG
BM11A Reverse primer for introduction of the BM1 mutation in IS10
BM12A Forward primer for introduction of the BM2 mutation in IS10
TTGCGGCATTCTGGCTAC ACGATAACGAGGGAAGA CTTACT
BM13A Reverse primer for introduction of the BM2 mutation in IS10
AGTAAGTCTTCCCTCGTT ATCGTGTAGCCAGAATGC CGCAA
BM14A Forward primer for 3’ RNA-IN (includes
a T7 RNA Polymerase promoter)
TAATACGACTCACTATAG GGCTGGCTACACAATAAC AAGGGAAG
BM15A Reverse primer for 3’ RNA-IN (includes
a T7 RNA Polymerase promoter)
CTGAGAGATCCCCTCATA ATTTCCCCA
BM16A Forward primer for 3’ RNA-IN BM1
(includes a T7 RNA Polymerase promoter)
TAATACGACTCACTATAG GGCTGGCTATACAATAAC ACGGGAAG
BM17A Reverse primer for 3’ RNA-IN BM1
(includes a T7 RNA Polymerase promoter)
TAATACGACTCACTATAG GGCTGGCTACACGATAAC GAGGGAAG
BM18A Reverse primer to introduce a stop codon in the IS10-LacZ translational fusions, for subsequent cloning to make the new IS10-Kan construct
TCATAATTTCCCCAAAGC GTAACC
BM19A Reverse primer (1) for the RNA-Adapter in 3’ RLM RACE nested pcr
(DE-193)
TTTCATCAAAGCCAGCAA ACGC
BM20A Reverse primer (2) for the RNA Adapter in 3’ RLM RACE nested PCR
RNA Adapter (DE-194)
CAAACGCAGTGTTCATTC ATCGCC
BM21A RNA-Adaptor for 3’ RACE GCUGAUGGCGAUGAAUG
AACACUGCGUUUGCUGG CUUUGAUGAAA
BM22A Forward primer for kanamycin resistance gene
GCTCTAGACTGAGAGATC CCTCATAATTTCCCCTCA GCAAAAGTACGATTTATT CAAC
BM23A Reverse primer for kanamycin resistance gene
GGACTAGTGCCAGTGTTA CAACCAATTAACCAATTC TGA
BM24A Forward primer for kanamycin gene (with a Sal I cut site introduced)
ACGCGTCGACTCAGCAAA AGTACGATTTATTCAAC
BM25A Reverse primer for kanamycin gene (with a Sal I cut site introduced)
ACGCGTCGACGCCAGTG TTACAACCAATTAACCAAT TCTGA
BM26A Forward primer for IS10 NNCAGCTGATGAATCCCC
TAATGATTTTGG
CCCAAAGCGTAAC
BM28A Forward primer for rrsb (16S rRNA) RT-PCR
CGTGTTGTGAATGTTGGG TTAAGT
BM29A Reverse primer for rrsb (16S rRNA) RT-PCR
AACCCACTCCCATGGTGT GACGGGC
BM30A Forward primer for glmZ RT-PCR GTAGATGCTCATTCCATC TCTTATGTTC
BM31A Forward primer for glmZ (includes a T7 RNA Polymerase promoter)
TAATACGACTCACTATAG GGTAGATGCTCATTCC
BM32A Reverse primer for glmZ AAAACAGGTCTGTATGAC
AACAAGTGG
BM33A Forward primer for rdlC (includes a T7 RNA Polymerase promoter)
TAATACGACTCACTATAG GGTCTGGTTTCAAGATTA GCC
BM34A Reverse primer for rdlC AGAAAACCCCCGCACGTT
G
BM35A Forward primer for sroG (includes a T7 RNA Polymerase promoter)
TAATACGACTCACTATAG GGCTTATTCTCAGGGCG
BM36A Reverse primer for sroG CGTTACTCTCTCCCATCC
GGAC
BM37A Forward primer for micC RT-PCR GTTATATGCCTTTATTGTC ACAG
BM38A Reverse primer for micC-RT-PCR AAAGCCCGGACGACTGTT CG
BM39A Forward primer for pLlacO1 rhyB NNCCATGGNNATAAATGT GAGCGGATAACATTGACA TTGTGAGCGGATAACAAG ATACTGAGCACAAACACA TCAGATTTCCTG
BM40A Reverse primer for pLlacO1 ryhB NNGAACCGGTTCNNAAAA GCCAGCACCCGGCT
BM41A Forward primer for pLlacO1 micC NNCCATGGNNATAAATGT GAGCGGATAACATTGACA TTGTGAGCGGATAACAAG ATACTGAGCACAGTTATA TGCCTTTATTGTC
BM42A Reverse primer for pLlacO1 micC NNGAACCGGTTCNNAAAA AAAGCCCGGACGAC
BM43A Forward primer for pLlacO1 dsrA NNCCATGGNNATAAATGT GAGCGGATAACATTGACA TTGTGAGCGGATAACAAG ATACTGAGCACAGCGATC AGGAAGACCCTC
2.4 Finding putative Hfq binding sites in IS Elements:
The following families were searched for on the IS Finder database
(http://www-is.biotoul.fr/): IS1, IS3, IS4, IS5, IS6, IS21, IS30, IS66, IS91, IS110,
IS200, IS605, IS256, IS481, IS630, IS982, IS1380, ISAs1, ISL3, Tn3, IS1595,
IS1182, IS1634, ISH3, and IS701. The search results were given as a table and
copied and pasted into Microsoft Excel. The URLs of each specific IS Element
were extracted to create lists of the URLs of all elements within a family.
WebSphinx Webcrawler (http://www.cs.cmu.edu/~rcm/websphinx/) was then
used to compile all of the URLs within each family into one concatenated
webpage saved as a text file. A Microsoft Word 2010 Macro was then used to
extract the following fields from the compiled text files: Family, Element, Hosts,
Transposition (Y or ND) IS_SEQ Comments and References, and put into a tab
delimitated excel file (see Script A1.1 in Appendix I) and more details. This
Microsoft Excel file was then searched using the SELEX site AAYAAYAA,
yielding the above results. In the database there were 3478 active links; 226 of
the IS-Elements were tested for transposition (Y) = 6.50% of submitted
sequences being actually transposing elements.
2.5 β-Galactosidase assays:
E. coli cells (NK5830F’ or its isogenic hfq-
derivative DBH16) were
electroporated with transposase-LacZ translational fusions containing either an
arabinose inducible IS1413 transposase gene portion (pDH757, pDH760 or
704). Transformants were grown overnight at 37°C on LB agar plates containing
ampicillin (50 μg/mL). Individual colonies were used to inoculate LB broth with
ampicillin [50 μg/mL] and grown overnight at 37°C with aeration (250 rpm).
Arabinose inducible constructs were grown either in the presence of arabinose
[0.2%] or glucose [0.2%]. Overnight cultures were subcultured by diluting
cultures 1:50 in LB broth in the absence of antibiotic and grown for 2 hours (for
hfq+ ) or 4 hours (for hfq-) at 37°C. Cultures were then placed on ice for 20
minutes. One mL of subculture was centrifuged (4000 rcm for 4 minutes),
aspirated, and resuspended in MinA broth. The turbidity of the cultures (OD600)
was recorded on a spectrophotometer (Montreal Biotech NanoPhotometer). Two
hundred and fifty μL of resuspended cells were resuspended in 250 μL of LacZ
Buffer permeablization buffer (60 mM Na2HPO4, 34 mM NH2PO4●H2O, 2.5 mM
KCl and 50 μM MgSO4●7H2O, 1% SDS, 0.3% β-mercaptoethanol). Fifty μL of
chloroform was added to each tube of permeabilized cells. Cells were lysed at
30°C for 5 minutes, followed by the addition of 100 μL of
ortho-Nitrophenyl-β-galactosidase [4 mg/mL in LacZ Buffer] (this is considered the start time of the
reaction). Samples were incubated at 30°C until they took on a yellow hue after
which 250 μL of sodium carbonate [100 μg/mL] was added (this is considered the
stop point of the reaction). Samples were further incubated for 5 minutes at
30°C, centrifuged (max speed, 5 minutes) and decanted into a cuvette. The
optical density was measured for each sample at wavelength 420 nm and 550
nm. Miller units were calculated using the following equation:
Where
t = Elapsed time from start to finish
v= volume of cells used
2.6 Hfq protein purification:
Hfq protein was purified as described in 18.
2.7 In vitro transcription and RNA labeling:
DNA templates for in vitro transcription were made via PCR. Wild type,
BM1 mutant and BM2 mutant RNA-IN run off transcription templates (bp
1222-1329) were prepared using a T7 RNA polymerase (RNAP) promoter containing
forward primer BM14A, BM16A or BM17A respectively. A common reverse
primer BM15A, was used for each transcript. The sRNAs GlmZ, RdlC, and SroG
run off transcription templates were prepared using the primer pairs
BM31A/BM32A, BM33A/BM34A, and BM35A/BM36A. The forward primers
BM31A, BM33A and BM35A all contain T7RNAP promoters. The resulting
amplicons were gel purified using the QIAEX II Gel Extraction kit and protocol
(Qiagen).
Run off in vitro transcription reactions consisted of 100 ng of linear DNA
template, rNTP mix {NEB) ( rATP [0.5 mM], rCTP [0.5mM], rGTP [0.5 mM]),
2.5μL of α32
P- UTP [3000Ci/mMol] (PerkinElmer) 20 units of RNasin (Promega),
DTT, inorganic pyrophosphatase [0.25U] (NEB) and T7 RNA polymerase buffer
[1x] (NEB). For in vitro transcription of unlabeled RNA, α32
P- UTP was replaced
with 0.5 mM rUTP. The reaction was incubated at 37°C for 30 minutes. Two μL
of Turbo DNase (Invitrogen) was added to the reaction mixture and incubated for
another 30 minutes. The reaction mixtures were run through a BioSpin 30
column (BioRad). An equal volume of stop dye (10 mM EDTA [pH 7.5]; 97.5%
formamide (v/v); 3 mg (w/v) xylene cyanol and bromophenol blue) was added to
reaction mixtures. The reaction mixtures were then loaded on a 10% denaturing
(3M urea) polyacrylamide gel and ran at 21V/cm until the bromophenol blue dye
reached the bottom of the gel. RNA bands were cut out of the gel and eluted
overnight at 42°C in elution buffer (0.25M ammonium acetate [pH 5.8], 1 mM
EDTA [pH 8], 0.1% SDS ). The RNA was ethanol precipitated in 200 μL aliquots
by adding 8 μL of DEPC treated NaCl [5M], 1 μL of glycogen (20 mg/mL), 4 μL
EDTA (100 μM, pH 8.0), and 700 μL of 100% ethanol. Samples were incubated
at -72°C for 30 minutes, centrifuged at maximum speed for 30 minutes at 4°C,
washed twice with 70% ethanol and dried until no liquid remained (~ 5-10
minutes). RNA was resuspended in Hfq buffer (50 mM Tris [ph 7.5]; 1 mM
EDTA; 250 mM ammonium chloride; 10% glycerol)) and quantified using a
spectrophotometer (Montreal Biotech NanoPhotometer).
2.8 Electrophoretic mobility shift assays:
RNA (32P labeled or unlabelled) was thawed on ice, heated at 95°C for 2
figure legends of the appropriate experiments. When two species of RNA were
being looked at simultaneously (pairing experiments), the two RNA species were
mixed together and incubated at 37°C for 15 minutes. For competition
experiments, Hfq was preincubated with the competitor RNA (dsrA or polyA16) for
10 minutes at room temperature followed by the addition of RNA-IN for an
additional 10 minute incubation at room temperature. For EMSAs looking at only
one RNA species, Hfq the RNA were incubated for 10 minutes at room
temperature together in 10 μL. Binding reaction mixes had load mix added (20
mM Tris-HCl pH 7.5, 10 mM DTT, 100 mM KCl, 30% glycerol; 0.05% w/v
bromophenol blue) and were loaded onto a 6% native polyacrylamide gel. Gels
were run at 21V/cm until the bromophenol blue ran to the bottom. The gel was
then dried, and analyzed using a Phosphoimager (Storm 860 Scanner) and
ImageQuant software (GE Life Sciences).
2.9 RNA-sRNA basepairing predictions:
The sRNA map database69was downloaded from
(http://srnamap.mbc.nctu.edu.tw/download.php). The sRNA sequences were
then merged into one file using MS-DOS’s copy function. The resulting text file
was used as the source of RNA sequences and was pasted into the ncRNA field
of IntaRNA; IS10 transposase DNA sequence was then pasted into the mRNA
field of IntaRNA. The results table from INTARNA was copied into MS-Excel
between the mRNA and sRNA. The parameters set for IntaRNA were: 37°C and
a minimum seed region of 7 basepairs.
2.10 3’ RNA ligase-mediated rapid amplification of cDNA ends (3’
RLM-RACE):
Three prime RLM-RACE was conducted as described in 70. NK5830 F’
cells containing the Tn10 containing plasmid pBE10 was grown to exponential
phase (OD600 = 0.6) in LB broth containing tetracycline [10 μg/mL]. Cells were
grown at 37°C with aeration. Total cellular RNA of the Tn10 expressing NK5830
F’ cells was extracted using the RNEasy kit (Qiagen) according to manufacturer’s
protocol. The RNA ligation reaction mixture contained: 2 μg of total cellular
RNA,T4 RNA Ligase Buffer (1X, NEB), DMSO (10% v/v), 20 U of RNAsin
(Promega), RNA adapter BM21A [1.5 ng/μL], 20 units of T4 RNA ligase (NEB),
and DEPC H2O to bring the reaction mixture volume to 50 μL. The RNA ligation
mixture was incubated for 1 hour at 37°C and then cleaned up using the RNEasy
kit (Qiagen) eluted in 30 μL of RNase free H2O. The RNA was then subjected to
reverse transcription PCR. Five μL of each sample containing the ligated RNA
adapter was mixed with2 μL of BM19A [20 μM] and 4.5 μL of nuclease free H2O.
The reactions were heated to 75°C for 5 minutes and then immediately cooled on
ice. To the reaction mix, 1 μL of Moloney Murine Leukemia Virus Reverse
Transcriptase (M-MuLV RT) [200000 units/mL] (NEB), 5 μL of dNTP mix [10 mM],
2 μL of M-MuLV RT Buffer [10x] (NEB) and 0.5 μL of RNasin inhibitor was added.
clean up column (Qiagen) and eluted in 30 μL of nuclease free H2O. The
resulting cDNA mixture underwent a nested PCR reaction. For the first reaction 5
μL of cDNA was mixed with 1.25 μL of primers BM8A/BM19A [20 μM each], 5 μL
H2O and 12.5 μL of GoTaq Master Mix (Promega) [2X]. PCR cycling parameters
were as follows: 98°C for 2 minutes for an initial denaturing, followed by 10 cycles
of 98°C for 30 seconds, 64.5°C for 40 seconds, and 72°C for 2 minutes. The
PCR mixture (mix 1) was diluted with 180 μL of ddH2O. This diluted mix 1 was
then used for a second round of amplification consisting of 5 μL of diluted mix,
1.25 μL of primers BM9A/BM20A [20 μM each], 5 μL of H2O and 12.5 μL of
GoTaq Master Mix (Promega). PCR cycling parameters were as follows: 98°C
for 2 minutes for an initial denaturing, followed by 30 cycles of 98°C for 30
seconds, 68°C for 40 seconds, and 72°C for 2 minutes. A final extension step
was performed at 72°C for 5 minutes. The PCR amplicons were gel purified
using the QIAEX II Gel Extraction Kit (Qiagen) according to the manufacturer’s
protocol. Gel extracted amplicons were cloned into the T-vector pGEM-T-EASY
(Promega) and used for electroporation of DH5α electrocompetent E.coli cells.
Plasmids were extracted from individual clones using the GenElute™ Plasmid
Miniprep Kit (Sigma-Aldrich) and sent for sequencing using primer BM9A.
2.11 Western blots:
For Hfq semi-quantification in NK5830 F’ cells and its rpoS-
isogenic
derivative in the mating out assays, individual colonies were grown in LB broth
containing kanamycin [25 μg/mL] in conditions identical to the mating out assay.
resuspended in 20 μL of 1X Laemmli load dye and boiled for 5 minutes. Cell
lysate was briefly centrifuged to collect lipids to the bottom of the tube. Ten μL of
supernatant was loaded on a 12% Tricine SDS Polyacrylamide gel. Samples
were run at 100V on the Mini-Protean II system (BIO-RAD) with 1X tricine buffer
(0.1 M Tris, 0.1 M tricine and 0.1% SDS) until the samples passed through the
stacking gel. The voltage was then increased to 150V and run until the
bromophenol blue dye front reached the bottom of the gel. Proteins were
transferred to a PVDF membrane (45 mA for 40 minutes). Hfq was detected
using a rabbit polyclonal Hfq antibody (diluted 1:100,000 in 2.5% powdered
non-fat milk (Nelson) in TBST (2 mM Tris pH7.5, 0.5% Tween-20, 15 mM NaCl)) and
a Goat Anti-Rabbit IgG (H+L), conjugated to horseradish peroxidase (1:4000
dilution in 2.5% powdered non-fat milk (Nelson) in TBST) (Pierce). PVDF
membranes were imaged using the Storm 860 Scanner. PVDF membranes were
then stained by Coomassie stain, and a picture was obtained for sample
normalization on an Alpha Imager. Western blot and coomassie images were
analyzed for band intensity using ImageJ software (NIH).
2.12 Verification of sRNA induction:
Plasmids containing IPTG inducible sRNAs (pDH694-696, pDH673), were
verified to induce via IPTG by extracting RNA from NK5830F’ E. coli in the
presence or absence of IPTG RNA was extracted from exponentially growing
NK5830F’ cells (OD600=0.6) and isolated using the hot phenol extraction method