ISSN 2286-4822
www.euacademic.org DRJI Value: 5.9 (B+)
The Effect of Different Levels of Organic Selenium
on Growth Performance, Carcass Traits and Its
Concentration in the Muscle of Broilers
VEZIR JANUZI1
LUMTURI SENA Faculty of Agriculture and Environment Agricultural University of Tirana, Albania
XHEVDET ELEZI Faculty of Agriculture and Veterinary
University of Prishtina, Kosovo FATIME SENA Veterinary Practitioner, Tirana, Albania
Abstract:
It was investigated the effect of using different levels of Organic Selenium (Se) on growth performance, carcass quality and its concentration on muscle in broiler chicks. In order to reach this goal 900 unsexed chicks ROSS-708, 0 day old, divided in three equal groups were used, for which the same diet was used. While in the control group (C) the level of Selenium in diet was 0.0, experiment group 1 (E1) was supplemented with 0.4 mg/kg Se, while experiment group 2 (E2), 0.4 mg/kg in the first three weeks and 0.8 mg/kg in the the last two weeks. The study lasted 35 days and was divided in two phases. At the end of this study it resulted that diet usage of different levels of selenium showed no effect on the growth performance. Adding the dosage of selenium showed only a slight vantage in the weight of muscles, skin and bones. At the end of each stage it was analyzed the content of selenium in meat in the Lab. The results showed that with the addition of selenium level in the diet it was also increased its deposit in muscles (P≤0.05). Treated group in the second stage with 0.8 mg/kg Se was distinguished for a higher concentration of selenium in
the muscles, respectively: in the white muscles 70% more than of C and 27.5% more than of E1, and in the red muscles 72.2% more than C and 29% more than E1.
Key words: Broiler, organic selenium, performance, selenium concentration.
INTRODUCTION
Selenium is a very important microelement for animals and humans. In livestock it was proven that the supplementation of food rations with selenium is very effective (Quesnel H. Renaudin A. Le Floc'h N. Jondreville C. Pere M C. Taylorr – Pickard JA Le Dividich J 2008). Inorganic selenium is a constituent in the premixes used in bird feeding. In larger doses, selenium becomes toxic to cell tissue and also contaminates the environment through excreted fecal. It is known that inorganic selenium can not be fully metabolised by animals and it is poorly absorbed by their organism. Sel-plex, or selenomethionine is natural and can be well metabolized by the bird's organism by increasing its retention and activity (Djordjevic Sonja, Omerovic Izeta, Stolic Nikola, Milosevic Bozidar 2016), (Schrauzer 2000). As an organic source, it is absorbed and metabolized more easily.
Panda, Saharia Poonam, Orugonda Krishna Murthy, 2013 Feb; 26).
The purpose of this study is to evaluate the degree of influence of the application of different levels of selenium on the diet of broilers in growth performance, slaughter performance and deposition in the muscular tissues.
MATERIAL AND METHODS
The experiment was carried out on a broiler farm in Podujevo, Kosovo, for a 35 day period. For this purpose, 3 experimental groups were set up with 300 chicks (birds) each aged 1 day. The same diet was used for the three groups. While control was not supplemented with Se, E1 was supplemented with 0.4mg/kg throughout the growth period, while E2 at 0.4 mg/kg Se in the first three weeks (first phase) and 0.8mg/kg in the last two weeks of the experiment (second phase). Feed and water were provided ad libitum.
18 heads/m2 were housed. For all groups, the same lighting regime was applied during 24 hours, keeping under control the intensity of light according to the technology card. Gas heating and optimum ventilation were provided.
Indicators that were registered:
Vitality (in headings and in %)
Food consumed for each group in kg. Calculation of total feed consumption per chick and per kg weight gain (FCR).
The weight of one day chicks at the beginning of the experiment, and in continuity week after week. Weighing every week was done in the morning before eating food at 5% of the number of heads (15 heads).
Food samples according to the experiment scheme were taken and analyzed at the beginning of each experimental phase by groups and subgroups.
At the end of the experiment, 10 chicks per group were analyzed for the following indicators: live weight, slaughtered weight, carcass yield, white meat, red meat, skin and bones. Chicks were slaughtered 10 hours after food removal. 5 heads per group were used to analyze the contents of Se in the lab.
All samples of the material were mineralized according to the selected standard program with the MW3 + (microwave) production Berghof, Germany. Mineralized samples were subjected to the measurement of the content of Se in ICP-OES, manufactured by Perkin- Elmer, USA, under specified working conditions (length of value) selected for Se, element which under these conditions is detected up to 4ppb.
Determination of the content of Se under the mentioned conditions was carried out in the laboratory of NSH Agrovet, Kosovo, which is accredited according to ISO 17025-2006.
Table 1. Experiment scheme
Age to day Control Experiment 1 Experiment 2
F I ( 1-21 ) - 0.4 mg / kg Se 0.4 mg / kg Se
F II ( 22-42 ) - 0.4 mg / kg Se 0.8 mg / kg Se
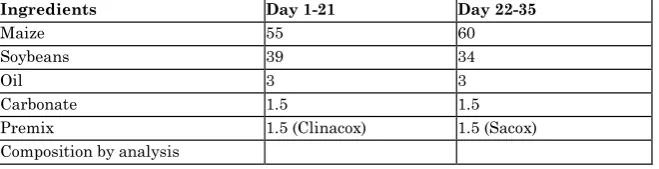
The structure of the diet used and the analysis of its chemical composition for the two phases of growth is presented in the following table:
Table 2. Composition of the diets according to the phases used on the farm
Ingredients Day 1-21 Day 22-35
Maize 55 60
Soybeans 39 34
Oil 3 3
Carbonate 1.5 1.5
Premix 1.5 (Clinacox) 1.5 (Sacox)
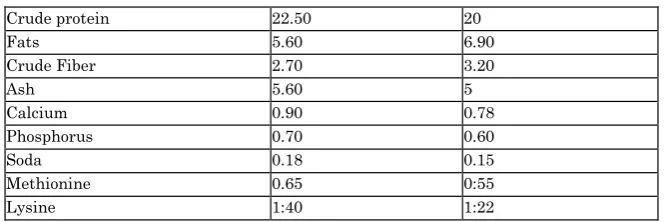
Crude protein 22.50 20
Fats 5.60 6.90
Crude Fiber 2.70 3.20
Ash 5.60 5
Calcium 0.90 0.78
Phosphorus 0.70 0.60
Soda 0.18 0.15
Methionine 0.65 0:55
Lysine 1:40 1:22
RESULTS AND DISCUSSION
Live weight gain by groups M ± SD (g)
Age in weeks Control Experiment 1 Experiment 2
First day 45.45 ± 2.91 47.2 ± 3.52 45.95 ± 2.55
1 149.8 ± 20.87 152.4 ± 13.88 150.2 ± 19.27
2 335.35 ± 35.47 333.75 ± 35.98 342.45 ± 61.15
3 624.6 ± 50.88 625.3 ± 79.82 629.7 ± 87.79
4 1101.85 ± 126.65 1111.55 ± 194.40 1137.45 ± 135.87
5 1423.55 ± 194.91 1431 ± 156.27 1445.7 ± 199.53
As seen in the table in continuation of the growing period, weight differences between groups are small. Calculating the paired t Test of sample for means for P≤0.05, it is noticed that in any week the differences are not significant among the groups for the live weight. So, the different levels of Se in the feed diet of broilers did not affect the body weight.
(FW 1996) and (Spears JW, Grimes J., Lloyd K., Ward TL. 2003) also reported no significant differences regarding live weight and feed efficiency of broiler chickens fed diets containing Se.
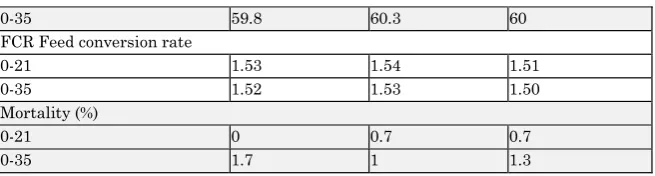
Table 3. The effect of different levels of selenium on growth performance and mortality
Indicators Control Experiment 1 Experiment 2
Average daily weight gain (ADG) g / day
0-21 27.57 27.53 27.80
0-35 39.37 39.54 39.99
The average daily feed intake (ADF I) g / day
0-35 59.8 60.3 60 FCR Feed conversion rate
0-21 1.53 1.54 1.51
0-35 1.52 1.53 1.50
Mortality (%)
0-21 0 0.7 0.7
0-35 1.7 1 1.3
Differences in the weight gain at the end of the first phase (0-21 days) and at the end of the experiment are not significant between groups. The same can be said for daily feed intake as well as for FCR. A slight improvement in feed conversion from E2 chicks was observed, saving 1.32% compared to control and 1.96% compared to experiment 1. At the end of growth it is noticed that the lower mortality was for experiment 1 (0.7% lower than the control and 0.3% lower than the 2nd experiment. Even for this indicator the differences are non-significant.
According to (Briens, M. Mercier, Y. Rouffineau, F. Vacchina, V. Geraert P.A. 2013), it was reported that the use of different selenium levels in diet did not significantly effect on the performance of broilers for the first three weeks of their live. This is also confirmed by other studies (Payne RL Southern LL 2005) (Yoon I. W Erner T.M Butler J.M 2007) (Upton JR Edens F. W. Ferket P.R 2008) (Wang Bo Xu Yan Bao Hua. 2008) (Jiang Z. Lin Y. Zhou G. Luo L. Jiang S. Chen F. 2009) for the entire growth period. According to (Guoshun Chen, Jinfeng W, Chong Li. 2013), the productive performance of broilers did not significantly improve when their diet was supplemented with 0.3, 0.5, 1.0 or 2.0 mg/kg of organic selenium.
Table 4. Carcass characteristics of broilers at the end of growth (mean ± SD)
Groups Live weight (g) Weight slaughtered (g) Carcass yield (%) White meat (g)
Red meat (g)
Skin (g) Bones (g)
Control
1398.55 ± 220.72
1013 ±
191.98 72.4
236 ± 68.98
242 ± 69.24
95.6 ± 12.28
397.4 ± 97.78
Experiment 1
1401 ± 206.6
1051 ±
107.67 75.02
249 ± 29.56
264.2 ± 38.10
98.2 ± 22.39
400.6 ± 80.33
Experiment 2
1440.7 ± 203.66
1077 ±
130.03 74.8
262 ± 45.44
265.2 ± 28.67
103.4 ±21.32
404 ± 57.78
At the end of the growth 10 heads per group were slaughtered and analyzed Carcass yield, white meat, red, skin, and bones indicators. With a slight difference, the best Carcass yield had two experimental groups, while the control group had a net weight 3.5% lower than experiment 1 and 3.2% lower than the exp 2. Difference is also observed in white meat, where the E2 group is distinguished by weight of 13g greater than E1 (or 4.96%) and 26g greater than C (or 9.92%). Even for red muscles, skin and bones, it is noticed a slight advantage of E2 group on the other two. However, the differences are statistically unproven for P≤0.05. According to (Ž. Jokić, Z. Pavlovski, S. Mitrović, V. Đermanović. 2009) the mean values of the slaughter indicators were close to the chicks of all the groups with non- significant differences.
At the end of each phase, the content of selenium in the meat was analyzed in the laboratory.
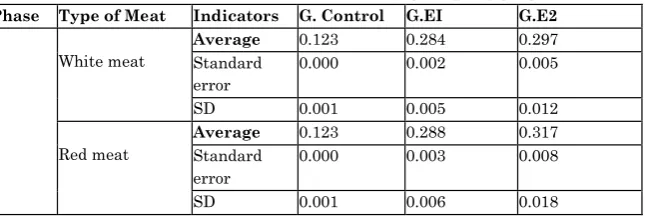
Table 5. Selenium concentrations in meat by groups (μg/kg Se)
Phase Type of Meat Indicators G. Control G.EI G.E2
1
White meat
Average 0.123 0.284 0.297
Standard error
0.000 0.002 0.005
SD 0.001 0.005 0.012
Red meat
Average 0.123 0.288 0.317
Standard error
0.000 0.003 0.008
2 White meat Average 0.122 0.295 0.407
Standard error
0.000 0.003 0.004
SD 0.002 0.007 0.010
Red meat Average 0.123 0.314 0.442
Standard error
0.000 0.010 0.009
SD 0.001 0.021 0.020
It should be noted that at the end of the first phase the differences are not verified only between E1 and E2 for white meat, whereas for red meat these differences are slightly larger and statistically verified. At the end of the second phase there is a high amount of selenium in both muscle types, especially in E2. Increasing the dose of Se in the ration in E2 in the second phase from 0.4 to 0.8 caused the concentration of selenium in the muscle to increase significantly (for P <0.05). Group treated at the second stage with 0.8 mg/kg Se was distinguished for a higher concentration of selenium in muscle respectively: in white muscles 70% more than in C and 27.5% more than E1, whereas in red muscles 72.2% more than C and 29% more than E1.
If we make a comparison for each group of selenium deposition in the muscle between the two phases, we will notice that in the control group the differences are insignificant. In experiment 1 there is a significant increase in selenium deposition from one phase to the next, but the increase is more evidenced in experiment 2, and more in pectoral muscles.
CONCLUSIONS
Based on the results obtained we can conclude:
Supplementation with selenium diet of broilers (0.4 and 0.8) did not affect on their growth performance indicators (weight, weight gain, FCR, mortality). Addition of organic selenium dosage greatly improved the carcass yield, white and red meat (statistically not confirmed differences). Addition of the level of selenium in the diet has increased to a considerable extent its deposition in the pectoral and breast muscles (P <0.05).
LITERATURE
1. Briens, M. Mercier, Y. Rouffineau, F. Vacchina, V. Geraert P.A. "Comparative study of a new organic selenium source v. seleno-yeast and mineral selenium sources on muscle selenium enrichment and selenium digestibility in broiler chickens." Br J Nutr., 2013: 110 617 – 624.
2. Djordjevic Sonja, Omerovic Izeta, Stolic Nikola, Milosevic Bozidar. "Effect of Organic Selenium in Broiler Diet on Slaughter Traits and Plasma Lipids." IOSR Journal of Agriculture and Veterinary Science (IOSR-JAVS) e-ISSN: 2319-2380, p-ISSN: 2319-2372. Volume 9, Issue 5 Ver. I, 2016: PP 71 – 73.
3. FW, Edens. "Organic selenium: From feathers to muscle integrity to drip loss Five years onward: No more selenite,." UK Proc. Alltech's 12th Ann. Sympa, 1996: (165 – 185).
and biochemical parameters of broilers." Italian Journal of Animal Science volume 12: (2013): 486 – 491.
5. Guoshun Chen, Jinfeng W, Chong Li. "The effect of different selenium levels on the production performance and biochemical parameters of broilers." Italian Journal of Animal Science volume 12: (2013): 486 – 491.
6. Jiang Z. Lin Y. Zhou G. Luo L. Jiang S. Chen F. "Effects of dietary selenomethionine supplementation on growth performance, meat quality and antioxidant properties in yellow broilers." J Agri Food Chem. 57,, 2009: 9769 – 9772.
7. Krstic B, Jokić Z, Pavlović Z, Zivkovic D. "Options for the production of selenized chicken meat." Biol Trace Elem Res.146, 2012: 68 – 72.
8. Norheim, G and K. Moksnes. "Distribution and Elimination of Selenium and Glutathione Peroxidase (GSH-Px) in chickens after supplementation with sodium selenite or selenomethionine." In:Proceedings: Fifth International Symposium on Trace Elements in
Man and Animals. CAB, Farnham Royal, Slough, UK,
1985: pp. 493 – 495.
9. Payne RL Southern LL. "Changes in glutathione peroxidase and tissue selenium concentrations of broilers after consuming a suitable diet in selenium."
Poultry Sci. 84, 2005: 1268 – 1276.
10.Perić L, Milošević N, Zikić D, Kanački Z, Džinić N, Nollet L, Spring P. "Effects of selenium sources on performance and meat characteristics of broiler chickens." J Appl Poult Res.18, 2009: 403 – 409.
sanitary environment after weaning." Animal 2, 2008: 859 – 866.
12.Savaram Venkata Rama Rao, Bhukya Prakash, Mantena Venkata Laxmi Narasimha Raju, Arun Kumar Panda, Saharia Poonam, Orugonda Krishna Murthy,. "Effects of supplementing organic selenium on performance, carcass traits, oxidative parameters and immune responses in commercial broiler chickens."
Asian-Australas J Anim Sci (2), 2013 Feb; 26: 247 – 52. 13.Schrauzer, GN. "Selenomethionine: A review of its
nutritional significance, metabolism, and toxicity." J. Nutri. 130, 2000: 1653 – 1656.
14.Spears JW, Grimes J., Lloyd K., Ward TL. "Efficacy of a novel organic selenium compound (zinc- 1.selenomethionine, available Se) in broiler chicks,."
Cancun, Mexico Proc. 1st Latin Am. Congr. Anim. Nutr,
2003: (197 – 198).
15.Upton JR Edens F. W. Ferket P.R. "Selenium yeast effect on broiler performance." Int J Poultr Sci.7,, 2008: 798 – 805.
16.Wang Bo Xu Yan Bao Hua. "Effect of different selenium source (sodium selenite and selenium yeast)." the Anim Feed Sci Technol broiler chicken 144, 2008: 306 – 314. 17.Yoon I. W Erner T.M Butler J.M. "Effect of source and
concentration of selenium on growth performance and retention of selenium in broiler chickens." Poultry Sci. 86, 2007: 727 – 730.
18.Ž. Jokić, Z. Pavlovski, S. Mitrović, V. Đermanović. "The effect of different levels of organic selenium."
Biotechnology in Animal Husbandry (Institute for