Applying FAST & FREAK Algorithms in
Selected Object Tracking
S.Khachikian1, M.Emadi2
MS Student, Dept. of Electrical Engineering, ACECR Institute of Higher Education (Isfahan Branch), Isfahan, Iran1
Assistant Professor, Dept. of Electrical Engineering, Mobarakeh Branch, Islamic Azad University, Mobarakeh, Iran2
ABSTRACT: Object tracking is defined as a method applied in tracking and recognizing the state of a moving object selected by the user or found based on a specific feature in different image frames. For this purpose different features of the selected object like: corners, colour, geometric shape, dimensions etc. are extracted accordingly, and in the next frame, the new location of the object is recognized which makes the tracking of the moving path possible. Several methods are proposed among which extracting and using the key points of the image is the one mostly applied. Here, the FAST is applied and the binary descriptors and indexes of each key point found thereof are introduced by FREAK, inspired by human eye, applied in comparing and recognizing the objects in each frame. Based on this the accuracy and speed of the recognition increase with less memory space needed for implementation. The performance evaluation of this newly proposed method is made through the data set introduced by Mikalajczyk and Schmid. The obtained results indicate a 99% precision on images not subjected to transformation.
KEYWORDS:Key Points, Binary Indexes, FAST, FREAK, Retina.
I.INTRODUCTION
Tracking of an object selected by the user or recognizing the specific object of interest and its tracking can be applied in public transportation, traffic, military and rescue systems etc. In recent decades several studies are conducted on image processing for object recognizing and tracking through different scientific and experimental methods. Limitations like different kinds of noise, changes in the scene light, changes in object perspective, occlusion occurrence, object splitting, a new object appearing, high processing volume and high processing speed required, in efficient image resolution and clarity, appearing and disappearing of shadows, distinguishing background and foreground with each other, changes in object size and dimension due to being close to or far from the camera, problems in how the camera is moved, etc. all of them are problems exist in object tracking and recognition. The low speed of image processing, occupation of high processing memory capacity, incapable of using the available cameras in urban systems, closed circuit cameras in public transportation, low percentage of correct detection of object situation due to existence of disturbing parameters in addition to encoding and processing complexity, are the problems for solving of which many approaches are presented but they are yet to be improved. Attempt is made in this study to find the key points through Features from Accelerated Segment Test (FAST) and apply Fast Retina Key Point (FREAK) to compare the key points and objects recognition in user-selected object tracking in order to reduce or remove some of these deficiencies.
II.LITERATURE REVIEW
2002, [5]. The authors, applied (MSER) as a method for bubble detection in images, like finding the similarities between image elements in two photos with different views. Speeded up Robust Features (SURF) detector was introduced in 2006 by H. Bay et al, [6]. In SIFT and SURF algorithms use slightly different methods are for features recognition. SIFT constructs a pyramid of image, filters each layer with Gaussian amounts of increasing sigma and captures the differences. SURF is inspired by SIFT detector but designed with insisting on speed with having the main weak point of SIFT. Detecting the Features from Features Accelerated Segment Test (FAST) was introduced by E. Rosten and T. Drummond in 2006, [7]. The main idea of FAST is based on SUSAN corner detector, [8]. Binary Robust Independent Elementary Features are introduces by M. Calonder et al in 2010, [9]. This is a multi-purpose point-feature descriptor which can be combined with desired detectors. EnginTola et al in 2010 [10] introduced a local image descriptor, DAISY, which is very efficient in compact computation. Binary Robust Invariant Scale Key point (BRISK) detector is a method for recognition, description, key point adaptation established in 2011 by S. Leutenegger et al [11]. This method is a combination of DAISY and BRIEF descriptors which has the advantage of fast convergence and good numeric stability associated with occupying the least amount of computer recording memory. Determining the independent elementary Oriented Robust Binary (ORB) feature was introduced in 2011 by E. Rublee et al [12]. This method is a standard for oriented FAST and rotated BRIEF.
III.METHODOLOGY
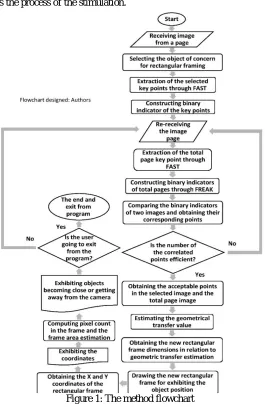
The flowchart bellow shows the process of the stimulation.
Introduction to FAST algorithm for key point extracting
The main idea of FAST is based on SUSAN Corner detector [8], where the corner of a circular area is used for determining lighter and darker neighbouring pixels. However, in FAST, not the whole area, but just the pixels on discrete circle of descriptor segment, is evaluated. Like SUSAN, in FAST the Bresenham circle of 3.4 pixels diameter is applied as the test mask; therefore for a complete segment test, 16 pixels must be compared with the core value [13]. The criteria for a pixel to be a corner, based on the Accelerated Segment Test (AST), where the circle must have at least 6 connected pixels lighter or darker than the threshold value of the centre pixel. The values of the other 16-S pixels are not important. Hence, S value defines the most determined corner angle. Keeping the value of S, as big as possible, while it keeps suppressing the edges (where, S = 8), the repeatability of the corner detector increases. FAST with segment size of 9 (FAST-9) is usually the preferred version. AST, when composes the value of a pixel on the circular pattern with the core brightness, applies the minimum difference threshold. This parameter controls the corner response sensitivity. A big t-value yields few but strong corners, unlike the small t value which yields corners with smooth gradients. In [14] it is shown that AST with S = 9 in comparison to other corner detectors like Harris, DoG or SUSAN of higher repeatability. Repeatability of a corner detector is a quality criterion that measures the method ability in determining similar corners of one scene from different perspectives. The prevailing question is which one of the first, second, third and the fourth pixels is compared first. It is clear that there exist a difference in speed. Depended on that one pixel is evaluated after another or for example two parts on the circle pattern is used to test that if corner criteria can be applied anymore or not.] This problem is an identified and limited paradigm. To determine which question is addressed, a decision tree with the purpose of decreasing the path length average must be designed. Rosten [7], uses ID3 [15] a learning machine method, to find the best decision tree based on the training data of the environment applied by FAST. Doing so does not guarantee that the possible pixel topologies would be found. At the moment, small camera rotations may produce pixel configurations that are not measured in test images even if all the pixel configurations are present. A slight rotation on the optical axis causes the measured probability distributions of pixel configurations, to change drastically. This could lead to a many slow corner responses. Hence the probability distribution learning of specific scenes is not applicable, unless the same perspective and scenes are of concern. Note that the decision tree is optimized in a specific decision tree and must be retrained for each time it changes if better performance is expected. The trained decision tree used in FAST algorithm, builds a ternary tree with possible pixel states of “lighter”, “darker” and “similar”. In each one of the learning steps both the “is brighter” and “is darker” questions are applied in all remaining pixels and the one with the highest information efficiency is chosen. As a result, the state of each pixel could be one of the: unknown (u), darker (d), brighter (b) or similar (s). Here, N is named number of these states, and one pixel configuration. Therefore, the size of configuration space is 4N which produces 416 4.109 possible configuration for N = 16. This model is recognized as the constrained or 4 states configuration space. FAST-ER the last FAST version, in comparison with FAST-9 has even higher repeatability at the cost of computational performance. The main difference here is in the thickness of Bresenham circle which is increased by 3 pixels. This again leads to a more similarity to SUSAN algorithm which measures a circular 56 pixel area, disregarding the 3 3 interval pixels. Ones more ID3 is used for decision tree pattern which limits the evaluation to just a small part of 47 pixels.
Introduction of FREAK algorithm
(1)
(2)
(3)
Figure 2: Illustration of the distribution of ganglion cells over the retina. The density is clustered into four areas: (a) the foveola, (b) fovea, (c) parafoveal, and (d) perifoveal [16]
Figure 3: Illustration of the FREAK sampling pattern similar to the retinal ganglion cells distribution with their corresponding receptive fields. Each circle represents a receptive field where the image is smoothed with its
corresponding Gaussian kernel [16]
In experimental sense it is observed that changing in Gaussian kernels based on the log-polar retinal pattern, would yield a better result. In addition, overlapping of the receptive fields would also improve the efficiency, and this might be due to the fact that with the overlapping shown in Figure 3, more information is received. This act is associated with more discriminative power. Let us consider the intensities Ii in receptive fields represented by A, B, C [16]:
If the fields do not have any overlapping, the last test IA I C will not add any discriminant information; otherwise, new information could be encoded partially. In general by adding this redundancy less receptive field is used which is a well-known and commonly applied strategy in compact sensing or dictionary learning. Based on OI-shausen and Field [17], this redundancy is present in retina receptive fields. The binary descriptor F is built by threshold on pairs of receptive fields or their correspondent Gaussian kernel, similar to the method proposed in [16]. F is a binary string formed by a sequence of one-bit difference of Gaussians (DoG) [16]:
where, Pa is a pair of receptive field and N is the desired descriptor size, and:
where, I ( ) is the smoothened intensity of the first receptive field of the pair Pa.
non-discriminative. Consequently, an algorithm similar to ORB [12] is implemented for better learning of the pairs from the training data, as proposed in [16]:
1. A matrix D is generated, with about 50,000 extracted key points. Each row relates to a presented key point with its large descriptor, which includes all possible pairs in the retina sampling pattern, Figure 3. Here 43 receptive fields which leads to about 1000 pairs are used.
2. The mean value for each column is calculated. In order to have a distinguished feature, the high variance is considered. A mean equal to 0.5 would lead to a binary distribution.
3. The columns are arranged based on the highest variance.
4. The best column is held (mean = 0.5) and the remaining columns with low correlation with the selected columns are added.
There exist one structure in the selected pairs; therefore, a course to fine order of difference of Gaussians is preferred. The selected pairs through their grouping of 4 groups of (128 pairs in each group) are shown in Fig. 4below. In [16] it is observed that the first 512 pairs, are the most correlated ones and adding more pairs would not increase efficiency. Here a symmetric map is obtained due to both the patterns along the total gradient. The first group is usually related to the peripheral receptive fields, while the final groups greatly are referred to the central regions. This fact symbolizes the behaviour of the human eye. In human eye, first, the peripheral receptive fields are used to estimate the situation of the object of interest followed by validation through receptive fields distributed densely in fovea region. Although the feature selecting algorithm here is based on experiment, it somehow corresponds to human comprehension regarding knowledge from human retina. The matching stage has the advantage of FREAK descriptor with course to fine pattern. Note that in recent decades, coarse to fine strategy is often applied in objects’ recognition and adaptation [18, 19].
Figure 4: Illustration of the coarse-to-fine analysis. The first cluster involves mainly perifoveal receptive fields and the last ones fovea [16]
(4) Figure 5: Illustration of the cascade approach [16]
In order to estimate rotation of the key points the estimated local gradients over selected pairs, Fig. 6 are summed up, like BRISK. This step applies long pairs to global orientation, while here the pairs with symmetric receptive fields are selected with respect to the centre.
Figure 6: Illustration of the pairs selected to computed the orientation [16]
For calculation purposes, assume G as a set of all pairs used for local gradient computation [16]:
where, M is the number of G pairs and is the 2D vector of the spatial coordinates of the receptive field center. Here, 45 pairs are chosen like [16] unlike hundreds of pairs in BRISK. In addition, the pattern of retina has a receptive field greater than BRISK in peripheral region, which allows more errors in orientation estimation; therefore the spore of orientation is discretised in much bigger steps to allow it to become 5 times smaller than memory load.
MATLAB implication
Simulation program is run in a computer with Intel core 2 Duo 2.40 GHz CPU, 3GB RAM and 1.3 Mega pixel camera capable of implementing this algorithm in personal objects in a moderate and low process power by showing the clear image. To begin with, the environment image is reflected by turning the camera on and setting resolution, contrast and other camera parameters and convert each frame to a single image. In the next step, the user is allowed to select the part of the image that contains the object of interest. The selected part is cropped and converted ingrey scale format together with the original image which is saved in another location, Fig. 7:
Figure 7: The main image and the selected region
Figure 8: Extracting the key points of the select region through FAST
Figure 9: Extracting the main image key points through FAST
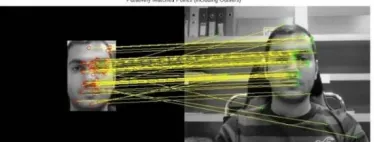
Through FREAK, the binary descriptor is built for each point, F, as explained in step one, and compared with one another. The process begins through searching the first 16 bits of FREAK descriptor, the large information. If the distance is smaller than a threshold, for analysis of finer information the comparisons continue more with the next bits until the points with the highest matching areas are found. More than 90% of the candidates are discarded through the first 16 bits of FREAK descriptor. The key points are compared in a pattern illustrated in Fig. 10, followed by illumination of extra points, Fig. 11.
Figure 10: Comparing the key points among the main image and the select section through FREAK
Figure 11: Discarding the extra extracted key points
After points’ matching process, the object’s new location is determined in the next frame, Fig. 12 where, by using the dimensions of the cropped image, a border line is drawn around the object, indicating the object’s new location.
With computing the value of the pixels inside the new border it is possible to determine the surface of the object, which is a symbol of object’s getting distanced or closer to the camera by getting smaller or bigger. The coordinates of the border’s centre is shown on the screen in order to give the user more information about the kind of the movement, as the final image as presented in Fig. 13.
Figure 13: The region state and illustration of centre coordinates
IV.EVALUATION
Here, the well-known data set presented by Mikolajczyk and Schmid [20] are applied. In this method, the descriptors are assessed for different scenes and real images through different geometric and photometric changes, Fig. (14). the six types of image changes are assessed here: rotation, Fig. (14 a and b); scale change, Fig. (14 c and d); viewpoint change, Fig. (14 e and f); blurriness, Fig. (14 g and h); JPEG, Fig. (14 i) and brightness change, Fig. (14 j). In rotation, scale change, viewpoint change and blurriness to different scenes are used: one is of structured scenes with homogenous regions and distinct edge boundaries (e.g. structures with painted walls) and repeated texture of different shapes. This setup allows the researcher to analyse the change effect on image and type of the scene in a separate manner. The image rotation is accomplished by rotating the camera around light access in a 30 and 45° range. The scale change and blurriness occur by changing the camera zoom and focus, respectively. The scale changes are within 2-2.5 range. The strings/shadows occur due to a change in the viewpoint, where the camera position is changed from a fronto-parallel changes into real visual line forms in smaller degrees of 50 to 60. Change in brightness is due to the changes of the camera lens opening. The JPEG is yield by a standard XV image reviewer with a 5% regulated image quality parameter. The image is either plan or the camera position is fixed during the shooting session.
MATLAB and personal laptop are applied in implementation of this program. A total of 4800 areas and 100 user selected areas in a 100x100 pixel in every image are used in determining the area of the select object in the image in order to extract and compare the key points. To assess and exhibit the functionality of this method the three parameters of: 1) the common compared points between the select region and the whole image, 2) the time spent to extract and compare the key points and 3) the accuracy and precision values are applied. To exhibit the accuracy percentage of all images, the correct matching to all matching ratio is applied.
V.RESULT AND DISCUSSION
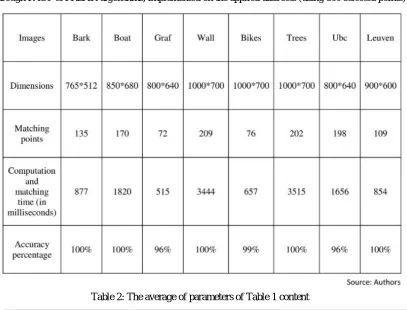
The functionality of detectors is mostly related to the identification/index combination. Some of these indexes have higher distinguishing capabilities with respect to disordered shapes as to the corners. The obtained results here are tabulated in Table 1 where, different image assessment with no change or conversion is observed. By assessing all the results in Table 2 an accuracy average of 99% is yield.
Table 1: The results of the number of matching points, computation and matching times and accuracy percentage, through FAST & FREAK algorithms, implemented on the applied data sets (using 800 selected points)
Table 2: The average of parameters of Table 1 content
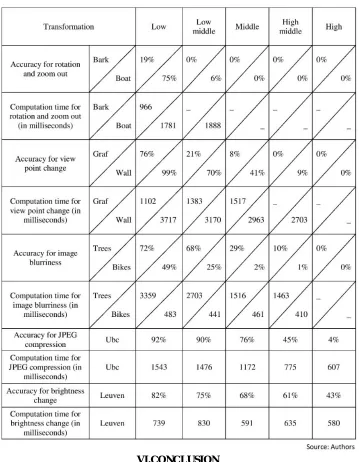
Table 3: Accuracy percentage and computation time subject to image transformation through FAST and FREAK (using 4000 selected points)
VI.CONCLUSION
FREAK, one of the latest methods introduced in this field, is applied in this study. In this algorithm the functionality of human eye is mimicked, allowing the accomplishment of tracking selected objects in real time system. FAST is applied to extract the corners followed by FREAK which is to compare the select object with high accuracy. Results indicate a 99% precision. This method has a significant resistance against changes in scene, brightness and JPEG computation, while like its counterparts it is still weak in frequent rotations, high scale change, and too many changes in viewpoint angles. These weaknesses can constitute specific themes for feature studies in this respect.
ACKNOWLEDGMENTS
REFERENCES
[1] Lowe, David G, “Object recognition from local scale-invariant features”, Computer vision, 1999. The proceedings of the seventh IEEE international conference on, Vol. 2, pp. 1150-1157, 1999.
[2] Ke, Yan and Sukthankar, Rahul, “PCA-SIFT: A more distinctive representation for local image descriptors”, Computer Vision and Pattern Recognition, 2004. CVPR 2004. Proceedings of the 2004 IEEE Computer Society Conference on, Vol. 2, pp. II-506-II-513, 2004.
[3] Se, Stephen, Ng, Ho-Kong, Jasiobedzki, Piotr and Moyung, Tai-Jing, “Vision based modeling and localization for planetary exploration rovers”, Proceedings of International Astronautical Congress, pp. 434-440, 2004.
[4] Grabner, Michael, Grabner, Helmut and Bischof, Horst, “Fast approximated SIFT”, Asian conference on computer vision, pp. 918-927, 2006. [5] Matas, Jiri, Chum, Ondrej, Urban, Martin and Pajdla, Tomás, “Robust wide-baseline stereo from maximally stable extremal regions”, Image
and vision computing, Vol. 22, Issue 10, pp. 761-767, 2004.
[6] Bay, Herbert, Tuytelaars, Tinne and Van Gool, Luc, “Surf: Speeded up robust features”, European conference on computer vision, pp. 404-417, 2006.
[7] Rosten, Edward and Drummond, Tom, “Machine learning for high-speed corner detection”, European conference on computer vision, pp. 430-443, 2006.
[8] Smith, Stephen M and Smith, Stephen M, “SUSAN—a new approach to low level image processing”, International journal of computer vision, Vol. 23, Issue 1, pp. 45-78, 1997.
[9] Calonder, Michael, Lepetit, Vincent, Strecha, Christoph and Fua, Pascal, “Brief: Binary robust independent elementary features”, European conference on computer vision, pp. 778-792, 2010.
[10] Tola, Engin, Lepetit, Vincent and Fua, Pascal, “Daisy: An efficient dense descriptor applied to wide-baseline stereo”, IEEE transactions on pattern analysis and machine intelligence, Vol. 32, Issue 5, pp. 815-830, 2010.
[11] Leutenegger, Stefan, Chli, Margarita and Siegwart, Roland Y, “BRISK: Binary robust invariant scalable keypoints”, 2011 International conference on computer vision, pp. 2548-2555, 2011.
[12] Rublee, Ethan, Rabaud, Vincent, Konolige, Kurt and Bradski, Gary, “ORB: An efficient alternative to SIFT or SURF”, 2011 International conference on computer vision, pp. 2564-2571, 2011.
[13] Song, Zijiang and Klette, Reinhard, “Robustness of point feature detection”, International Conference on Computer Analysis of Images and Patterns, pp. 91-99, 2013.
[14] Rosten, Edward, Porter, Reid and Drummond, Tom, “Faster and better: A machine learning approach to corner detection”, IEEE transactions on pattern analysis and machine intelligence, Vol. 32, Issue 1, pp. 105-119, 2010.
[15] Quinlan, J. Ross, “Induction of decision trees”, Machine learning, Vol. 1, Issue 1, pp. 81-106, 1986.
[16] Alahi, Alexandre, Ortiz, Raphael and Vandergheynst, Pierre, “Freak: Fast retina keypoint”, Computer vision and pattern recognition (CVPR), 2012 IEEE conference on, pp. 510-517, 2012.
[17] Olshausen, Bruno A and Field, David J, “What is the other 85% of V1 doing”, Problems in Systems Neuroscience, Vol. 4, Issue 5, pp. 182-211, 2004.
[18] Alahi, Alexandre, Vandergheynst, Pierre, Bierlaire, Michel and Kunt, Murat, “Cascade of descriptors to detect and track objects across any network of cameras”, Computer Vision and Image Understanding, Vol. 114, Issue 6, pp. 624-640, 2010.
[19] Fleuret, Francois and Geman, Donald, “Coarse-to-fine face detection”, International Journal of computer vision, Vol. 41, Issue 1-2, pp. 85-107, 2001.
[20] Mikolajczyk, Krystian and Schmid, Cordelia, “A performance evaluation of local descriptors”, IEEE transactions on pattern analysis and machine intelligence, Vol. 27, Issue 10, pp. 1615-1630, 2005.
BIOGRAPHY
Sevada Khachikian received the B.S. degree in Electrical Engineering (Electronics) in 2012, from ACECR Institute of Higher Education (Isfahan Branch), Isfahan, Iran. He is currently a student of M.S. degree in Electrical Engineering (Electronics) at the same Institute. His research interest in M.S. is onimage processing with the objective of expanding it on robotic fields. He has participated in several micro controller projects and robotic competitions. He is working on medical instruments of laser types and other cosmetic and beauty devices as a repair and maintenance supervisor in an importing company.
![Figure 2: Illustration of the distribution of ganglion cells over the retina. The density is clustered into four areas: (a) the foveola, (b) fovea, (c) parafoveal, and (d) perifoveal [16]](https://thumb-us.123doks.com/thumbv2/123dok_us/7775145.1281837/4.595.237.361.326.442/figure-illustration-distribution-ganglion-density-clustered-parafoveal-perifoveal.webp)
![Figure 4: Illustration of the coarse-to-fine analysis. The first cluster involves mainly perifoveal receptive fields and the last ones fovea [16]](https://thumb-us.123doks.com/thumbv2/123dok_us/7775145.1281837/5.595.218.386.403.556/figure-illustration-coarse-analysis-cluster-involves-perifoveal-receptive.webp)
![Figure 5: Illustration of the cascade approach [16]](https://thumb-us.123doks.com/thumbv2/123dok_us/7775145.1281837/6.595.235.376.639.733/figure-illustration-cascade-approach.webp)