www.euacademic.org DRJI Value: 5.9 (B+)
Functional outcome of stroke patients after two
weeks physiotherapy management at a selected
hospital
PARVIN SULTANA SHILPY
Physiotherapy specialist Ibn Sina Hospital, Dhanmondi, Dhaka, Bangladesh
Md. DELOWAR HOSSAIN CHOWDHURY1
PhD Researcher Bangladesh University of Professionals, Bangladesh Consultant & In-charge of Army Sports Physiotherapy Centre Army Sports Complex, Dhaka Cantonment, Bangladesh
RAJU AHMED Physiotherapy specialist Islamic Bank Central Hospital, Dhaka, Bangladesh
Abstract
Introduction: Stroke is the second leading cause of global death including Southeast Asia region.
Objective: To find out the functional outcome of stroke patients after two weeks physiotherapy management.
Materials and Methods: A hospital based cross-sectional study was conducted at IBN SINA hospital, Dhaka. Total 105 patients were recruited for this study followed by purposive sampling technique. Data was collected by using a structured questionnaire and functional independence measurement (FIM) scale followed by face to face interview and observation of the activities of the patients.
respondents shows that proportion were higher from urban area (53.30%) than rural area (46.70%). According to classification of stroke, 70% were under ischemic and 30% were hemorrhagic stroke. Majority (91.4%) of the respondents were attending 6 to 10 physiotherapy session. Functional outcomes of the patients were measured followed by different indicators. There was significant association between age of the stroke patients & functional outcomes with rolling affected side to unaffected side, rolling unaffected side to affected side, sit to supine and gait (P< 0.05).
Conclusion: After 2 weeks physiotherapy treatment the mean score was higher than initial mean scores of all functional outcome which indicate that more independent functioning.
Key words: Functional Outcome, Physiotherapy Management, Stroke.
INTRODUCTION:
stroke rehabilitation and prevention of complications associated with stroke. There were many research articles published about stroke rehabilitation for stroke but functional outcome after physiotherapy treatment is not so focused. The objective of this study is to find out the functional outcome of stroke patients after two weeks physiotherapy management at a selected hospital.
Objective: The objective of this study was to find out the functional outcome of stroke patients after two weeks physiotherapy management at a selected hospital.
Materials and Methods: Cross-sectional hospital based study was conducted to find out the functional outcome of stroke patients after two weeks physiotherapy management at a selected hospital. Hospitalized stroke patients were recruited as study population. This study was an academic part of the Masters course that’s why it had to finish according to academic calendar. However the study duration was from august 2017 to April 2018. Ibn Sina Hospital, Dhaka was selected as study place where stroke patient was admitted and received physiotherapy management. Ibn Sina Hospital is 312 bed modern Hospital. There are 150 beds for stroke patients among 312 beds in this hospital. Purposive sampling technique was followed to select 105 samples. Stroke patients who were admitted in Ibn Sina Hospital & age not more than 80 years were included in this study. Patients with duration of stroke more than 3 months & unconscious patients were excluded in this study. A pre-tested structured questionnaire was used as data collection instrument. Functional outcome was measured before and after treatment by Functional Independence Measure (FIM) scale. Data were processed and analyzed by using Statistical package of social science, version 20. P- Value less than 0.05 was considered significant.
Functional Independence measurement (FIM) scale was designed to provide a consistent data collection tool compared to the rehabilitation results in continued health care. In addition, an FIM attempts to establish a way to collectively rehabilitate information. Designers were designed to do FIM so that they could track the effectiveness of their patients through rehabilitation care and follow-up. FIM scale was an 18-item scale, measures the degree of independence in the stroke survivor on a 7-point scale (7-Complete Independence to 1-Total Assistance). According to this scale, higher scores were representing more independent functioning. The FIM is regularly measured first at admission to the rehabilitative care and then at discharge from the care.12
RESULTS:
Figure-1: Distribution of the respondents by their age
Figure-1 found that the minimum age of a participant was 32 year and maximum age was 79 year. The maximum numbers of patients (35/33.30%) were in age group 60-69 year and minimum numbers were in age group 30-39 years (5/4.8%).
Figure-2 showed that among the total respondents female were higher 54 (51.40%) than male 51 (48.60%).
Figure-3: Distribution of the respondents by BMI
Figure-3 revealed that majority of the respondents was in normal (75.20%) according to BMI classification. Very few respondents were in underweight (1.90%).
Figure 4: Distribution of the respondents according to their level of education
Figure-4 showed that about 31% of the respondents were under the category of below S.S.C level education whereas the second highest (25.7) level was graduated.
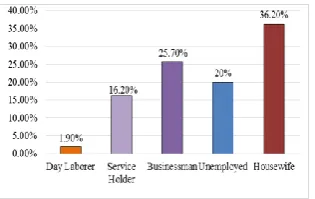
Study showed that among the total respondents 36.20%, 25,70%, 20% & 16.20% were housewives, Businessman, unemployed & service holder respectively and only about 2% were bay laborer (Figure 5).
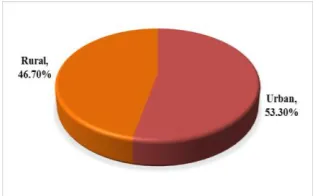
Figure 6: Distribution of the respondents by their residence
Study showed that the respondents were come from both urban and rural settings. More than fifty percent (53.30%) of the respondents were resided in urban area (Figure-6).
Table 1 showed that the respondents were attending different number of physiotherapy session. Majority of the respondents (91.4%) were attended 6 to 10 session.
Table 1: Distribution of the respondents by attending physiotherapy session
Physiotherapy Session Number Percentage
1-5 Session 4 3.8
6-10 Session 96 91.4
11-15 Session 5 4.8
mean score of sitting static balance on FIM scale was 2.59± 1 and after 2 weeks the mean score 4.86 ±1.18. Initial mean score of sitting dynamic balance on FIM scale was 2.06±.79 and after 2 weeks the mean score was 3.79 ±1.06. Initial mean score of standing static balance on FIM scale was 2.04±.73 and after 2 weeks the mean score was 3.78±.99. Initial mean score of standing dynamic balance on FIM scale was 1.71±.73 and after 2 weeks the mean score was 3.17± 1.04. Initial mean score of transfer from bed to chair on FIM scale was 2.11±.71 and after 2 weeks the mean score was 3.87±.98. Initial mean score of gait on FIM scale was 1.26±.51 and after 2 weeks the mean score was 2.66 ±1.01. After 2 weeks physiotherapy treatment the mean score was higher than initial mean scores of all functional outcome. According to FIM scale, higher scores were representing more independent functioning.
Table 2: Functional Outcome Related Information after 2 weeks physiotherapy management
Functional Outcome Initial After 2 Weeks
Mean score SD Mean score SD
Rolling affected Side to
Unaffected side 2.21 ±1.13 4.01 ±1.22 Rolling Unaffected side to
affected Side 2.91 ±1.30 4.86 ±1.21 Bridging 2.47 ±.98 4.53 ±1.20 Supine to sit 2.17 ±.89 4.10 ±1.16 Sit to supine 2.75 ±.97 4.89 ±1.15 Sitting static balance 2.59 ±1.00 4.86 ±1.18 Sitting dynamic balance 2.06 ±.79 3.79 ±1.06 Standing static balance 2.04 ±.73 3.78 ±.99 Standing dynamic balance 1.71 ±.73 3.17 ±1.04 Transfer bed to wheel chair 2.11 ±.71 3.87 ±.98
Gait 1.26 ±.51 2.66 ±1.01
Table 3: Distribution of the respondents by association between age and functional outcomes after 2 weeks Physiotherapy treatment
Functions P- value
Rolling affected Side to Unaffected side 0.05 Rolling Unaffected side to affected Side 0.01
Sit to supine 0.04
Gait 0.00
DISCUSSION:
(standard XI and higher) were 34%.20 This study found that among the participants 3.8% were received 1-5 sessions and 91.4% were received 6-10 sessions & 4.8 % were received 11-15 sessions. In UK, another study showed that among stroke patient received physiotherapy session on average 13.6 days.22 The average number of physiotherapy session was 1.5 per day and the average time was 38.1 minutes per session.22 This study revealed that initial mean score of rolling affected side to unaffected side on FIM scale was 2.21±1.13 and after 2 weeks physiotherapy treatment the mean score was 4.01± 1.22. Initial mean score of rolling unaffected side to affected side on FIM scale was 2.91 ±1.30 and after 2 weeks physiotherapy treatment the mean score was 4.86 ±1.21. Initial mean score of bridging on FIM scale was 2.47±.98 and after 2 weeks the mean score was 4.53± 1.20. Initial mean score of supine to sit on FIM scale was 2.17±.89 and after 2 weeks the mean score was 4.10± 1.16. Initial mean score of sit to supine on FIM scale was 2.75±.97 and after 2 weeks the mean score was 4.89 ±1.15. Initial mean score of sitting static balance on FIM scale was 2.59± 1 and after 2 weeks the mean score 4.86 ±1.18. Initial mean score of sitting dynamic balance on FIM scale was 2.06±.79 and after 2 weeks the mean score was 3.79 ±1.06. Initial mean score of standing static balance on FIM scale was 2.04±.73 and after 2 weeks the mean score was 3.78±.99. Initial mean score of standing dynamic balance on FIM scale was 1.71±.73 and after 2 weeks the mean score was 3.17± 1.04. Initial mean score of transfer from bed to chair on FIM scale was 2.11±.71 and after 2 weeks the mean score was 3.87±.98. Initial mean score of gait on FIM scale was 1.26±.51 and after 2 weeks the mean score was 2.66 ±1.01. After 2 weeks physiotherapy treatment the mean score was higher than initial mean scores of all functional outcome. This study revealed that there was significant association between age of the stroke patients & functional outcomes with rolling affected side to unaffected side, rolling unaffected side to affected side, sit to supine and gait (P< 0.05).
CONCLUSION:
study revealed that there was significant association among rolling affected side to unaffected side, rolling unaffected side to affected side, sit to supine and gait with the age of the stroke patients.
REFERENCES
1. Mathers CD, Loncar D. Projections of global mortality and burden of disease from 2002 to 2030. Plos med. 2006 Nov 28;3(11):e442.
2. World health statistics 2011. World Health Organisation.
Available at:
http://www.who.int/whosis/whostat/EN_WHS2011_Full.pdf; 2011 [accessed 30.03.12]
3. Zoghbi WA, Duncan T, Antman E, Barbosa M, Champagne B, Chen D, Gamra H, Harold JG, Josephson S, Komajda M, Logstrup S. Sustainable development goals and the future of cardiovascular health: a statement from the Global Cardiovascular Disease Taskforce. Journal of the American heart Association. 2014; 3(5).
4. Mendis S, Norrving B. Organizational update: World Health Organization. Stroke. 2014 Feb; 45(2):e22-3.
5. Aydin T, Taspinar O, Kepekci M, Keskin Y, Erten B, Gunel M, Gok M, Bektas E, Sarac M, Mutluer AS. Functional independence measure scores of patients with hemiplegia followed up at home and in university hospitals. Journal of physical therapy science. 2016;28(2):553-7.
6. Srivastava A, Taly AB, Gupta A, Murali T. Post-stroke depression: prevalence and relationship with disability in chronic stroke survivors. Annals of Indian Academy of Neurology. 2010 Apr;13(2):123.
7. Liu M, Wu B, Wang WZ, Lee LM, Zhang SH, Kong LZ. Stroke in China: epidemiology, prevention, and management strategies. The Lancet Neurology. 2007 May 1;6(5):456-64. 8. Stroke incidence and mortality rates found to be higher in
federation.org/press/press-releases/detail/article/stroke-
incidence-and-mortalityrates-found-to-be-higher-in-developing-than-in-developed-countries-fo/; 2010 [accessed 30.03.12]
9. Kim AS, Johnston SC. Global variation in the relative burden of stroke and ischemic heart disease. Circulation. 2011 Jul 19;124(3):314-23.
10. Norrving B, Kissela B. The global burden of stroke and need for a continuum of care. Neurology. 2013 Jan 15;80(3 Supplement 2):S5-12.
11. Islam MN, Moniruzzaman M, Khalil MI, Basri R, Alam MK, Loo KW, Gan SH. Burden of stroke in Bangladesh. International journal of stroke. 2013 Apr;8(3):211-3.
12. Madeleine Spencer DP, Newton RA. Ability of Functional Independence Measure to accurately predict functional outcome of stroke-specific population: systematic review. Journal of rehabilitation research and development. 2010;47(1-5):17.
13. Pradon D, Roche N, Enette L, Zory R. Relationship between lower limb muscle strength and 6-minute walk test performance in stroke patients. Journal of Rehabilitation Medicine. 2013 Jan 5;45(1):105-8.
14. Sousa CO, Barela JA, Prado-Medeiros CL, Salvini TF, Barela AM. Gait training with partial body weight support during overground walking for individuals with chronic stroke: a pilot study. Journal of neuroengineering and rehabilitation. 2011 Dec 1;8(1):48.
15. Flansbjer UB, Holmbäck AM, Downham D, Patten C, Lexell J. Reliability of gait performance tests in men and women with hemiparesis after stroke. Journal of rehabilitation medicine. 2005 Mar;37(2):75-82.
16. Hossain AM, Ahmed NU, Rahman M, Islam MR, Sadhya G, Fatema K. Analysis of sociodemographic and clinical factors associated with hospitalized stroke patients of Bangladesh. Faridpur Medical College Journal. 2011;6(1):19-23.
18. Nascimento LR, Caetano LC, Freitas DC, Morais TM, Polese JC, Teixeira-Salmela LF. Different instructions during the ten-meter walking test determined significant increases in maximum gait speed in individuals with chronic hemiparesis. Brazilian Journal of Physical Therapy. 2012 Apr;16(2):122-7. 19. Dev K, Joshi M. Functional outcome of stroke patients,
correlation with scandinavian stroke scale. Age Journal. 2013;40:13-9.
20. Das K, Mondal GP, Dutta AK, Mukherjee B, Mukherjee BB. Awareness of warning symptoms and risk factors of stroke in the general population and in survivors stroke. Journal of clinical neuroscience. 2007 Jan 1;14(1):12-6.
21. Chang WH, Shin YI, Lee SG, Oh GJ, Lim YS, Kim YH. Characteristics of inpatient care and rehabilitation for acute first-ever stroke patients. Yonsei medical journal. 2015 Jan 1;56(1):262-70