c
Owned by the authors, published by EDP Sciences, 2015
Transitioning a unidirectional composite computer model from
mesoscale to continuum
Sidney Chocron1,a, Ram´on Zaera2, James Walker1, Alon Brill3, Roman Kositski3, Doron Havazelet4, Ulrich Heisserer5,
and Harm van der Werff5
1Southwest Research Institute, San Antonio, TX, USA 2Universidad Carlos III de Madrid, Madrid, Spain 3Rafael, Haifa, Israel
4Ministry of Defense, Government of Israel 5DSM Dyneema, The Netherlands
Abstract. Ballistic impact on composites has been a challenging problem as seen in the abundant literature about the subject. Continuum models usually cannot properly predict deflection history on the back of the target while at the same time giving reasonable ballistic limits. According to the authors the main reason is that, while continuum models are very good at reproducing the elastic characteristics of the laminate, the models do not capture the behaviour of the “failed” material. A “failed” composite can still be very effective in stopping a projectile, because it can behave very similar to a dry woven fabric. The failure aspect is much easier to capture realistically with a mesoscale model. These models explicitly contain yarns and matrix allowing the matrix to fail while the yarns stay intact and continue to offer resistance to the projectile. This paper summarizes the work performed by the authors on the computationally expensive mesoscale models and, using them as benchmark computations, describes the first steps towards obtaining more computationally effective models that still keep the right physics of the impact.
1. Introduction
Composite materials have become essential in applications like aerospace, defense, and biomedical devices. Because of their intrinsic inhomogeneities and the fact that their properties depend on the direction in the material, it has been a challenge to understand how these materials deform under applied forces, in particular dynamic forces. The laminate theory is able to predict the properties of a laminate from the properties and orientation of the single laminae that form the composite. This theory has been very successful in predicting the elastic deformation of composite materials where no slip occurs between fibers. But once the laminate starts to slip, yield or fail the theory is not applicable and continuum computational models are not accurate enough for many applications like impact.
Southwest Research InstituteR
(SwRI) has been working for a few years on the behavior of these materials under ballistic impact. The studies performed seem to show that, because of the lack of good strength and failure models, it is (so far) not possible to generate a reasonably accurate first principles computational continuum model of the impact on a composite. By “reasonably accurate” we mean a model capable of predicting qualitatively delamination and failure patterns and quantitavely determine deflection and ballistic limit of various laminates impacted by different threats.
A pretty unique mesoscale yarn-level model was developed by SwRI during the last few years using a
aCorresponding author:[email protected]
commercial code (LS-DYNA), see [1]. The model was carefully built starting from impact on a single yarn and checking with experiments and theory that wave propagation and failure were being properly predicted by the computations. From these validated yarns, fabric layers were meshed to build a fabric system. The prediction of deflections vs. time and ballistic limits was shown to be very good for materials like KevlarR, DyneemaR, and PBOR
, although the size of panels was limited to squares 8 to 12 inches and a maximum number of layers around 30. These computations take 2 to 3 days in 24 cores when using SwRI’s computer cluster.
The logical next step was to add matrix to the yarn- level fabric computation to obtain the mesoscale model of a composite. This was done both for woven composites (Kevlar/Epoxy [2], S-2 glass/Epoxy) and for unidirectional systems (Polyethylene/Polyurethane) [3]. Again the models were able to predict qualitatively deformation and failure patterns, and quantitatively deflection and ballistic limits. Computation times with composites were even longer than with fabrics sometimes taking up to a week of computation on 16 to 24 cores in the cluster.
The focus of the last part of the project was to explore a continuum approach to the problem as well as different ways to speed-up the computations, for example using shell elements, while trying to keep the main physical phenomena in the computation. The mesoscale simulations were used as a benchmark or reference because it is thought that they contain the fundamental physics of the problems. The work is still in progress so this paper should
be considered only an initial exploration of the problem and, by no means, the final answer on how an UHMWPE composite should be simulated.
2. Materials
All the materials tested in this project were received from DSM-Dyneema through a joint-research project. All the materials (yarn, single layer composite and multi-layer composites) are based on the same fiber, SK76, for consistency.
2.1. Filament and yarns
Although no testing or impact simulation is performed at the fiber level, the properties of the fibers are what makes UHMWPE an outstanding material. The following properties were provided by Van der Werff (personal communication): modulus of 1350 cN/Tex (132 GPa), strength of 38.4 cN/dtex (3.8 GPa), linear density of 2 dtex (0.0002 g/m), strain to failure of 3.5%, diameter 16.1µm, density of 980 kg/m3, which provide a sound speed of
11.6 km/s. These come from single filament tests at a speed of 25 mm/min in specimen with a 50 mm gage length and agree with properties found elsewhere in the literature.
2.2. Single layers
Single layers of HB80 were also provided by DSM Dyneema with an approximate size of 20 in×20 in. These are SK76 yarns in a polyurethane matrix. The single layers consist of 4 “plies” with [0/90]2 fiber orientation. Each
“ply” actually has approximately 2.5 filaments through the thickness. The HB80 single layer (i.e. four plies) has an areal density of 0.145 kg/m2.
The matrix material is polyurethane, which represents a 17% matrix content by weight for the composite. The reader is encouraged to refer to [3] for a thorough description of the architecture.
2.3. HB80 laminates
Laminates were manufactured by DSM Dyneema in Greenville, North Carolina, USA from the single layers described in the previous section. Nominal thicknesses were 6.1 mm, 11.7 mm, and 23 mm, with, respectively, 37, 74, and 149 layers. Material tests were performed on specimens cut from the 11.7 mm panels. Panels labeled as A were hot-pressed at 20.7 MPa while panels labeled as B were hot-pressed at 27.6 MPa.
3. Material tests performed
The material tests performed focused on delamination properties of the laminate because the tensile properties of the composite are well characterized from the work by Heisserer [4]. The material tests consisted of: lap shear, torsion, and in-plane and out-of-plane compression tests. The lap-shear and compression tests were performed at atmospheric and high (500 MPa) confinement pressures and were presented in [3]. Characterization of the material at high pressures is thought to be essential as the projectile
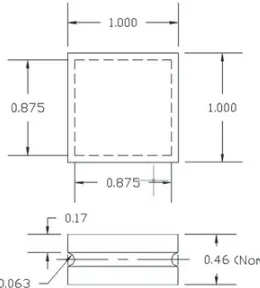
Figure 1. Drawing of the torsion specimens (dimensions in inches).
Figure 2.Torque curves for the torsion specimens.
penetrating the laminate is exerting high pressure through the thickness. Only the torsion results are reported in this paper. These provide a shear strength than can later be used in the numerical models.
Figure 1 shows the torsion specimens. A torque is applied on the top and bottom of the specimen which fails in shear in the center of the notch. The torque applied is in the z-direction, i.e. perpendicular to the plane of the laminate. These tests should provide similar information to the lap-shear tests and can be used as an independent validation. The angular velocity of the piston during the test was 4.25×10⁻³rad/s.
The torsion tests show that curing pressure does not affect the delamination stress. Figure2 shows the torque curves obtained for A and B specimens as a function of the rotation of the head. The rotation was corrected for compliance by performing a test on a steel specimen. This allows estimating the shear modulus and strength in shear. From elasticity theory (see, for example, Timo-shenko [5]), it is possible to estimate the slope expected in Fig.2. The torque T , shear modulus G, angle turned per meterθ, and side length 2a are related by:
xz
σ
x
z
r
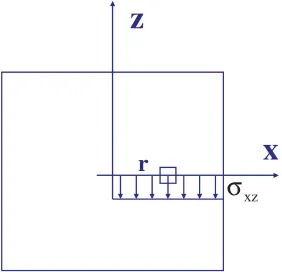
Figure 3.Stresses on gage section of the torsion specimen.
modulus E and Poisson ratioνby:
G=E/(2(1+ν))=25 MPa. (2) The gage length of the gage section was l=3.2 mm (twice the radius of the gage section 2×0.063 in=0.126 in= 3.2 mm) and was used to calculate the angle turned per unit of length. Note that “rotation” in Fig.2is an absolute rotation while θ in Eq. (1) is rotation per meter; i.e., if the absolute rotation is φ then θ =φ/l. The gage section is not uniform so l is only an approximate number. With the semi-width of the specimen being a=11.1 mm, the theoretical slope of the torque versus rotation line is 266.8 Nm/rad (shown as “Timoshenko” line in Fig.2).
The maximum shear stress in the cross section is given by (see again Timoshenko)
τmax =1.351 Gθmaxa. (3)
Whereθmax is the rotation angle per unit of length when
the maximum torque happens, i.e., according to Fig. 2 when the rotation of the piston is 2.5 degs or 3.5e-2 rad. Soτmax=4.1 MPa on the cross section when failure
happens.
An alternative way to estimate the torque is by using plasticity theory. Assuming the whole gage section is flowing plastically when yielding during the test it is straightforward to estimate the torque analytically. In view of Fig.2 this assumption might not be actually realistic since the behavior of the specimen is more brittle than ductile, i.e. the torque reaches a maximum and then fails suddenly instead of staying at a plateau for a long time. Nevertheless it is thought it is an interesting exercise to find the estimated strength from plasticity theory.
Figure3shows the stresses on the gage section of the specimen for pure torsion. Only shear stresses are applied during this test and the figure shows, specifically, the stress on the x-axis. Note that for this derivation x and z axes are in-plane while y-axis is out-of-plane, i.e. through the thickness of the laminate. Since the assumption is that the whole section is yielding then the equivalent stress at any point in the section is equal to the yield stress Y (for a Von Mises flow surface):
σeq =
3(σ2
x z+σyz2)=Y →σx z= Y √
3· (4)
Since there is 1/8 symmetry on the cross section we can calculate the torque needed on 1/8 of the section and multiply by 8:
T =8
θ=π/4
θ=0
r=a/cosθ
r=0
r√Y
3r dr dθ = 8Y
3√3
π/4
0
a3
cos3θdθ =1.77 Y a 3.
(5)
So, for a measured torque of approximately 8.5 Nm we have Y =T/(1.77a3)=3.5 MPa. This impliesσx z =
2.0 MPa.
The shear strength derived from elastic theory and plasticity are quite different (4.1 MPa vs. 2.0 MPa). The fact that lap-shear test also provides a shear strength of approximately 2.0 MPa might just be a coincidence since the authors think that it can be hardly justified that the whole section is yielding before failure. It is more likely that the torsion test is providing a larger shear strength because of some unintended out-of-plane compression (possibly warping) force or other artifact of the test. This could be better understood by performing detailed numerical simulations.
4. Summary of mesoscale model and
results
The mesoscale model was carefully validated in a way similar to the one described in [1] for woven fabrics. The main point of the validation is making sure that both wave propagation in the material and failure of the fibers are properly captured.
4.1. Numerical model of the strip
The first step to create the UD model was to reproduce the ballistic impact results presented in Chocron et al. [6] for single-layer/single-ply and for single-layer/three-plies (90/0/90, where the 0 direction is on the length direction of the strip.)
The fibers in the real material have a diameter of 17µm and, for numerical purposes, were bundled into strips 2-mm wide. This would correspond to approximately bundling 300 fibers in a single solid element.
The bundle is only one solid element through the thickness so it does not have any bending stiffness, as expected from a bundle of fibers. The thickness of this element is the same than the thickness of the single Dyneema HB80 UD layers: 38.59µm. The element is orthotropic with the stiff direction in the same direction than the UD fibers and the elastic and failure properties used are the ones found in the literature, as reported in the materials section.
The polyurethane matrix material was placed side by side with the fibers “bundle” to account for the “dead weight” and cohesion between the fibers. This is only a rough approximation to the real material where the matrix is homogenously distributed among the fibers. The resin was assumed to be a homogenous isotropic material with a density of 0.97 g/cm3 and elastic perfectly plastic
3.5 MPa, and failure at an effective plastic strain of 10%). Transverse impact simulations on the strip were performed at different velocities to check the strain, the transverse wave velocity, and the critical velocity (impact velocity that fails immediately the fibers). These were compared to the predictions from theory and the tests performed in [6]. The results were very satisfactory as shown in [3].
4.2. Numerical model of the single layer
The same strips were used to form a single layer (4 plies, i.e. [0/90]2) of size 30 cm×30 cm. This single layer model
has ∼260,000 nodes (131,000 solid elements) with the same thickness than the real material (4×38.59µm). The areal density of the numerical layer obtained was 150 g/m2,
very close to the 145 g/ m2of the real material.
The layer to layer interaction, i.e. matrix between layers, was described by a very simplistic “tiebreak” contact model available in the LS-DYNA code. This model destroys the bond between the layers when a combination of normal and shear stresses reaches a threshold. The normal stress to failure selected was 1 GPa and the shear stress 10 MPa. These numbers on their own might seem completely unrealistic but, the shear and delamination tests under high pressure confinement provide similar numbers [3].
The numbers used in the numerical simulation are, of course, a very rough approximation of the complex process that is happening during impact. Right below the projectile the pressures are enormous, certainly higher than 500 MPa, so the strength of the material is probably very large. Far from the projectile the pressures seen by the polyethylene are much smaller, i.e. the strength of the matrix is probably the one measured in atmospheric conditions. Additionally, the out-of-plane strength in tension and compression are probably very different. Unfortunately the code used does not allow right now such a complex behavior for contact between layers so a crude average strength needs to be used for the simulations.
Transverse wave speeds measured in [6] agree reasonably well with the ones measured in the numerical simulations for single layers.
4.3. Numerical model of the multiple-layer targets
Targets for numerical simulations were produced using the same mesh geometry presented in the single-layer section. In real targets the number of layers is very large, for example, see the materials section, a 6-mm-thick target has 37 layers or 37×4=148 plies.
Depending on the thickness of the laminate, the number of plies and, consequently, the computation time, can be enormous. The plies were consolidated by a factor of four, i.e. the consolidated ply was four times thicker than the original one. The effect on the computation was a significant speed-up while the results were not greatly affected [3].
Figure4shows an example of the impact of a fragment on a laminate. The mesoscale model allows capturing realistically the following features: 1) the fibers are being pulled towards the impact point, 2) the fibers from the
Figure 4.Example of a laminate impacted by a fragment. Note the delamination on the sides of the target.
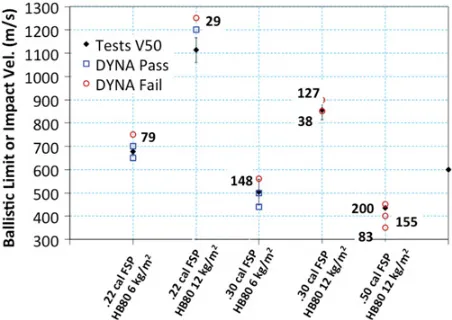
Figure 5.Comparison of the experimental ballistic limits (black diamond) with the numerical results (open squares for stops and open circles for target failure).
first layers impacted are pulled less than the ones in the last layers because they fail faster, 3) this creates a characteristic delamination pattern on the edges that is similar to the one observed in the real targets.
Unfortunately, when comparing the transverse wave (i.e. the pyramid) from the tests and the simulations for thick laminates, it was found that the numerical model is “stiffer”, i.e. the transverse wave in the full laminate does not propagate as fast as in the test. This is probably due to the very simplistic layer-to-layer contact condition.
Nevertheless the model was able to predict well the ballistic limits. Figure 5 compares the experimental and numerical ballistic limits for two different targets (Dyneema HB80, 6 and 12 kg/m2, respectively, 6.1 and
11.7 mm thick) and three fragment sizes: 0.22 inch, 0.30 inch, and 0.5 inch caliber. The black diamond shows the experimental ballistic limit (usually a 4-shot V50) with error bars. The open squares represent computations with LS-DYNA where the projectile stopped. The open circles are also computations where the projectile went through the target. The number next to the open circles is the residual velocity of the projectile after going through the target.
The figure shows that the numerical prediction for the 6 kg/m2 targets is very good. The model slightly overpredicted for the .22 cal FSP vs. the 12 kg/m2. For the
not stop in the computations but the residual velocities, as shown in the figure, were small enough.
5. Effort with membrane elements
During the second part of this effort, the objective was to obtain results similar to the mesoscale model with considerably less computational effort. Also, a simple material description like the one used in the mesoscale model is desirable. The key of this new model has been using two-dimensional plane stress finite elements (membrane), instead of the 3D brick elements, to represent the laminate plies. Compared to the brick elements, the potential advantages of using two-dimensional elements are: i) reduced number of nodes, ii) larger characteristic dimension, resulting in a larger critical (stable) time increment, iii) only two contact surfaces instead of six in the brick element, decreasing the burden of tracking the contact surfaces.
The commercial finite element code ABAQUS/Explicit was selected for this approach. The 4-node membrane element with reduced integration (M3D4R in ABAQUS notation) was found to be stable even at large displace-ments. The orthotropic elastic model with failure condition based on maximum stress was implemented in the user subroutine VFABRIC, specific for plane stress elements, thus replicating the constitutive behavior assumed in the mesoscale model.
The matrix adhesion and ulterior delamination between each pair of plies i and i+1 was reproduced through a cohesive interaction. The nominal traction stress vector across the contact consists of three components that represent the normal tn, and the two shear tractions tsand tt. The corresponding separations are denoted by δn, δs
and δt. The tensile behavior, valid for tn>0, is driven
by a linear law relating each stress with the corresponding separation; according to Utomo [7], the same values for the three stiffnesses have been adopted tj =K·δj, all of them
equal to the unconfined compressive out-of plane stiffness of the laminate K =E3=4.3 GPa. Failure of the
layer-to-layer interaction consists of two parts: a damage initiation criterion and a damage evolution law. For initiation, a quadratic stress criterion has been considered. On the other side, the damage evolution law describes the rate at which the cohesive stiffness is degraded once the corresponding initiation criterion is reached. In our case, a brittle failure was considered by setting to zero the energy dissipated as a result of the damage process.
Regarding the compressive behavior, ABAQUS/Explicit offers the possibility of using a pressure-overclosure relation through a user-defined curve, which was formerly identified as a key feature in order to avoid a large out-of-plane compressibility of the laminate due to low penalty stiffness in the contact between plies. This curve has been defined considering a state of uniaxial-strain deformation, which is deemed to be representative of the strong confinement developed in the region directly affected by impact, and elastic behavior. A non-linear (logarithmic) measure of the deformation has been adopted. Leading to an asymptotic increase of pressure as the overclosure between plies approaches the ply thickness. Additionally, a Coulomb frictional behavior was considered, with a low
Figure 6. Normal impact of a .30 cal FSP against 148-plies laminate at 400 m/s. Top: interply damage contours at 32µs. Bottom: detail at the mid-point of one of the edges of the laminate at 70µs.
value of the friction coefficient µ=0.02, according to Chocron et al. [2]. The compressive contact condition is stated for the interaction between each ply i and all the subsequent i +1, i +2,. . . , N ; N being the total number of plies in the laminate.
The cohesive forces drop to zero once the failure (delamination) criterion is satisfied. If the surfaces are in contact again after failure of the cohesive bond, penetrations will give rise to compressive contact stresses following the above mentioned pressure-overclosure law, but not further cohesive constraints are enforced.
Figure 6 (top) shows the damage produced by the impact of a .30 cal FSP at 400 m/s on the laminate. Damage in this context means that the matrix between the layers has failed, i.e. the red indicates zones that are delaminated. As expected the principal yarns (the ones directly under the projectile) are the ones that delaminate first during the impact. Additionally, the model predicts an extensive delamination of the upper half of the target, an effect that is also observed experimentally. This constitutes an evidence of the suitability of the approach to capture the interaction between the different plies in the laminate upon impact.
0 100 200 300 400 500 600
0 20 40 60 80 100 120 Membrane element model
Mesoscale model
pro
jec
tile v
eloc
ity (
m
/s
)
time (µs)
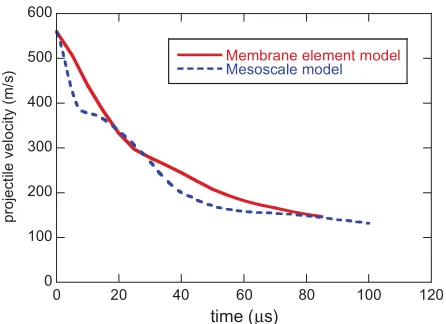
Figure 7.Comparison of the projectile velocity history for the membrane model and the mesoscale model. Normal impact of a .30 cal FSP against 148-plies laminate at 599 m/s.
layer. The membrane model takes approximately ten times less computation time than the mesoscale models.
6. Brief comment on the continuum
description
A limited part of the effort was dedicated to computations with the whole panel being an orthotropic continuum. Interestingly, by choosing the in-plane elastic moduli the same than the modulus of the fiber, it was possible to reproduce the strain expected from the theory for a single layer. Also, it was possible to qualitatively reproduce some of the features like fiber pulling in the cross fibers under the projectile impact for thicker laminates.
By tuning the shear moduli for the 6.1-mm-thick target, it was possible to find moduli that matched the history of the velocity of the projectile for different impact velocities, in a similar fashion to what is shown in Fig.7. The velocity of the projectile going through the laminate is extremely sensitive to the shear moduli, i.e., a small change in the moduli produced a large effect in the velocity history.
Unfortunately the moduli values that worked for the thin 6.1-mm laminate did not work for thicker laminates. The authors believe that the reason is that damage happens very fast to the first few layers impacted decreasing the shear modulus dramatically, probably close to zero. But the layers that are not damaged still provide significant stiffness to the laminate. This stiffness degradation is still not being captured by the models implemented and is the subject of future work on impact in composites.
7. Conclusions
A mesoscale computational model was described for unidirectional composites. The model is very successful at reproducing delamination and yarn pull as observed in the experiments. It also predicts properly ballistic limits for the limited set of tests performed. But mesoscale models take 1 to 7 days of computation time, depending on the projectile, and the size and thickness of the target.
To decrease the computation time a numerical model based on a 2D membrane element has been developed. The model has been validated in a very limited way by comparing it to the mesoscale model. It looks promising but is still work in progress. A continuum model has also been explored. From this preliminary exploration it looks like the model will need to degrade the shear elastic moduli to produce realistic results.
References
[1] S. Chocron, E. Figueroa, N. King, T. Kirchdoerfer, A. Nicholls, E. Sagebiel, C. Weiss, and C. Freitas, “Modeling and validation of full fabric targets under ballistic impact,” Composites Science and
Technology, vol.70, no. 13, pp. 2012–2022, 2010. [2] S. Chocron, A. Carpenter, Z. Asaf, and L. Levin,
“Impact simulations of kevlarR composite at the yarn level,” in Proceedings of the 28th International
Symposium on Ballistics, Atlanta, Georgia, USA, 22– 26 September, 2014.
[3] S. Chocron, A.E. Nicholls, A. Brill, A. Malka, T. Namir, D. Havazelet, H. van der Werff, U. Heisserer, and J.D. Walker, “Modeling unidirectional composites by bundling fibers into strips with experimental determination of shear and com-pression properties at high pressures,” Composites
Science and Technology, vol. 101, no. 0, pp. 32– 40, 2014. Online June 25, http://dx.doi.org/ 10.1016/j.compscitech.2014.06.016.
[4] U. Heisserer, “Tensile properties of Dyneema HB plies (HB2, HB26, HB50, HB80),” tech. rep., DSM-Dyneema, 2011.
[5] S. Timoshenko and J.N. Goodier, Theory of
Elasticity. New York: Mc.Graw-Hill, 1951.
[6] S. Chocron, N. King, R. Bigger, J. Walker, U. Heisserer, and H. van der Werff, “Impacts and waves in DyneemaR HB80 strips and laminates,” J.
Appl. Mech., vol.80, no. 3, pp. 031806–10, 2013. [7] B.D. Heru-Utomo, High-speed Impact Modeling
and Testing of Dyneema Composite. PhD thesis,