A Monthly Double-Blind Peer Reviewed Refereed Open Access International e-Journal - Included in the International Serial Directories International Journal in Management and Social Science
http://www.ijmr.net.in email id- irjmss@gmail.com Page 342 IMPACT OF AMENDED APMC ACT ON APPLE MARKETING IN
HIMACHAL PRADESH
Dr. Mustfa Hussain* Designation- Teaching Personnel
College of Agribusiness Management, Pantnagar
Dr. Ashutosh Singh** Designation- Professor and Head
College of Agribusiness Management, Pantnagar
ABSTRACT
The major bottleneck of Agricultural Produce Marketing Committees (APMCs) is that agri-transactions are confined to only regulated market yards. However amended APMC act prevents anticompetitive practices.There is no compulsion on the producer to sell their produce in APMC market yards, producer are quite free to sell directly to private companies or private market yards or farmers-consumer market. An endeavor was made to analyse the impact of amended APMC act on apple business in Himachal Pradesh. Study has covered two districts of Himachal Pradesh viz. Shimla and Kullu. Purposive, random and snow ball sampling were adopted to arrive at various units of analysis. Many aspects of marketing have been analysed in a very proper way. Total 88 apple growers were selected. These apple growers were further categorized in to two Groups viz. Group 1 (58 growers who follow traditional supply chain) and Group 2 (30 growers who follow traditional and modern/ modern supply chain both). It was found that marketing efficiency of Adani and Apni Mandi (Channel E) is highest by Shepherd’s formula and Acharya’s formula respectively.
Key Words- amended APMC act, modern supply chain, marketing efficiency, post harvest management traditional APMC act and temperate fruits.
INTRODUCTION
A Monthly Double-Blind Peer Reviewed Refereed Open Access International e-Journal - Included in the International Serial Directories International Journal in Management and Social Science
http://www.ijmr.net.in email id- irjmss@gmail.com Page 343
The present study is focusing on marketing practices of apple growers of major apple producing state where APMC Act has been amended. There are three apple producing states viz. Jammu & Kashmir, Himachal Pradesh and Uttarakhand, later two have the amended APMC Act but Himachal Pradesh has higher (8.92 Lakh MT) apple production than Uttarakhand (1.35 Lakh MT) in 2011 (NHB). Private players viz. Adani Agri fresh, Mother Dairy, Concor, Reliance, Godrej etc. are procuring apple directly from primary producers and comparatively paying better price to them. Thus HP state was purposively selected for present study.
PROBLEM STATEMENT
The single the most problem facing by the apple industry of HP is inefficient supply chain constituted with numbers of middlemen. One box of apple is passed through many hands and after each intermediary cost is increased unnecessarily which ultimately decreases producer‟s share in consumer rupee. However amended APMC Act has opened new gates in front of HP apple growers. Growers can now sale to private market yards, retail outlets and private market yards and receive better price than regulated market yards. It was experienced that grower‟s share varies between 50- 70 paisa in consumer rupee in traditional chain while after APMC Act amendments as private player are allowed to procure apple from producers directly, producer shares has been increased up to 90 paisa and more (Singh 2009). Various Private and Government undertaking companies viz. Reliance Fresh, Godrej, Adani Agri Fresh, Mother Dairy, Fresh and Healthy etc. procure apple directly from producers and offer healthy prices to primary producers but still many apple growers do not sale to private buyers. They have good contacts with APMC traders and supplying apply to them. Though growers are exploited at great extent by traders and wholesalers and this intervention of intermediaries reduce the producer‟s share in consumer rupee (Pandey 2013). Thus an attempt has been made to assess the overall impact of amended APMC Act on various aspects of apple marketing in Himachal Pradesh.
OBJECTIVES OF THE STUDY
The present was proceeded with following objectives:
To identify marketing channels followed by apple growers in HP.
To analyse the impact of amended APMC Act on marketing practices.
To evaluate the efficiency of traditional and modern apple supply chain.
REVIEW OF LITERATURES
Singh et al (2009) have showed in their paper “Supply Chain Management and Indian Fresh
Produce Supply Chain: Opportunities and Challenges” that Adani Fresh but Adani buy only „A‟ grade apple with certain specifications. Study has compared the net price received by producer and price spread across the traditional and modern supply chain. It is assumed that the sell price is Rs. 100 in both supply chain then on an average, at Azadpur mandi, net price received by grower is Rs. 57.4 while this figure is Rs. 97.8 with Adani fresh.
Rauf et al (2011) have showed in their study “Economics of Production and Marketing of Apple
A Monthly Double-Blind Peer Reviewed Refereed Open Access International e-Journal - Included in the International Serial Directories International Journal in Management and Social Science
http://www.ijmr.net.in email id- irjmss@gmail.com Page 344
box in HP and Rs. 239 in J&K. Orchardists had to paid the highest marketing cost for Delhi in cooperative channel in HP and J&K. Producers had to paid relatively higher cost in Delhi market due to commission of commission agents but in Bangalore cost is high because of high transportation cost from both states.
Pandey et al (2009) have showed in their study “ICT System for Increasing Efficiency of Apple-Value Chain” that India produces about 8 percent of the world‟s fruit and about 15 percent of the world‟s production of vegetables but looses 25 to 40 percent of the fruits produced due to lack of post harvesting infrastructure such as cold chains, transportation, storage and processing facilities. In round figure, India wastes fruits and vegetables every year equivalent to the annual consumption of the United Kingdom.
RESEARCH METHODOLOGY
Descriptive research design was adopted for accumulating the information about different aspects of respondents viz. apple growers, wholesalers and retailers etc. Secondary data was collected from concerned web sites, books, journals, concerned departments etc. while primary data was collected from apple growers and different marketing intermediaries involved in apple marketing. Districts Shimla and Kullu have highest apple production in the state, which are together contributing 88.99 percent of the entire apple production of the state. Thus districts Shimla and Kullu were purposively selected. Same methodology was adopted to select blocks Jubbal-Kotkhai and Rohru from district Shimla and blocks Kullu and Nagar from district Kullu. In next step, eight villages were selected randomly. Further apple growers were categorized in to two groups:
Group1- Growers who follow traditional supply chain and
Group2 -Growers who follow the traditional as well as modern supply chain.
Table1. Distribution of Apple Growers
Fifteen percent growers from both the groups were selected by adopting simple random sampling and survey was conducted. Therefore 58 apple growers were belonging to group1 while 30 apple growers have formed group2. One APMC market yard from each district yard having highest
Districts Blocks Name of Villages
Growers who Follow
Traditional Supply Chain (Group1)
Growers who Follow Traditional as well as Modern Supply Chain (Group2)
Block wise Apple Growers
Shimla Jubbal- Kotkhai
Kiari 3 1 19
Jashla 5 2
Rohru Bhalara 5 4 23
Bijory 4 2
Kullu Kullu Nagabag 7 6 22
Bandrol 4 0
Nagar Puid 6 2 24
Raison 6 2
A Monthly Double-Blind Peer Reviewed Refereed Open Access International e-Journal - Included in the International Serial Directories International Journal in Management and Social Science
http://www.ijmr.net.in email id- irjmss@gmail.com Page 345
arrivals (i.e. Bhattakoofer from Shimla and Bandrol from Kullu) was purposively chosen for study. 10 wholesalers from APMC market yard Bhattakoofer (Shimla) and 10 wholesalers from APMC market yard Bandrol (Kullu) were selected. 10 apple retailers from Bada Shimla city and 10 apple retailers from Kullu city were randomly selected. Apart from this, 10 retailers who follow modern supply chain and channelizing apple of concerned companies were selected by adopting snow ball sampling technique. Three companies viz. Adani Agri Fresh, Mother Dairy and Fresh and Healthy (Concor) were identified which procure apple directly from respondents. The well structured undisguised questionnaires were designed for taking in-depth interviews of respondents.
Formulas Used
Following formulas were adopted for analyzing the traditional and modern supply chain of applein study area.
a)Marketing Margins
Following formula was adopted to analyse the marketing margins.
)
(
p cimi
mi
P
P
M
A
Where,Ami : The Absolute Margins of the ith Middleman Pmi : The Selling Price of the ith Middleman Pp : Purchasing Price
Mci : Marketing Cost of the ith Middleman
ii)Marketing Cost
This cost limits the income of producer and affect the cost of living of consumers. Following formula was adopted to determine the marketing cost.
Mci
C
T
c
p
Where,
Tc : Total Cost of Apple Marketing Cp : Cost Borne by Producer
Mci : Marketing Cost Increased by ith middleman
iii) Marketing Efficiency
Shepherd‟s formula and Acharya‟s formula was used for measuring the marketing efficiency of traditional as well as modern supply chain.
Shepherd‟s Formula Acharya‟s Formula
ME= 𝐕𝐈 − 𝟏 MME = 𝐌𝐂+𝐌𝐌𝐆𝐏
Where,
ME = Marketing Efficiency MME = Modified Measure of Marketing Efficiency
V = Value of Goods (Consumer Price) GP = Net Price received by Grower
I = Total Marketing Cost MC = Total Marketing Cost
A Monthly Double-Blind Peer Reviewed Refereed Open Access International e-Journal - Included in the International Serial Directories International Journal in Management and Social Science
http://www.ijmr.net.in email id- irjmss@gmail.com Page 346
RESULT AND DISCUSSIONS
Following heads are presenting the results and discussions of study. i. Identification of Marketing Channels
Following channels were identified in the study area, which have been adopted by respondents in both groups.
Channel A. Grower Forwarding Agent Commission Agent Wholesaler Retailer Consumer
Channel B. Grower Commission Agent Wholesaler Retailer Consumer
Channel C. Grower Pre Harvest Contractor Wholesaler Retailer Consumer
Channel D. Grower Processing unit Consumer
Channel E. Grower Consumer
Wholesaler Retailer Consumer
Channel F. Grower Company
Consumer
Above six channels were identified which were adopted by respondents in Group 1 and Group 2. It was analysed that channel A, B, C and D were adopted by respondents in Group 1 while all marketing channels (except channel C) were adopted by respondents in Group 2.
ii (a) Marketing cost and net return for respondents in Group 1 Channel A
Table 2 depicts that respondents have received Rs. 31.32 in Delhi market followed by Rs.30.1 in Chandigarh market and Rs. 25.43 in HP for 1 kg apple. Though grower‟s net return is highest in Chandigarh market which is qualified to Rs. 22.5 followed by Rs. 21.01 in Delhi Market and Rs. 18.56 in HP. Grower have to face extra cost as commission of commission agent and market fee in Delhi market, but this cost is faced only by wholesalers in HP and Chandigarh market yards. Table further shows from the table that total marketing cost for 1 kg apple is highest for Delhi (Rs.10.31) and lowest (Rs. 6.87) for APMC yards of HP.
Channel B
Table 2 shows that grower received Rs.32.88 in Delhi market followed by Rs. 29.58 in Chandigarh market and Rs. 24.75 in HP for 1kg apple. It was analysed that grower‟s net return is Rs. 23.59 in Delhi followed by Rs. 21.91 in Chandigarh and Rs.19.18 in HP. Growers who sold apple to Delhi have faced Rs. 2.75 as extra cost because commission of commission agent and market fee is paid by growers while this cost is faced by wholesalers in Chandigarh and APMC yards of HP. Table further shows from the table that total marketing cost for 1 kg apple is highest for Delhi (Rs.9.29) and lowest (Rs. 5.57) for APMC yards of HP.
Channel C
Table 2 reveals that apple growers do not incur any marketing cost under channel C, as produce is sold to pre harvest contractors who bear all marketing cost themselves. The average price growers receive under this channel is Rs. 22.65.
Channel D
A Monthly Double-Blind Peer Reviewed Refereed Open Access International e-Journal - Included in the International Serial Directories International Journal in Management and Social Science
http://www.ijmr.net.in email id- irjmss@gmail.com Page 347
Table 2: Marketing Cost and Net Return under Different Marketing Channels for Group 1 N=58
Particulars Channels Followed by Sampled Apple Growers (Group 1)
Ch. A (Through F. Agents) Ch. B (Directly to Commission Agent of APMC)
Ch. C (Pre Harvest Contractors)
Ch. D (HPMC)
Delhi Chandigarh HP Delhi Chandigarh HP
Rs/kg Rs/kg Rs/kg Rs/kg Rs/kg Rs/kg Rs/kg Rs/kg
A. Price received by Growers at APMC
31.32 30.10 25.43 32.88 29.58 24.75 22.65 5.25
A. Labor Cost
1. Picking, Assembling, 0.28 0.24 0.30 0.33 0.22 0.35 - 0.28 2. Grading 0.48 0.47 0.34 0.46 0.46 0.45 - 0.45 3. Packing 0.14 0.14 0.17 0.11 0.13 0.14 - 0.11 4.1 Loading 0.14 0.11 0.12 0.08 0.09 0.11 - 0.17 4.2 Unloading 0.15 0.13 0.14 0.16 0.18 0.14 - 0.19 5. Carriage to Road Head 0.20 0.29 0.31 0.30 0.35 0.25 - 0.25
C. Market Costs
1.Packaging Material Cost 3.00 2.86 2.80 3.00 2.90 2.95 - 0.46 2. Labeling , Stenciling etc. 0.07 0.07 0.07 0.07 0.07 0.07 - -
D. Transportation Cost 2.50 2.82 2.33 1.75 2.95 0.90 - 0.29
E. Commission of Forwarding Agents
0.14 0.15 0.14 - - - - -
F. Commission and Market Fee
2.81 - - 2.71 - - - -
G. Other Charges
1. State Tax 0.15 0.14 - 0.15 0.15 - -
2. Miscellaneous Charges 0.25 0.18 0.15 0.17 0.17 0.21 - 0.04
H. Total Marketing Cost 10.31 7.60 6.87 9.29 7.67 5.57 - 2.24
Grower’s Net Return (A-H)
A Monthly Double-Blind Peer Reviewed Refereed Open Access International e-Journal - Included in the International Serial Directories International Journal in Management and Social Science
http://www.ijmr.net.in email id- irjmss@gmail.com Page 348 ii (b) Marketing cost and net return for respondents of Group 2
Channel A
Table 3 shows that average price received by respondents is Rs. 30.25 in Delhi market followed by Rs.29.75 Chandigarh and Rs. 26.66 in HP under channel A. It was analysed that grower‟s net return is Rs. 22.50 in Chandigarh market followed by Rs. 19.97 in Delhi market and Rs. 19.79 in APMC market yards of HP. The perusal of table shows that total marketing cost borne by growers is highest i.e. Rs. 10.31 in Delhi market followed by Rs. 7.60 in Chandigarh and Rs.6.87 in HP. Growers who approach Delhi market have to face market fee and commission of commission agent as extra cost which decrease the net return of growers while these cost are faced by buyers in Chandigarh and Himachal Pradesh.
Channel B
Table 3 clearly reveals that grower‟s net price is Rs.31.55 in Delhi market followed by Rs. 31.440 in Chandigarh market and Rs. 26.60 in Himachal Pradesh via B channel. The table further indicates that total marketing cost borne by growers is Rs. 9.64, Rs. 7.05 and Rs. 5.91 for Delhi, Chandigarh market and Himachal Pradesh respectively. As the growers have to pay Rs. 2.91 as commission of commission agent and market fee in Delhi market, it reduces the net return of growers. Thus grower‟s net return is Rs. 24.39 in Chandigarh followed by Rs. 24.91 Delhi and Rs. 20.69 in Himachal Pradesh via channel B.
Channel D
Respondents sold their C grade apple at MSP (Rs 5.25) via channel D. Table 3 show that total marketing cost is qualifying to Rs. 3.36. It was observed that up to depot total marketing cost is faced by growers. It was also analysed that grower‟s net return is Rs. 1.89 for 1 kg apple under channel D.
Channel E
A Monthly Double-Blind Peer Reviewed Refereed Open Access International e-Journal - Included in the International Serial Directories International Journal in Management and Social Science
http://www.ijmr.net.in email id- irjmss@gmail.com Page 349
Table 3: Marketing Cost and Net Return under Different Marketing Channels for Group 2 N= 30
Particulars Channels Followed by Sampled Apple Growers (Group 2)
Ch. A (Through F. Agents) Ch. B (Directly to
Commission Agent of APMC)
Ch. D (HPMC)
Ch. E (Apni Mandi)
Ch. F
Directly to Company
Delhi Chandigarh HP Delhi Chandigarh HP Adani Mother
Dairy
Fresh and Healthy
Rs/kg Rs/kg Rs/kg Rs/kg Rs/kg Rs/kg Rs/kg Rs/kg Rs/kg Rs/kg Rs/kg
A. Price received By Growers
30.25 29.75 26.66 31.55 31.44 26.60 5.25 23.44 53.45 50.00 51.6
B. Labour cost
1. Picking, Assembling, 0.39 0.37 0.45 0.38 0.25 0.50 0.41 0.35 0.47 0.54 0.31
Grading 0.28 0.39 0.47 0.25 0.28 0.48 0.45 0.33 0.58 0.53 0.50
3. Packing 0.18 0.15 0.15 0.17 0.19 0.19 0.14 0.17 0.18 0.19 0.15
4.1 Loading 0.16 0.15 0.14 0.13 0.10 0.15 0.18 0.83 0.28 0.17 0.75
4.2 Unloading 0.20 0.16 0.12 0.18 0.13 0.13 0.18 0.53
5. Carriage to Road Head 0.21 0.25 0.21 0.25 0.22 0.24 0.26 0.23 0.10 0.24 0.24
C. Market Costs
1.Packaging Material cost 3.00 3.01 3.18 3.00 3.05 2.92 1.17 1.33 2.40 2.50
2. Labeling , Stenciling etc. 0.09 0.07 0.09 0.07 0.08 0.07 - 0.05 - 0.10 0.15
D. Transportation Cost 2.50 2.19 1.91 2.00 2.48 0.89 0.57 0.91 1.14 - -
E. Commission of Forwarding Agents
0.13 0.13 0.11 - - - 0.20 - -
F. Commission and Market Fee
2.81 - - 2.91 - - - -
G. Other Charges
1. State Tax 0.16 0.16 0.14 0.15
2. Miscellaneous Charges 0.17 0.15 0.04 0.16 0.12 0.34 - 0.01 - - -
H. Total Marketing Cost 10.28 7.18 6.87 9.64 7.05 5.91 3.36 4.74 2.95 4.17 4.60
A Monthly Double-Blind Peer Reviewed Refereed Open Access International e-Journal - Included in the International Serial Directories International Journal in Management and Social Science
http://www.ijmr.net.in email id- irjmss@gmail.com Page 350 Channel F
Table 3 is depicting that growers have received Rs. 53.45 from Adani followed by Rs. 51.6 from Fresh and Healthy and Rs. 50.0 from Mother Dairy. Table further reveals that growers have to face transportation cost under the supply chain of Adani which is qualified to Rs. 1.14 while this cost is incurred by Mother Dairy and Fresh and Healthy under channel F.
It was also analysed that growers have to incur Rs. 2.4 and Rs 2.5 on packaging for Mother Dairy and Fresh and Healthy but this cost is nil under Adani supply chain because Adani supplies plastic crates to its member growers. The total marketing cost borne by growers is Rs. 2.95, Rs. 4.17 and Rs. 4.6 under supply chain of Adani, Mother Dairy and Fresh and Healthy respectively. Therefore grower‟s net return is Rs. 50.5 from Adani followed by Rs. 47 from Fresh and Healthy and Rs. 45.83 from Mother Dairy respectively.
iii. Marketing cost and margins for wholesalers under traditional marketing channels
The perusal of table 4 has elicited that wholesalers have sold the apple of Group 1 at Rs. 34.70 and Rs. 33.22 and secured the margins to Rs. 6.35 and Rs. 4.95 via channels A and channel B respectively. Total marketing cost incurred by wholesaler is Rs. 2.92 and Rs. 2.52 via channel A and channel B respectively. Table has further elicited that wholesalers have sold the apple of Group 2 at Rs. 33.12 and Rs. 33.63 and secured margins to Rs. 3.93 and Rs. 3.99 via channel A and channel B respectively. Total marketing cost incurred by wholesalers is Rs. 2.93 and Rs. 3.04 via channel A and channel B respectively.
Table 4:Marketing Cost and Margins (in Rs.) at Wholesalers’ Level APMC Market Yards of HP
Particulars Group 1 Group 2
Channel A Channel B Channel A Channel B
A. Price Paid By Wholesalers
25.43 24.75 26.26 26.60
B. Marketing Cost incurred by Wholesalers
1 Labour Charges 0.17 0.15 0.12 0.12 2 Loading/ Unloading 0.30 0.30 0.30 0.30 3 Spoilage @ 2.5% 0.63 0.61 0.65 0.66 4 Post & Telegraph 0.07 0.03 0.05 0.03 5 Market Fee @5 % 1.25 1.23 1.31 1.33 6 Transportation Cost 0.50 0.20 0.50 0.60
Sub Total 2.92 2.52 2.93 3.04
C. Wholesalers’ Margins 6.35 4.95 3.93 3.99
D. Selling Price (A+B+C) 34.70 32.22 33.12 33.63
iv (a) Marketing cost and margins for retailers under traditional marketing channels
A Monthly Double-Blind Peer Reviewed Refereed Open Access International e-Journal - Included in the International Serial Directories International Journal in Management and Social Science
http://www.ijmr.net.in email id- irjmss@gmail.com Page 351
2 at Rs. 42.70 and Rs. 41.82, incurred Rs. 3.62 and Rs. 3.15 as total marketing cost and secured their margins to Rs. 5.96 and Rs. 5.04 via channel A and channel B respectively.
Table 5: Marketing Cost and Margins (in Rs.) at Retailers’ Level
Group 1 Group 2
Channel A Channel B Channel A Channel B
A. Gross Price Paid By Retailers
34.70 32.22 33.12 33.63
B. Marketing Cost incurred by Retailers
1 Loading/ Unloading 0.15 0.15 0.15 0.15
2 Spoilage @ 4 % 1.38 1.22 1.32 1.34 3 Market Charges (Rent,
Electricity etc.)
1.45 1.50 1.50 1.00
4 Local Transportation Cost 0.14 0.16 0.15 0.16 5 Miscellaneous 0.50 0.50 0.50 0.50
Sub Total 3.62 3.63 3.62 3.15
C. Retailer’s Margins 3.47 5.30 5.96 5.04
D. Selling Price (A+B+C) 41.79 41.15 42.70 41.82
iv (b) Marketing costs and margins for private players under modern marketing channels
The essence of table 6 reveals that total marketing cost is highest (Rs. 6.67) for Mother Dairy followed by Fresh and Healthy (Rs. 6.28) and Adani (Rs.5.26). Table elicits that Mother Dairy has secured highest margins (Rs.5.66) followed by Adani (Rs. 4.69) and Fresh and Healthy (Rs. 3.47). It was experienced that selling price of Adani is highest qualifying to Rs. 63.40 followed by Mother Dairy (Rs. 62.33) and Fresh and Healthy (Rs. 61.40).
Table 6:Marketing Cost and Margin (in Rs.) under Modern Marketing Channels
Particulars Private Players
Adani’s Supply Chain
Mother Dairy’s Supply Chain
Fresh and Healthy’s Supply Chain
A. Price Paid to Growers 53.45 50 51.6
B. Marketing Cost incurred by P. Players
1.Transportation Cost 1.25 2.50 2.50 2. Unloading 0.18 0.13 0.15 3. Cleaning, Grading, Sorting 0.40 0.25 0.30 4. Storage 1.30 1.25 1.50 5. Packing Material and
Packaging
1.52 1.95 1.25
A Monthly Double-Blind Peer Reviewed Refereed Open Access International e-Journal - Included in the International Serial Directories International Journal in Management and Social Science
http://www.ijmr.net.in email id- irjmss@gmail.com Page 352
8. Miscellaneous - - -
Sub Total 5.26 6.67 6.28
C. Company’s Margins 4.69 5.66 3.47
D. Selling Price (A+B+C) 63.40 62.33 (CP)* 61.40
Retailers total cost 2.50 2.00
Retailers Margin 5.00 4.00
Selling price of retailers 70. 90 (CP)* 67.40 (CP)*
*CP- Consumer price
It was found that supply chain of Mother Dairy is shortest than both companies. Mother Dairy procures apple directly from growers and sells directly to ultimate consumers through its retail outlets (SAFAL) in Delhi region. On the other hand Adani and Fresh and Healthy sell apple to big retailers of metro cities of country instead of selling directly to consumers. It is evident from table 6 that retailer has sold apple of Adani and Fresh and Healthy at Rs. 70.9 and Rs. 67.4 respectively. Therefore retailers has fetched higher price from Adani‟s apple than Fresh and Healthy. It was analysed that retailers have incurred Rs 2.5 and Rs. 2 on marketing and secured net margins to Rs 5 and Rs 4 under the supply chain of Adani and Fresh and Healthy respectively.
V (a) Marketing efficiency of traditional marketing channels
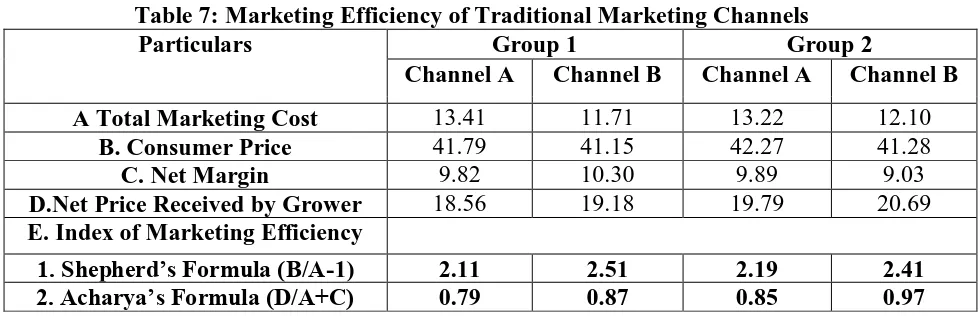
It is evident from the table 7 that marketing efficiency of Channel A and Channel B is 2.11 and 2.51 respectively by using Shepherd‟s formula in Group 1. Table further shows that marketing efficiency is 2.19 and 2.41 for Channel A and channel B respectively by Shepherd‟s formula in Group 2. Marketing efficiency was also calculated by employing Acharya‟s formula and it was found that marketing efficiency of channel A and channel B is 0.79 and 0.87 respectively in Group 1. Table further shows that marketing efficiency of Channel A and Channel B is 0.85 and 0.97 respectively in Group 2. Thus Channel B has been proved to the most efficient marketing channel by Shepherd‟s formula and Acharya‟s formula in Group1 and in Group 2.
Table 7: Marketing Efficiency of Traditional Marketing Channels
Particulars Group 1 Group 2
Channel A Channel B Channel A Channel B
A Total Marketing Cost 13.41 11.71 13.22 12.10
B. Consumer Price 41.79 41.15 42.27 41.28
C. Net Margin 9.82 10.30 9.89 9.03
D.Net Price Received by Grower 18.56 19.18 19.79 20.69
E. Index of Marketing Efficiency
1. Shepherd’s Formula (B/A-1) 2.11 2.51 2.19 2.41
2. Acharya’s Formula (D/A+C) 0.79 0.87 0.85 0.97
V (b) Marketing Efficiency of Modern marketing Channels
A Monthly Double-Blind Peer Reviewed Refereed Open Access International e-Journal - Included in the International Serial Directories International Journal in Management and Social Science
http://www.ijmr.net.in email id- irjmss@gmail.com Page 353 Table 8: Marketing Efficiency of Modern Marketing Channels
Particulars Channel
E
Channel F
Apni Mandi
Adani’s Supply Chain
Mother Dairy’s Supply Chain
Fresh and Healthy’s Supply Chain
A.Total Marketing Cost 4.74 10.71 10.84 12.88
B. Consumer Price 23.44 70.90 62.33 67.40
C. Net Margin - 9.69 5.66 7.47
D. Net Price Received by Growers in Rs. 18.70 53.45 50.00 51.60
E. Index of Marketing Efficiency
1. Shepherd’s Formula (B/A-1) 3.94 5.61 4.75 4.23
2. Acharya’s Formula (D/A+C) 3.94 2.62 3.03 2.53
Table 8 further reveals marketing efficiency of channel F. It was found that marketing efficiency of Adani (5.61) is highest followed by Mother Dairy (4.75) and Fresh and Healthy (4.23) by employing Shepherd‟s formula. Thus Shepherd‟s formula suggests that supply chain of Adani is the most efficient under channel F. On the other hand marketing efficiency of Mother Dairy (3.03) is highest followed by Adani (2.62) and Fresh and Healthy (2.53) by using Acharya‟s formula. Thus Acharya‟s formula has suggested that supply chain of Mother Dairy is the most efficient under channel F.
CONCLUSION
A Monthly Double-Blind Peer Reviewed Refereed Open Access International e-Journal - Included in the International Serial Directories International Journal in Management and Social Science
http://www.ijmr.net.in email id- irjmss@gmail.com Page 354
REFERENCES
Singh Surendra P., Sikka B.K. and Singh Ashutosh. (2009). Supply Chain Management and Indian Fresh Produce Supply Chain: Opportunities and Challenges- A paper prepared for presentation in International food & agribusiness management association, 19th annual world symposium.
Rauf Abdul, Saraf S.A. and Wani S.A. (2011). Economics of Production and Marketing of Apple in Himachal Pradesh and Jammu and Kashmir. Indian Journal of Agricultural Marketing, 25 (1) pp. 97-119.
Pandey Mukesh, Sikka B.K. and Sunil Panthari (2011). ICT System for Increasing Efficiency of Apple-Value in ICT for Agriculture & Rural Development in National Conference on Managing Agri-Food Supply Chain, Arunachal Pradesh, 9-11 April.
Economic Survey 2011. HP. Directorate of Economics and Statistics: pp. 2-25.
Economic Survey 2010. HP. Directorate of Economics and Statistics: pp. 2-25.
http://.nhb.gov.in. National Horticulture Database. 4.12.2012.
http://nhb.gov.in/model-project-reports/Horticulture%20Crops%5Capple%5Capple1.htm. 28.02.2013.