117
International Journal in Management and Social Science http://ijmr.net.in, Email: irjmss@gmail.comA STUDY ON CUSTOMER SATISFACTION TOWARDS AAVIN MILK IN KANNIYAKUMARI DISTRICT
Alex Raja. M
Ph. D Scholar, T.D.M.N.S College, T.Kallikulam
1.1 INTRODUCTION
Customer satisfaction is a business term, is a measure of how products and services supplied by a company meet or surpass customer expectation. It is seen as a key performance indicator within business and part of the four prospective of balanced score card.
Customer satisfaction is an abstract concept and the actual manifestation of the state of satisfaction will vary from person to person and product/service to product/service. The state of satisfaction depends on a number of both psychological and physical variables which correlate with satisfaction behaviors such as return and recommend rate.
Factors influencing customer satisfaction
The level of satisfaction can also vary depending on other factors the customer, such as other products against which the customer can compare the organization's products. Organizations need to retain existing customers while targeting non-customers. Measuring customer satisfaction provides an indication of how successful the organization is at providing products.
Customer satisfaction with a service by using the gap between the customer's expectation of performance and their perceived experience of performance. This provides the researcher with a satisfaction "gap" which is semi-quantitative in nature. The customer is asked to evaluate each statement in terms of their perception and expectation of performance of the service.
Customer satisfaction in general
Customer satisfaction in general refers to the general satisfaction is a person feeling of pleasure or disappointment resulting from comparing a products received performances relation to his/her expectations. Customer satisfaction cannot be very difficult after all you either satisfied with the services you received or you are not. If you don‟t you are not customer satisfaction is a marketing tool and definite value added benefit.
It looks at what is involved from 3 different angles,
118
International Journal in Management and Social Science http://ijmr.net.in, Email: irjmss@gmail.com The second is from the perspective of a research agency that has been asked to obtain feedbackfrom customers and about their experiences when dealing with companies.
Finally it considers the issue from the perspective of consumers who participate in surveys, including both business customers and members of general public.
Customer satisfaction in Public sector business
Customer satisfaction drives successful private sector business. High performing businesses have developed principles and strategies for achieving customer satisfaction. Customer satisfaction principles and strategies help to improve the quality responsiveness, and possibility of public sector privately provided services in vulnerable communities.
1.2 OBJECTIVE OF THE STUDY
1.2.1 To find out the reasons for the preferring Aavin milk. 1.2.2 To analyze the socio – economic profile of the respondents. 1.2.3 To find out the satisfaction level of the respondents.
1.2.4 To give the suggestion and recommendation.
1.3 STATEMENT OF THE PROBLEM
Customer satisfaction is the major catalyst which induces the customer to buy the product, because there may be a shortage of production process to deliver the milk to the society, is one of the problem is faced by aavin milk.
1.4 SCOPE OF THE STUDY
The scope of the study refers to the area of operation. In this study the initial stage the industry profile has been presented clearly and later on the company profile.
The specific area of study in regular customer of the product Kanniyakumari District Co- Operative Milk Producer Union Ltd related to customer satisfaction.
1.5 NEED FOR THE STUDY
Customer satisfaction is one of the important for each and every organization because it is not easy to find out the taste of the customer. If the organization find out the way, about the customer are satisfied the project. It‟s maintaining good relationship between the customers.
1.6 SIGNIFICANCE OF THE STUDY
119
International Journal in Management and Social Science http://ijmr.net.in, Email: irjmss@gmail.com1.7 RESEARCH METHODOLOGY 1.7.1 Research meaning
According to Clifford Woody “research comprises defining and redefining problems , formulating hypothesis are suggested solutions ; collecting , organizing and evaluating data making deductions and reaching conclusions to determine whether they fit the formulating hypothesis .
Some peoples consider research “as a movement from the known to the unknown. It is actually a voyage of discovery”.
Research is a common parlance refers to a search for knowledge. It can also be define research as a scientific and systematic search for pertinent information on a specific topic. In fact, research is an art of scientific investigation. The advance learner‟s dictionary of current English lays down the meaning of research as “a careful investigation or inquiry especially through search for new facts in any branch of knowledge”.
1.7.2 Research design
Research design is the specification of the methods and procedures for acquiring the information needed to structure or solve problems. It constitutes the blue print for the collection measurement and analysis of data.
1.7.3 Descriptive study
A descriptive study discover to answer the question who, what, when, where and sometimes how. It is already that descriptive study well suited when the administrator has to plan, monitor, evolve or evaluate.
1.7.4 Research Instrument
The research instrument used in the study is a structured questionnaire in which there are predetermined questions relating to the aspect for which researcher collect data.
1.7.5 Questionnaire design
The questionnaire design in a structured type, which consist of 1. Open ended
2. Close ended 3. Likerts scale
1.7.6 Data collection
This is an empirical study based on survey method. The data were collected from both primary and secondary sources.
1.7.7 Primary data
Researcher collected data directly, interacting with the customers in co- operative milk producers union ltd. Primary data consist of original gathered data for the specific purpose. Primary data is that, which is collected for the time. Primary data relating to this study was collected through questionnaire.
120
International Journal in Management and Social Science http://ijmr.net.in, Email: irjmss@gmail.com Secondary data refer to the information which already exists. Researcher collected data from classified dairy books, websites, text books etc and from the company management through there available records.1.8 Sample design
The boundary of this study Kanniyakumari Co-operative Producers Union Ltd in Nagercoil.
1.8.1 Sample size
The researcher sample size is 50.
1.8.2 Sampling area
The sample area of the researcher is Nagercoil town.
1.9 SATISTICAL TOOLS ANALYSIS
The data collected were analyzed and interpreted with the help of tables and figures. 1. Chi – Square Test
1.9.1 Chi – Square Test
The chi- square test is an important test amongst the several tests of significance developed by tacticians chi – square is a statistical measured used in content of sampling analysis for comparing a variance to a theoretical variance.
1.9.1.1The formula for Chi – Square test is
X2 = (O - E) 2 E
O = Observed frequency
E = Expected frequency
Degree of freedom = (c-1) (r-1)
1.10 LIMITAIONS OF THE STUDY
1. The opinions of the respondents are taken as valid. 2. The time allotted for the study was limited.
3. The respondents restricted to buy product
1.11 Chapter scheme
This study consists of five chapter. First chapter discuss about the introduction of customer satisfaction in general consider with statement of the problem, need of the problem, objectives of the study, scope of the study, significant of the study, operational meaning of concepts, methodology, sample the design, statistical tools for analysis, period of the study, limitation of the study.
Second chapter deals with the reviews of literature. Third chapter deals with the company profile.
121
International Journal in Management and Social Science http://ijmr.net.in, Email: irjmss@gmail.com2.1 REVIEWS OF LITERATURE
A study on customer satisfaction was under taken by West Brook1 (1990) on explicit conceptualizations of the relationship between personality and customer satisfaction. The findings revealed that customers sentiments of satisfaction with product be viewed as the results of the interplay of the least three distinct factors, a comparison of perceived product , outcome to those desired or expected, generalized evaluative predisposition rooted in personality and temporary effective states varying over time and situation.
Wood Ruff, Cadotte and Jenkins2 (1993) made a study on customer satisfaction process; the actual performance and the expected performance of the customers were analyses in their study. The researchers proposed to modify the basis confirmation, disconfirmations paradigm in two ways. Firstly, expectations were replaced with experience based norms as the standards for comparisons of a brands performance. Secondly a zone of indifference was postulated as a mediator between confirmation, disconfirmation and satisfactions.
The study made by Virendra P.Sing3,(Agricultural Situation in India ,Feb 2000) revealed that, after independence, with the systematic initiation of the 5 years plans , dairying has progressively been receiving more and more emphasis and getting greater allocation of funds. The actual expenditure in terms of rupees , on dairy sector in India was Rs77.8 millions during the first five year plan (1951-56) which increased to Rs 1307.51million during the eighth five years plan .The proposed outlay on dairy development in the nineth five year plan (1997-98 To 2001-02) is Rs 4850 millions.
Raman jam K.N4 (2003) studied the “Role of Co-operative in milk Marketing venture” as Indian middle class customers have a craze for milk and its products. As they have good purchasing power, there exists high demand for milk products. As a result, India is emerging as one of the largest and fastest growing customers markets for milk and value added milk products in the world and the ever increasing demand for milk product is a testimony for this. Therefore, only by having on effective and sound system of distribution of milk and milk product, will emerge India as the world‟s leading dairy nation.
Periyasami N.5 (2006) in the article “milk production in India” said that the cost of production per liter of milk in India has been worked out to be the lowest in the world. Then there will be competitive advantage to increase India‟s global share of export in the dairy sector. Since Indian dairy sector is one of the least subsidized sectors in the world, it can therefore, afford to take on aggressive stand in its position in world milk production. India became the world leader in milk production. India becomes the world lender in milk production in 201 with a production of 84 million tonner.
122
International Journal in Management and Social Science http://ijmr.net.in, Email: irjmss@gmail.comK.A. Sheeba7 (2006) in the study a study on production and marketing of milk in agateeswaram Taluk. Found out that more milk producer‟s societies have been functioning in the taluk.
FredReichheld8 Publication date: Feb 19, 2008. Conventional customer satisfaction measures have proven inaccurate predictors of actual customer behavior or a company's growth. This chapter recounts the author's development and implementation of a better metric for determining what customers think and feel about the companies they do business with, known as a Net Promoter Score (NPS). This chapter was originally published as Chapter 2 of "The Ultimate Question: Driving Good Profits and True Growth."
Haemoon Oh, Sara C Parks9 There is a desperate need for new research that will advance customer satisfaction (CS) and service quality (SQ) methodologies in the hospitality industry. This comprehensive review of the theories and methodologies reported in CS and SQ studies cited in the hospitality literature provides suggestions for future CS and SQ research in the hospitality field. First, the theoretical and methodological issues are critically reviewed. Next, major developments in CS and SQ research methodologies are discussed. The concept of importance and its role in behavioral models are included as they have been recently applied in hospitality CS and SQ research. The final section of this study is devoted to developing and proposing new directions for future CS and SQ research in the hospitality industry
Satisfaction means happiness, joy, relief, and comfort. "Satisfaction rises out of the flow of time," says Wendell Berry10
D.W.Attwood and B.S Baviskar11 (Ed) claimed Co-operative dairy development as one of the most effective strategies for helping the poor. It was also asserted that milk production does not require much land but mainly family labour which the poor have empty and such the landless poor can easily and profitability participate in the white revolution, driving employment and additional income for it.
According to S.I.Makker12, dairy Co-operative definitely increase the cattle feed fodder, artificial insemination and veterinary services. It not only provides effective leadership and a team of committed professional but also encourages active participation of producer‟s which ultimately make the project success.
July 14, 2010 by Eric Jacques13
Customer satisfaction is defined as “Customer satisfaction, a business term, is a measure of how products and services supplied by a company meet or surpass customer expectation.” But that seems off when you look at the separate definitions of the two words that comprise the term.
123
International Journal in Management and Social Science http://ijmr.net.in, Email: irjmss@gmail.com Customer satisfaction is considered to be one of the most important outcomes of all marketing activities in a market-oriented firm and become the most important predictor of future behavioral intention Shamdasaniand Bal Krishnan152000.3.1 INDUSTRIAL PROFILE
India is one of the largest cattle rearing countries in the world. It stands first in cattle population. Dispute cattle population, we have not out placed milk production when compared with countries like Sweden, Denmark, Germany, etc…This is due to the fact that our cattle breeds are of poor quality. Governments financial spending towards research and development is not adequate. Many of our five years plans has allocated resources for dairy developments, the outcome is not very much encouraging. “In socialism much poverty and paper co exists.”
Even though Indian is trying to emerge as an industrialized nation, still it is considered as an agricultural oriented economy. Majority of our population live in rural areas of the country. Agricultural and dairy farming is one of the most important sectors generating employment for the millions. Many depend on this sectors for their livelihood. Governments may come and go but no one can neglect sectors. Recent failure of the Chandrababu Naidu in Andhra Pradesh election clearly establishes the facts.
3.1.1 INTRODUCTION ABOUT INDUSTRY
Agriculture still continues to be major sector in India economy. Agriculture is lifeline base for about 70% of the people of India. Indian agriculture is based on mixed farming i.e. crop production through irrigation and rearing live stick. Co-operative dairying grew in the post independent area on the foundation of co-operation. The demand milk and products continues to rise in our country year after do to growing incomes of families. To meet the growing demand of milk and milk products, there is a need to revamp the countries to milk policy and promote manufacture of high quality dairy product. There is very good scope for new entrepreneurs. The dairy industry involves processing raw milk into products such as consumer milk, butter, cheese, yogurt, condensed milk, dried milk (milk powder) and ice cream using processes such as chilling, pasteurization and homogenization.
3.1.2 HISTORY OF INDIAN DAIRY INDUSTRY
Dairy is a place where handing of milk and milk products is done and technology refers to the application of scientific knowledge for practical purpose. In India, dairying has been practiced as a rural cottage industry since the remote past. Semi-commercial dairying started with the establishment of military dairy farmers and co-operatives milk unions throughout the country towards the 20, 1st century.
124
International Journal in Management and Social Science http://ijmr.net.in, Email: irjmss@gmail.com was eliminated and cattle were all sent back to the rural areas. Gradually farmers with in easy distance began delivering milk over regular routes in the cities. This was a beginning of the fluid milk shed which surround the large cities of today. Prior to the 1850s most of the milk was necessarily produced with in a short distance of the place of consumption because of lack of suitable mean of transportation and refrigeration.The Indian diary industry has made rapid progress independence. A large number of modern milk plans and products factories have since be established. These organized dairies have been successfully engaged in the routine commercial production of pasteurized bottle milk and various western and Indian dairy products. With modern knowledge of protection of milk during transportation it becomes possible to locate dairies were less expensive and crops could be grown more economically. In India market technology may be considered to have commenced in 1950, with the functioning of the central dairy and dairy milk colony and milk product technology in 1956 with the establishment of AMUL dairy Anand .
3.1.3GROWTH OF INDIAN DIARY INDUSTRY
Today India is „The oyster‟ of the goal dairy industry. It offers opportunities galore to entrepreneurs worldwide, who wish to capitalize on one of the worlds largest and growing markets for milk and milk products. A bagful of pearl‟s awaits the international dairy processor in India. The Indian dairy industry is rapidly growing trying to keep pace with the galloping progress around the world.
India‟s dairy sector will triple in production in the next ten years in view of expanding potential for export to Europe and the west. Moreover with WIO regulation expected to come into force in coming years, all the developed countries which are among big exported today would have to withdraw the support and subsidy to their domestic milk products sector. Also India today is the lowest cost producer per lire of milk in the world at 27 cents, compared to Japan‟s 63 cents USS 2.8 dollars. Also to take advantages of this low cost of milk production and increasing production in this country, multinational companies are planning to expand their activities here. Some of these milk producers have already obtained quality standard certificate from the authorities. This will help them in marketing their products in foreign country in processed form.
3.1.4 MAJOR PLAYERS
The packaged milk segment is dominated by the dairy operatives. Gujarat operative milk marketing federation [GCMMF] is the largest player. All other local dairy co-operatives have their local brands e.g. Gokul, warana in Maharashra, saras in Rajasthan, verka in Punjap, Vijaya in Andrapradesh, Aavin in Tamil nadu etc. other private players include JK dairy, heritage foods, and Indian Dairy.
3.1.5 GLOBAL OPPORTUNITIES FOR INDIAN DAIRY INDUSTRY
125
International Journal in Management and Social Science http://ijmr.net.in, Email: irjmss@gmail.com us to access the market of develop countries such as the EU,USA and Japan but India is well situated to supply the milk difficult region of South East Asia, Middle East and Africa. There is also a large expatriate Indian population in the Middle East who recognizes and prefers Indian brands. With a per capita milk consumption of 211 gms, India is still below the developed countries average of 303gms per day. India has a large domestic market which will help in creating a suitable base for export products.What we have to realize is that if the Indian dairy industry is to encase the global opportunity, then there is no room for fly by night operators. Milk is a perishable commodity and unless one is involve in the complete value chain of production, processing and marketing. We have to make significant improvements in raw milk quality. We have to impose strict standards for adulterants, contaminants and microbiological counts and set up an infrastructure of bulk cooler and insulated tanker at village level preserve the integrity of milk after milking. There has to be a significant movement in the veterinary care services and also people documentation of disease control to enable verification by international agencies.
A part from ensuring quality of milk we will have to create world class processing facilities to meet international specification. The Indian dairy industry has to look at innovative value added product. Many of the traditional products could also be considered for factor processing. Lastly on marketing, a lot needs too be done. First of all we need the government help to give as market access. Our representation on international negotiation forums has been then adequate. The government must involve industry professionals and must ensure a level playing field for India.
As Indian products have a poor quality image we need to have very strict quality control on export. The ministry of commerce, government of India as made it mandatory for all export to be approved by the export inspection agency. This control should be very strictly implemented in that there is improved in the image of Indian product abroad. While the goal dairy opportunity is large.
3.2 COMPANY PROFILE
Kanniyakumari Co-operative Milk Producers Ltd Profile
126
International Journal in Management and Social Science http://ijmr.net.in, Email: irjmss@gmail.com3.2.1 Dairy at Glance:
Sl. No Contents Details
1. Date of registration 25-01-1949
2. Date of functioning 07-02-1950
3. Conversion as producers union 16-02-1982
4. Area of operation Kanniyakumari District
5. Total no of societies 111
6. Functioning society 76
7. No of societies supplying milk to union 40
8. No of milk routes 04
9. No of societies doing AI 18
10. Dairy Capacity 2500 Lts
11. Pasteurization Capacity 5000 Lts
12. Milk storing capacity 50,000 Lts
13. Boiler 1.5 ton
14. Milk kova producing capacity per day 50 – 60 kg per day
15. Milk packet machine packing capacity 7500 Lts / hour
16. Generator 70 K.V.A
17. Milk tanker No 2 No
18. Milk purchase rate Rs.124.32 for 1 Kg of total solids
19. Milk payment Every Fortnight ( 15 days)
20. Brand Aavin
127
International Journal in Management and Social Science http://ijmr.net.in, Email: irjmss@gmail.com3.2.2 Employees:
General Manager - 1 Manager - 4
Deputy Manager - 3 Executive and typist - 6 Junior executive - 7
Technicians - 8 Drivers - 7
Senior factory assistance - 46 Total 82
3.2.3 Working Hours:
For office and administration staff, it is 9.30 A.M to 5.30 P.M. It is general shift for the plant. It functions through three shifts.
1st shift - 6 A.M to 2 P.M
2nd shift - 2 P.M to 10 P.M
3rd shift -10 P.M to 6 A.M
3.2.4 Departments:
In KDCMPU there are some kinds of departments. They are as follows.
Procurement & Input Department
Administration Department
Marketing Department
Accounts Department
Production Department
Stores Department
Quality Control
3.2.4.1 Procurement & Input Department
Procurement and input is an important department in the organization. It deals with procurement of milk and takes it as input for final production. It is headed by the general manager and controlled by manager .
3.2.4.2Administration Department
It is headed by the general manager and controlled by manager (Administration & IR) and assisted by two executives, one junior executive , one private secretary one junior executive typist and three factory assistance.
It covers all the section of the co-operative in case of overall administration. Department acts as the HR department and takes care that the employees are satisfied with their respective authority . It looks after the welfare schemes of the employees of the whole dairy. It includes some of other section like.
Recruitment & Selection
128
International Journal in Management and Social Science http://ijmr.net.in, Email: irjmss@gmail.com Perquisites
Leave & Holidays:
Services
Job Satisfaction
Trade Unions
Disciplinary Action
Grievance Handling
Welfare Measures
3.2.4.3 Marketing Department
It is headed by the General manager and controlled by manger ( Marketing ) . He is assisted by two deputy managers. One executive, two junior executive, twenty for senior factory assistants.
Distribution Of Product
Advertisement
Price
3.2.4.4 Distribution of Product
Milk is supplied in polythene cover in 500ml and 250 ml. It is marketed by the agents, aavin parlors, self- help groups and milk producer‟s co-operative societies.
They are selling milk products like peda, flavoured milk ghee, butter milk and cake. They supply milk every day morning and evening. The consumers have to pay one month cost of milk in advance for milk cards which effects from 16th of every month to 15th of next month. Based on the card the milk will be supplied to the consumers by the agents @ Rs. 23 per liter and Rs. 30 per liter to the other general public.
3.2.4.5 Price
Price of the product is fixed by the government.
3.2.4.6 Function
To prepare the marketing plan at the beginning of every year, taking into consideration the demand, sales and production capacity.
To undertake promotional activities in order to create awareness and to generate sales.
To ensure proper supply chain management.
To satisfy individuals and organizational goals.
3.2.4.6 Accounts Department
It is headed by the General Manager and controlled by the manager (Accounts) and assisted by one deputy manager, three executives and five junior executives.
3.2.4.7 Production Department
129
International Journal in Management and Social Science http://ijmr.net.in, Email: irjmss@gmail.com Production Process
The milk is received from the society and it is tested to check both quality and quantity. In reception the check the weight the milk. After that it goes to pasteurization machine. In pasteurization machine the heat water will boil the raw milk for 74‟C to 80‟C and it cools for 4‟C, the milk will sent to the packing machine, after packing they sent to sales.
3.2.4.8 Stores Department
It is headed by the General manager and controlled by manager ( dairy ). He is assisted by one executive. The receipt of the materials is on the basis of intends only under the stores. In the stores department the equipment are purchased from the companies or from the sellers.
3.2.4.9 Quality Control & Maintenance Department
It is headed by the General manager and controlled by the manager ( quality control ) and assisted by one Deputy manager ( DC ) and two lab technicians. It is used to test check both quantity and quality of the milk.
3.2.4 PRODUCT OF AAVIN MILK
Two verities of milk produced by the company
1. Homogenisated toned milk
2. Standard milk
1. Homogenized toned milk
Toned, milk is the main product of Aavin milk plant. It contains 3% fat 8.5% SNF (Solid Non Milk)
2. Standardized milk
130
International Journal in Management and Social Science http://ijmr.net.in, Email: irjmss@gmail.com3.2.5 BY PRODUCT
a) Ghee
b) Butter milk
c) Khoa
DATA ANALYSIS AND INTERPRETATION
4.1 Introduction
The data after collection has been processed and analyses by the researcher. Technically data processing includes editing the data, coding the data, classification of data and tabulation of data, form analysis refers to the complication of certain measures searching for patents of relationship that exists. This is the process of analysis relationship are difference supporting or conflicting with hypothesis should subjected to statistical test of significant to determine its validity.
In this present chapter the researcher have analyzed the data which collected by means of questionnaire from the Aavin milk plant. The statistical tools used for analysis are simple chi-square test.
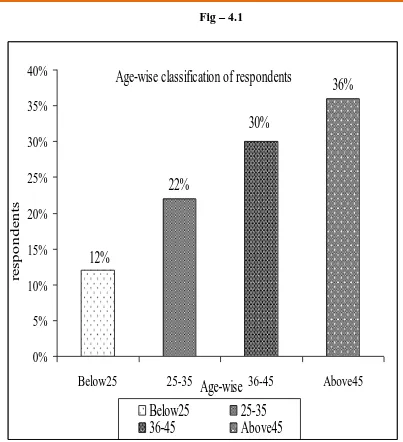
Table – 4.1
AGE-WISE CLASSIFICATION OF RESPONDENTS
Sources: Primary data
Interpretation:
The above table shows that 36% of the respondents are in the age group of above 45 years, 30% of the respondents are in the age group of 36-45 years, 22% of the respondents are in the age group 25-35 and 12% of the respondents are in the age group below 25.
Age group No. of respondents Percentage
Below25 6 12%
25-35 11 22%
36-45 15 30%
Above45 18 36%
131
International Journal in Management and Social Science http://ijmr.net.in, Email: irjmss@gmail.comFig – 4.1
0%
5%
10%
15%
20%
25%
30%
35%
40%
Below25
25-35
36-45
Above45
Below25
25-35
36-45
Above45
Age-wise classification of respondents
12%
22%
30%
36%
re
s
p
o
n
d
e
n
ts
132
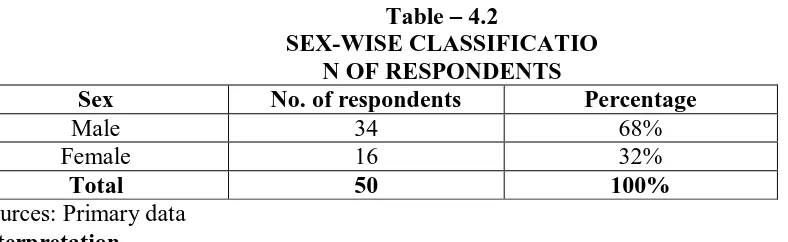
International Journal in Management and Social Science http://ijmr.net.in, Email: irjmss@gmail.comTable – 4.2
SEX-WISE CLASSIFICATIO N OF RESPONDENTS
Sex No. of respondents Percentage
Male 34 68%
Female 16 32%
Total 50 100%
Sources: Primary data
Interpretation
The above table shows that 68% of the respondents are male and 32% of the respondents are female.
Fig – 4.2
0% 10% 20% 30% 40% 50% 60% 70% 80%
Male Female
Male Female
Sex-wise classification of respondents
68%
32%
re
sp
o
n
d
e
n
ts
133
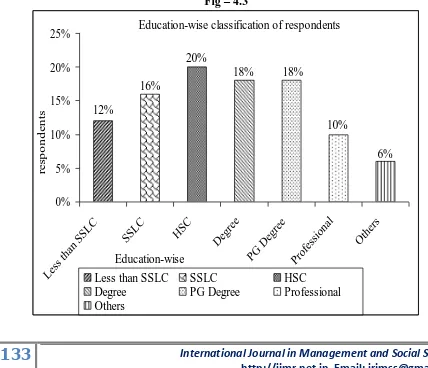
International Journal in Management and Social Science http://ijmr.net.in, Email: irjmss@gmail.comTable – 4.3
EDUCATION-WISE CLASSIFICATION OF RESPONDENTS Education group No. of respondents Percentage
Less than SSLC 6 12%
SSLC 8 16%
HSC 10 20%
Degree 9 18%
PG Degree 9 18%
Professional 5 10%
Others 3 6%
Total 50 100%
Sources: Primary data
Interpretation:
The above table show that for 20% of the respondents educational qualifications is HSC, 18% of the respondents of PG Degree and 18% of the respondents are Degree.
Fig – 4.3
0% 5% 10% 15% 20% 25%
Less than
SSLC SSLC HSC Degree PG
Degree Profe
ssio nal
Others
Less than SSLC SSLC HSC
Degree PG Degree Professional Others
Education-wise classification of respondents
12%
16%
20%
18% 18%
10%
6%
re
sp
o
n
d
e
n
ts
134
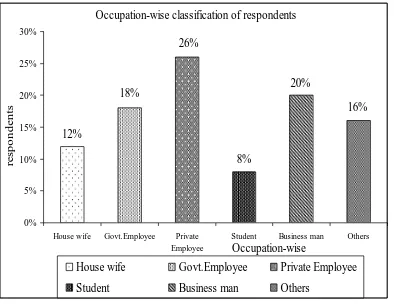
International Journal in Management and Social Science http://ijmr.net.in, Email: irjmss@gmail.comTable – 4.4
OCCUPATION-WISE CLASSIFICATION OF RESPONDENTS Occupation No. of respondents Percentage
House wife 6 12%
Govt.Employee 9 18%
Private Employee 13 26%
Student 4 8%
Business man 10 20%
Others 8 16%
Total 50 100%
Sources: Primary data
Interpretation
The above table shows that 26% of the respondents are employed in private sector and 20% of the respondents are businessman.
Fig – 4.4
0% 5% 10% 15% 20% 25% 30%
House wife Govt.Employee Private Employee
Student Business man Others
House wife Govt.Employee Private Employee
Student Business man Others Occupation-wise classification of respondents
12%
18%
26%
8%
20%
16%
Occupation-wise
re
sp
o
n
d
e
n
135
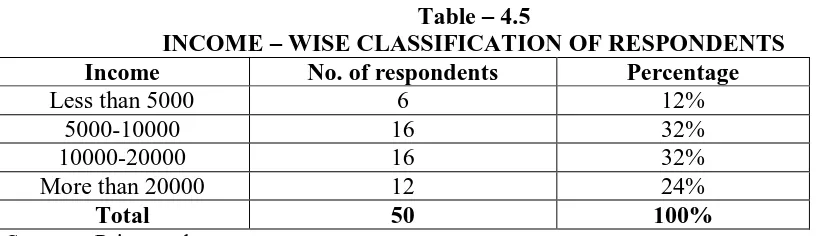
International Journal in Management and Social Science http://ijmr.net.in, Email: irjmss@gmail.comTable – 4.5
INCOME – WISE CLASSIFICATION OF RESPONDENTS Income No. of respondents Percentage
Less than 5000 6 12%
5000-10000 16 32%
10000-20000 16 32%
More than 20000 12 24%
Total 50 100%
Sources: Primary data
Interpretation
It can be inferred from the above table that 32% of the respondents are in the family income group of Rs.5000-10000and 24% of the respondents are in the family income group of more than Rs.20000.
Fig – 4.5
0%
5%
10%
15%
20%
25%
30%
35%
Less than 5000 5000-10000
10000-20000
More than
20000
Less than 5000
5000-10000
10000-20000
More than 20000
Income – wise classification of respondents
Income – wise
12%
32%
32%
24%
re
sp
o
n
d
e
n
136
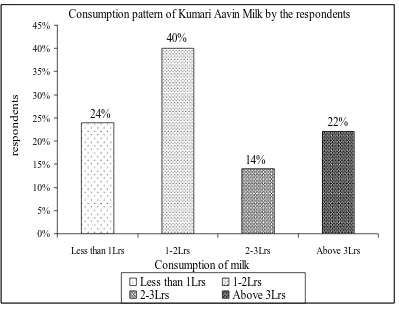
International Journal in Management and Social Science http://ijmr.net.in, Email: irjmss@gmail.comTable -4.6
CONSUMPTION PATTERN OF AAVIN MILK BY THE RESPONDENTS Per day consumption No. of respondents Percentage
Less than 1Lrs 12 24%
1-2Lrs 20 40%
2-3Lrs 7 14%
Above 3Lrs 11 22%
Total 50 100%
Sources: Primary data
Interpretation
It can be inferred from the above table that 40% of the respondents buying 1-2Lrs and 24% of the respondents are in the less than 1Lrs.
Fig – 4.6
0% 5% 10% 15% 20% 25% 30% 35% 40% 45%
Less than 1Lrs 1-2Lrs 2-3Lrs Above 3Lrs
Less than 1Lrs 1-2Lrs 2-3Lrs Above 3Lrs
Consumption pattern of Kumari Aavin Milk by the respondents
24%
40%
14%
22%
re
sp
o
n
d
e
n
ts
137
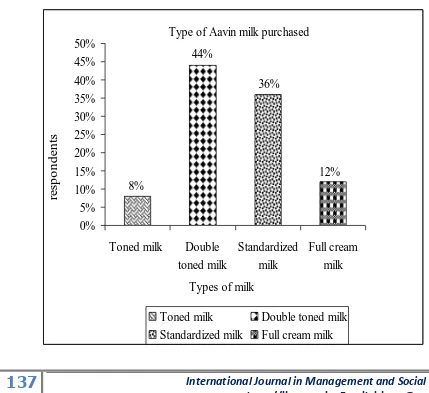
International Journal in Management and Social Science http://ijmr.net.in, Email: irjmss@gmail.comTable – 4.7
TYPE OF AAVIN MILK PURCHASED
Type of milk No .of respondents Percentage
Toned milk 4 8%
Double toned milk 22 44%
Standardized milk 18 36%
Full cream milk 6 12%
Total 50 100%
Sources: Primary data
Interpretation
It can be inferred from the above table that 44% of respondents purchased in double toned milk 36% of respondents purchased in standardized milk.
Fig – 4.7
0%
5%
10%
15%
20%
25%
30%
35%
40%
45%
50%
Toned milk
Double
toned milk
Standardized
milk
Full cream
milk
Toned milk
Double toned milk
Standardized milk
Full cream milk
Type of Aavin milk purchased
8%
44%
36%
12%
re
sp
o
n
d
e
n
ts
138
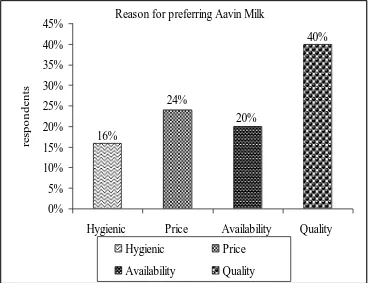
International Journal in Management and Social Science http://ijmr.net.in, Email: irjmss@gmail.comTable - 4.8
REASON FOR PREFERRING AAVIN MILK Particular No. of respondents Percentage
Hygienic 8 16%
Price 12 24%
Availability 10 20%
Quality 20 40%
Total 50 100%
Sources: Primary data
Interpretation
It can be inferred from the above table that 24% of respondents price of the Aavin milk 40% of respondents quality of the Aavin milk.
Fig – 4.8
0% 5% 10% 15% 20% 25% 30% 35% 40% 45%
Hygienic Price Availability Quality
Hygienic Price
Availability Quality Reason for preferring Aavin Milk
re
sp
o
n
d
e
n
ts
16%
24%
20%
139
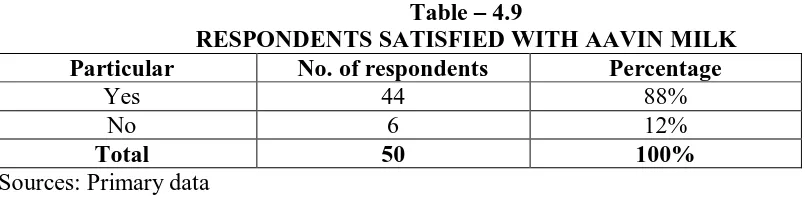
International Journal in Management and Social Science http://ijmr.net.in, Email: irjmss@gmail.comTable – 4.9
RESPONDENTS SATISFIED WITH AAVIN MILK Particular No. of respondents Percentage
Yes 44 88%
No 6 12%
Total 50 100%
Sources: Primary data
Interpretation
It can be infer from the above table that 88% of the respondents are satisfied and 12% of the respondents are not satisfied.
Fig – 4.9
0% 10% 20% 30% 40% 50% 60% 70% 80% 90% 100%
Yes No
Yes
No
Respondents satisfied with Aavin Milk
88%
12%
R
e
sp
o
n
d
e
n
140
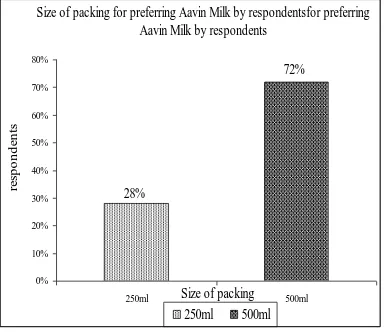
International Journal in Management and Social Science http://ijmr.net.in, Email: irjmss@gmail.comTable -4.10
SIZE OF PACKING FOR PREFERRING AAVIN MILK BY RESPONDENTS Particular No. of respondents Percentage
250ml 14 28%
500ml 36 72%
Total 50 100%
Sources: Primary data
Interpretation
The above table that 28% of the respondents prefer 250ml and 72% of the respondents are prefer 500ml.
Fig – 4.10
0% 10% 20% 30% 40% 50% 60% 70% 80%
250ml 500ml
250ml
500ml
Size of packing for preferring Aavin Milk by respondentsfor preferring
Aavin Milk by respondents
28%
72%
Size of packing
re
sp
o
n
d
e
n
141
International Journal in Management and Social Science http://ijmr.net.in, Email: irjmss@gmail.comTable – 4.11
PERIOD FOR WHICH THE RESPONDENTS BUYER OF AAVIN MILK Particular No. of respondents Percentage
Below 1year 7 14%
1-2year 9 18%
2-3year 10 20%
Above3year 24 48%
Total 50 100%
Sources: Primary data
Interpretation
It can be inferred from the above table that 48% of the respondents are buying Aavin for a period of above 3 years and 20% of the respondents are buying Aavin milk 2-3 years.
Fig – 4.11
0% 10% 20% 30% 40% 50% 60%
Below 1year 1-2year 2-3year Above3year
Below 1year
1-2year
2-3year
Above3year
Period for which the respondents buyer of Aavin Milk
14%
18%
20%
48%
re
sp
o
n
d
e
n
142
International Journal in Management and Social Science http://ijmr.net.in, Email: irjmss@gmail.comTable – 4.12
OPINION OF THE RESPONDENTS TOWARDS SATISFIED WITH THE TASTE OF AAVIN MILK
Particular No. of respondents Percentage
Yes 42 84%
No 8 16%
Total 50 100%
Sources: Primary data
Interpretation
It can be inferred from the above table that 84% of the respondents are taste of the Aavin Milk.
Fig – 4.12
0% 10% 20% 30% 40% 50% 60% 70% 80% 90%
Yes No
Yes No
Opinion of the respondents towards satisfied with the taste of
Aavin milk
re
sp
o
n
d
en
ts
84%
143
International Journal in Management and Social Science http://ijmr.net.in, Email: irjmss@gmail.comTable 4.13
ASSIOCIATION BETWEEN THE NON DEMOGRAPHICAL FACTOR AND SATISFIED OF THE MILK
Taste Satisfied of the milk Total
Yes No
Yes 38 4 42
No 6 2 8
Total 44 6 50
Source: Primary data
Ho = There is significance relation ship between taste of the product and the customer
satisfaction.
Ha= There is no significance relation ship between taste of the product and the customer
satisfaction
Table 4.14
THE APPLICATION OF CHI- SQUARE TEST BETWEEN TASTE AND SATISFIED OF THE MILK
O E (O-E)2 (O-E)2/E
38 44*42/50=36.96 1.0816 0.0293
6 44*8/50=7.04 1.0816 0.1536
4 6*42/50=5.04 1.0816 0.2146
2 6*8/50=0.96 1.0816 1.1267
Total 1.5242
Calculated Value = 1.5242 Table Value = 3.841 Degree of freedom = 1
144
International Journal in Management and Social Science http://ijmr.net.in, Email: irjmss@gmail.comTable – 4.15
OPINION OF THE RESPONDENTS TOWARDS QUALITY OF AAVIN MILK Particular No. of respondents Percentage
High 36 72%
Normal 7 14%
Low 2 4%
None 5 10%
Total 50 100%
Sources: Primary data
Interpretation
It can be inferred from the above table that 72% of the respondents are good quality of Aavin milk.
Fig – 4.13
0% 10% 20% 30% 40% 50% 60% 70% 80%
High Normal Low None
High Normal
Low None
Opinion of the respondents towards Quality of Aavin
m
ilkre
sp
o
n
d
en
ts
72%
14%
4%
145
International Journal in Management and Social Science http://ijmr.net.in, Email: irjmss@gmail.comTable – 4.16
OPINION OF THE RESPONDENTS TOWARDS PRICE OF AAVIN MILK
Particular No. of respondents Percentage
High 6 12%
Normal 41 82%
Low 3 6%
None - -
Total 50 100%
Sources: Primary data
Interpretation
The above table shows that 82% of the respondent‟s opinion is normal and 6% of the respondent‟s opinion is low.
Fig – 4.14
0% 10% 20% 30% 40% 50% 60% 70% 80% 90%
High Normal Low None
High
Normal
Low
None
Opinion of the respondents towards price of Aavin Milk
12%
82%
6%
0%
re
sp
o
n
d
e
n
ts
146
International Journal in Management and Social Science http://ijmr.net.in, Email: irjmss@gmail.comTable 4.17
ASSIOCIATION BETWEEN THE NON DEMOGRAPHICAL FACTOR AND SATISFIED OF THE MILK
Price Satisfied of the milk Total
Yes No
Normol 43 4 47
None 1 2 3
Total 44 6 50
Source: Primary data
Ho = There is significance relation ship between price of the product and the customer satisfaction.
Ha = There is no significance relation ship between price of the product and the customer satisfaction
Table 4.18
THE APPLICATION OF CHI- SQUARE TEST BETWEEN PRICE AND SATISFIED OF THE MILK
O E (O-E)2 (O-E)2/E
43 44*47/50=41.36 2.6896 0.065
1 44*3/50=2.64 2.6896 1.018
4 6*47/50=5.64 2.6896 0.477
2 6*3/50=0.36 2.6896 7.471
Total 9.031
Calculated Value = 9.031 Table Value = 3.841 Degree of freedom = 1
147
International Journal in Management and Social Science http://ijmr.net.in, Email: irjmss@gmail.comTable –4.19
OPINION OF THE RESPONDENTS TOWARDS PACKING OF AAVIN MILK
Particular No. of respondents Percentage
Very good 10 20%
Good 35 70%
Very poor 1 2%
Poor 4 8%
Total 50 100%
Sources: Primary data
Interpretation
The above table shows that 70% of the respondents of the opinion that it is good and 2% of the respondent‟s opinion very poor.
Fig – 4.15
0% 10% 20% 30% 40% 50% 60% 70% 80%
Very good Good Very poor Poor
Very good
Good
Very poor
Poor
Opinion of the respondents towards packing of Aavin Milk
20%
70%
2%
8%
re
sp
o
n
d
en
148
International Journal in Management and Social Science http://ijmr.net.in, Email: irjmss@gmail.comTable – 4.20
ASSIOCIATION BETWEEN THE NON DEMOGRAPHICAL FACTOR AND SATISFIED OF THE MILK
Packageing Satisfied of the milk Total
Yes No
Good 42 3 45
Poor 2 3 5
Total 44 6 50
Source: Primary data
Ho = There is significance relation ship between packing of the product and the customer satisfaction.
Ha = There is no significance relation ship between packing of the product and the customer satisfaction
Table – 4.21
THE APPLICATION OF CHI- SQUARE TEST BETWEEN PACKAGEING AND SATISFIED OF THE MILK
O E (O-E)2 (O-E)2/E
42 44*45/50=39.6 5.76 0.146
2 44*5/50=4.4 5.76 1.309
3 6*45/50=5.4 5.76 1.067
3 6*5/50=0.6 5.76 9.6
Total 12.122
Calculated Value = 12.122 Table Value = 3.841 Degree of freedom = 1
In this case, the result reveals that the hypothesis is rejected as the calculated value is less than the table value. Hence it can be conclude that the are satisfied with customers.
Table – 4.22
OPINION OF THE RESPONDENTS TOWARDS AVAILABILITY OF AAVIN MILK
Particular No. of respondents Percentage
Very good 10 20%
Good 34 68%
Very poor 1 2%
Poor 5 10%
Total 50 100%
149
International Journal in Management and Social Science http://ijmr.net.in, Email: irjmss@gmail.comInterpretation
The above table shows that 68% of the respondent‟s opinion is good and 20% of the respondent‟s opinion is very good.
Fig – 4.16
Table 4.23
ASSIOCIATION BETWEEN THE NON DEMOGRAPHICAL FACTOR AND SATISFIED OF THE MILK
Availability Satisfied of the milk Total
Yes No
Good 42 2 44
Poor 2 4 6
Total 44 6 50
Source: Primary data
Ho = There is significance relation ship between availability of the product and the customer satisfaction.
Ha = There is no significance relation ship between availability of the product and the customer satisfaction
0% 10% 20% 30% 40% 50% 60% 70% 80%
Very good Good Very poor Poor
Very good Good Very poor Poor
Opinion of the respondents towards availability of Aavin Milk
20%
68%
2%
10%
re
sp
o
n
d
e
n
150
International Journal in Management and Social Science http://ijmr.net.in, Email: irjmss@gmail.comTable – 4.24
THE APPLICATION OF CHI- SQUARE TEST BETWEEN AVAILABILITY AND SATISFIED OF THE MILK
O E (O-E)2 (O-E)2/E
42 44*44/50=38.72 10.7584 0.2779
2 44*6/50=5.28 10.7584 2.0376
2 6*44/50=5.28 10.7584 2.0375
4 6*6/50=0.72 10.7584 14.94
Total 19.2731
Calculated Value = 19.2731 Table Value = 3.841 Degree of freedom = 1
In this case, the result reveals that the hypothesis is rejected as the calculated value is less than the table value. Hence it can be conclude that they are satisfied with customers.
Table – 4.25
OPINION OF THE RESPONDENTS TOWARDS PROMPT DELIVERY OF AAVIN MILK
Particular No. of respondents Percentage
Good 21 42%
Moderate 20 40%
Bad 9 18%
Total 50 100%
Sources: Primary data
Interpretation
151
International Journal in Management and Social Science http://ijmr.net.in, Email: irjmss@gmail.comFig – 4.17
Table – 4.26
Reason for switching over to other brands by respondents Particular No. of respondents Percentage
Thickness 12 24%
Quality 18 36%
Price 10 20%
Availability in time 10 20%
Total 50 100%
Sources: Primary data
Interpretation
It can be infer from the above table that 24% of the respondents are thickness and 36% of the respondents are quality and 20% of the respondents are price.
0% 5% 10% 15% 20% 25% 30% 35% 40% 45%
Good Moderate Bad
Good
Moderate
Bad
Opinion of the respondents towards prompt delivery of Aavin Milk
42%
40%
18%
re
sp
o
n
d
e
n
152
International Journal in Management and Social Science http://ijmr.net.in, Email: irjmss@gmail.comFig – 4.18
Table – 4.27
Benefit expected by respondents from organization
Particular No. of respondents Percentage
Quality throughout the year 26 52%
No price fluctuations 9 18%
Prompt door delivery 10 20%
Prompt spot delivery 5 10%
Total 50 100%
Sources: Primary data 0%
5% 10% 15% 20% 25% 30% 35% 40%
Thickness Quality Price
Thickness
Quality
Price
Reason for switching over to other brands by respondents
re
sp
o
n
d
e
n
ts
24%
36%
153
International Journal in Management and Social Science http://ijmr.net.in, Email: irjmss@gmail.comInterpretation
It can be inferred from the above table that 52% of the respondents expect the good quality throughout the year and 20% of the respondents expect prompt door delivery.
Fig – 4.19
5.1 FINDINGS
5.1.1 36% of the respondents are in the age group of above 45 years age and 12% of the respondents are the age group of below 25.
5.1.2 68%of respondents are male and 32% of the respondents are female.
5.1.3 20% of the respondents educational qualifications are HSC, 18% of the respondents are degree and 18% of the respondents are PG degree holders.
5.1.4 26% of the respondents are employed in private sector, 20% of the respondents are businessman and 12% of the respondents are housewife.
5.1.5 24% of the respondents are in the family income group of more than Rs. 20000 and 32% of the respondents are in the family income group of Rs.5000-10000.
5.1.6 40% of the respondents buying per day consumption 1-2Lrs and 24% of the respondents are in the less than 1Lrs.
0% 10% 20% 30% 40% 50% 60%
Quality throughout the year
No price fluctuations
Prompt door delivery
Prompt spot delivery
Quality throughout the year No price fluctuations
Prompt door delivery Prompt spot delivery Benefit expected by respondents from organisation 52%
18% 20%
10%
re
sp
o
n
d
en
154
International Journal in Management and Social Science http://ijmr.net.in, Email: irjmss@gmail.com 5.1.7 44% of the respondents are buying double toned milk,36% of the respondentsstandardized milk.
5.1.8 24% of the respondents are price of the Aavin milk,40% of the respondents are quality of the Aavin milk.
5.1.9 88% of the respondents are satisfied and 12% of the respondents not satisfied.
5.1.10 8% of the respondents are prefer 250ml and 72% of the respondents are prefer 500ml. 5.1.11 8% of the respondents are buying Aavin milk for a period above 3 years and 20% of the
respondents are buying Aavin milk 2-3years. 5.1.12 4% of the respondents are taste of the Aavin milk.
5.1.13 2% of the respondents are good quality of the Aavin milk.
5.1.14 2% of the respondents‟ opinion is normal about the price and 6% of the respondents‟ opinion is low.
5.1.15 0% of the respondents‟ opinion is good about the packing of Aavin milk and 2% of the respondents‟ opinion is very poor because leakages are found frequently.
5.1.16 8% of the respondent‟s opinion is good about the availability of Aavin milk and 20% of the respondent‟s opinion is very good.
5.1.17 2% of the respondents‟ opinion is good about prompt delivery of Aavin milk and 40% of the respondents‟ opinion is moderate.
5.1.18 4% of the respondents are switching to other brands in case of milk thickness and 20% of the respondents due to price.
5.1.19 2% of the respondents expect in the good quality throughout the year and 18% of the respondents expect no price fluctuation.
5.1 SUGGESTION
5.2.1 Open more retail outlets among the rural area exclusively for Aavin products. 5.2.2 Co-ordination among the staff and farmers should be stream line.
5.2.3 Mobile vetinary unit should be made effective.
5.2.4 More attention should be made to make the packing effective, because lots of damages are reporting.
5.2.5 Adequate training should be given to agents to improve the sales in their territories by arranging classes in their areas.
5.2.6 They can implement home delivery system also.
5.2 CONCLUSION
155
International Journal in Management and Social Science http://ijmr.net.in, Email: irjmss@gmail.comLIST OF REFERAENCE
1. Sales and distribution management, Oskar jerenius, publication 2. Modern Indian thought Richard T.Farmer,
3. Service mgt, Brain and parker, volume:19 4. A key for quality product mgt, Kuo et al, 5. Sales and services, Fran Suzzner,
WEBSITES
1 www.google.com