Thesis by
Jonathan Ben-Zion Sternberg
In Partial Fulfillment of the Requirements for the Degree of
Doctor of Philosophy
California Institute of Technology Pasadena, California
2013
c
2013
Acknowledgements
I would like to thank my advisor, Professor Niles Pierce, for enlightening scientific conver-sations, as well as for providing me with the intellectual community, resources, and most importantly, freedom necessary to carry out the exciting work presented in this thesis. I would also like to thank the great group of people I have had the luck to know during my time in the Pierce Lab. Thank you, Dr. Victor Beck, Ma’ayan Schwarzkopf, Dr. Jeff Vieregg, Dr. Tobias Heinen, Lisa Hochrein, Dr. Harry Choi, and the rest of the lab mem-bers. You have all helped me in a variety of ways. For help with proofreading my thesis, I thank Melinda Kirk.
I would also like to thank the wonderful committee members with whom I have had the luck to work. Thank you, Professor David Tirrell, Professor Scott Fraser, and Professor Michael Elowitz; your insights and support throughout these last few years have been instrumental.
I owe a great deal of thanks to my family as well. Mom and Dad (Ima and Aba), if it were not for your continuous love and support for more than three decades, I would not be where I am today. Thank you for instilling in me the values that allowed me to pursue scientific work at Caltech and the motivation to work hard and to strive to achieve my personal best. My brother, Ariel, thank you for your love and support, and for being the amazing friend that you are to me.
Last, but not least, I would like to thank my wife. Kayla, my dear, thank you for
Abstract
Some of the most exciting developments in the field of nucleic acid engineering include the utilization of synthetic nucleic acid molecular devices as gene regulators, as disease marker detectors, and most recently, as therapeutic agents. The common thread between these technologies is their reliance on the detection of specific nucleic acid input markers to generate some desirable output, such as a change in the copy number of an mRNA (for gene regulation), a change in the emitted light intensity (for some diagnostics), and a change in cell state within an organism (for therapeutics). The research presented in this thesis likewise focuses on engineering molecular tools that detect specific nucleic acid inputs, and respond with useful outputs.
Contents
Acknowledgements iii
Abstract v
List of Figures ix
List of Tables x
1 Introduction 1
References . . . 4
2 Isothermal Enzyme-Free Detection of SNPs via Hybridization Chain Re-action 9 2.1 Introduction . . . 9
2.2 Detection of SNPs with Hybridization Chain Reaction . . . 11
2.3 Kinetic Control of HCR via ∆G Tuning . . . 13
2.4 Experimental Verification of Kinetic Control of HCR . . . 15
2.5 Effect of Mutation Location on SNP Discrimination . . . 17
2.6 Detection of SNP Cancer Markers . . . 19
2.7 Improving HCR Discrimination with Scavenger . . . 21
2.8 SNP Profiling via HCR Multiplexing . . . 24
2.9 Detection of SNPs in Long RNA . . . 25
2.10 Conclusion . . . 28
3 Transducing Sequence to Light with Quenched HCR 35
3.1 Introduction . . . 35
3.2 Design of 2-Hairpin and 4-Hairpin Quenched HCR . . . 37
3.3 Analysis of 2-Hairpin and 4-Hairpin Quenched HCR . . . 38
3.4 Multiplexing Quenched HCR . . . 40
3.5 Conclusion . . . 43
References . . . 44
4 Sequence Transduction with Conditional Probes 46 4.1 Introduction . . . 46
4.2 Design of Conditional Probes . . . 49
4.3 Experimental Verification of Conditional Probe Function . . . 50
4.4 Multiplexing via Conditional Probe and Quenched HCR . . . 52
4.5 Detection of Long RNA . . . 52
4.6 Conclusion . . . 52
References . . . 56
Appendices 57 A Appendix to Chapter 2 58 A.1 Methods . . . 58
A.2 Strand Sequences . . . 60
B Appendix to Chapter 3 64 B.1 Methods . . . 64
B.2 Background-subtracted Data of Quenched HCR Multiplexing . . . 66
B.3 Sensitivity of Quenched HCR . . . 67
B.4 RNA-based Quenched HCR . . . 68
B.5 Fast Target Detection with Quenched HCR . . . 68
C Appendix to Chapter 4 71
List of Figures
2.1 SNP Detection . . . 12
2.2 Kinetically Discrimination of SNPs via HCR at a Time Scale of Choice . . . 16
2.3 Effect of Mutation Location on SNP Discrimination . . . 18
2.4 Detection of SNP Cancer Markers . . . 20
2.5 Scavenger- and HCR-Mediated SNP Detection . . . 22
2.6 Generality of Scavenger- and HCR-Mediated Selectivity . . . 23
2.7 SNP Profiling via HCR Multiplexing . . . 26
2.8 Detection of SNPs in Long RNA . . . 27
3.1 Design of Quenched HCR . . . 39
3.2 End-labeled 2-Hairpin-Periodicity Quenched HCR vs. 4-Hairpin-Periodicity Quenched HCR . . . 41
3.3 Multiplex Detection of Cancer Gene Markers . . . 42
4.1 Illustration of Conditional Probe . . . 48
4.2 Sequence Transduction with Conditional Probes . . . 51
4.3 Conditional Probe Multiplexing . . . 53
4.4 Conditional Probe Mediated Sequence Transduction Triggered by Long RNA 53 B.1 Background-Subtracted Data of Multiplexing with Quenched HCR . . . 66
B.2 Sensitivity Analysis of Quenched HCR . . . 67
B.3 RNA-based Quenched HCR . . . 68
List of Tables
A.1 Strands Utilized in Figure 2.1 . . . 61
A.2 Strands Utilized in Figure 2.2 . . . 61
A.3 Strands Utilized in Figure 2.3 . . . 61
A.4 Strands Utilized in Figure 2.4 . . . 62
A.5 Strands Utilized in Figure 2.5. . . 62
A.6 Strands Utilized in Figure 2.6. . . 63
A.7 Strands Utilized in Figure 2.7 . . . 63
A.8 Strands Utilized in Figure 2.8. . . 63
B.1 Strands Utilized in Chapter 3 . . . 70
B.2 Additional Strands Utilized in Appendix B . . . 70
Chapter 1
Introduction
Breakthroughs in the field of nucleic acid engineering over the last two decades include in vitro genotyping technologies [1–3], antisense translation inhibition [4–6], and gene therapy [7–9]. Recently, dynamic nucleic acid systems engineering has been demonstrated with the implementation of DNA walkers that traverse space in a programmed manner [10–12], self-assembly reactions, in which predefined structures self-assemble from nucleic acid strands [13, 14], and triggered self-assembly reactions, in which the presence of a specific molecule is required to initiate a molecular self-assembly reaction [11, 15, 16].
To date, few dynamic nucleic acid systems have been developed into useful technolo-gies. Nonetheless, the technologies into which such systems have been integrated, such as molecular-beacon-based real-time PCR, and RNA genotyping in zebrafish [17, 18], suggest that dynamic nucleic acid systems are likely to find increasing application.
Owing mostly to advances in genomics [21–25], the field of diagnostics has undergone a shift from the macro to the micro. Indeed, clinicians who have formerly had to rely on gross physical changes in patients (e.g., reported symptoms, changes in appearance, cell morphology changes as revealed in biopsies and, more recently, MRI) to diagnose dis-eases, are transitioning to tools that enable molecular-driven diagnoses [26–31]. Molecular diagnostic tools could revolutionize the practice of medicine by: (1) replacing traditional diagnostic techniques that rely on cell culture and therefore often require weeks [32] with techniques that provide answers within hours or even less [33], (2) reducing the adverse health effects associated with current diagnostic methods [32, 34–37], and (3) minimizing expenditure associated with incorrect diagnosis [38].
The field of molecular diagnostics holds much promise, but it also poses an array of chal-lenges. For a molecular diagnostic technique to find mass appeal, it must be (1) fast, (2) cheap, (3) easy to use, (4) portable, (5) robust, (6) selective (i.e., not yield false positives), (7) sensitive (i.e., not yield false negatives), and (8) suitable to interaction with biological specimens.
A technology that addresses all of these challenges is not presently available. Real-time reverse-transcription PCR (qRT-PCR), for example, relies on an expensive machine and requires technical expertise and clean RNA samples containing neither DNA nor nucleases [39]. Hence, qRT-PCR does not fully satisfy criteria 2–5. Similarly, nucleic acid sequencing technologies are slow, expensive, technically challenging, and unsuitable for point-of-care diagnostics (due to their dependence on large machines). Sequencing technologies, there-fore, do not fully satisfy criteria 1–4 [40, 41]. By comparison, the tools described in this thesis (HCR, Scavenger, Quenched HCR, and Conditional Probe) satisfy criteria 1–6 and could potentially satisfy criteria 7–8 as well.
cases, including the (G→A) substitution, which is the hardest SNP to detect in RNA-RNA hybridization reactions [42, 43]. To the best of our knowledge, selective detection of the G→A SNP, solely via a hybridization-based detection scheme in which both the target and the detector are RNA oligonucleotides, has not been accomplished previously.
In Chapter 3 we demonstrate that Quenched HCR is an effective method of transducing hybridization reactions to light emissions. Because HCR polymer formation is transduced to light, cumbersome gel assays, which have been our primary means of monitoring HCR
in vitro reactions to date, can be replaced with real-time bulk fluorescence assays [44]. Lastly, in Chapter 4 we describe conditional probes that execute the logical operation: if target sequence A is present, expose target sequence B. In contrast to the transducer of Seelig et al. [45], our Conditional Probe is unimolecular, remains bound to target, and can therefore provide spatial informationin situ [18] as well as in substrate-based assays. Our conditional probes are conceptually similar to those of Shimron et al. [20]; used in combi-nation with Quenched HCR, we achieve discrimicombi-nation ratios up to an order of magnitude higher than those previously demonstrated.
References
[1] Saiki, R. K.et al.Primer-directed enzymatic amplification of DNA with a thermostable DNA polymerase. Science (New York, N.Y.) 239, 487–91 (1988).
[2] Higuchi, R., Fockler, C., Dollinger, G. & Watson, R. Kinetic PCR analysis: real-time monitoring of DNA amplification reactions.Biotechnology Nature Publishing Company 11, 1026–30 (1993).
[3] Lipshutz, R. J., Fodor, S. P., Gingeras, T. R. & Lockhart, D. J. High density synthetic oligonucleotide arrays. Nature Genetics 21, 20–24 (1999).
[4] Stephenson, M. L. & Zamecnik, P. C. Inhibition of Rous sarcoma viral RNA translation by a specific oligodeoxyribonucleotide.Proceedings of the National Academy of Sciences of the United States of America 75, 285–8 (1978).
[5] Toth, P. P. Emerging LDL therapies: Mipomersen-antisense oligonucleotide therapy in the management of hypercholesterolemia. Journal of Clinical Lipidology 7, S6–S10 (2013).
[6] Bhattacharjee, G. et al. Inhibition of Vascular Permeability by Antisense-Mediated Inhibition of Plasma Kallikrein and Coagulation Factor 12. Nucleic Acid Therapeutics
(2013).
[7] Morgan, R. A. et al. Cancer regression in patients after transfer of genetically engi-neered lymphocytes. Science (New York, N.Y.) 314, 126–9 (2006).
[8] Bainbridge, J. W. B. et al. Effect of gene therapy on visual function in Leber’s con-genital amaurosis. The New England Journal of Medicine 358, 2231–9 (2008).
[9] Cartier, N. et al. Hematopoietic stem cell gene therapy with a lentiviral vector in X-linked adrenoleukodystrophy. Science (New York, N.Y.) 326, 818–23 (2009).
[11] Yin, P., Choi, H. M. T., Calvert, C. R. & Pierce, N. a. Programming biomolecular self-assembly pathways. Nature 451, 318–22 (2008).
[12] Omabegho, T., Sha, R. & Seeman, N. C. A bipedal DNA Brownian motor with coordinated legs. Science 324, 67–71 (2009).
[13] Rothemund, P. W. K. Folding DNA to create nanoscale shapes and patterns. Nature 440, 297–302 (2006).
[14] Yin, P.et al. Programming DNA tube circumferences. Science 321, 824–826 (2008).
[15] Dirks, R. M. & Pierce, N. A. Triggered amplification by hybridization chain reaction.
Proceedings of the National Academy of Sciences of the United States of America 101, 15275–8 (2004).
[16] Li, B., Ellington, A. D. & Chen, X. Rational, modular adaptation of enzyme-free DNA circuits to multiple detection methods. Nucleic Acids Research 39, e110 (2011).
[17] Manganelli, R., Tyagi, S. & Smith, I. Real Time PCR Using Molecular Beacons : A New Tool to Identify Point Mutations and to Analyze Gene Expression in Mycobac-terium tuberculosis. Methods in Molecular Medicine 54, 295–310 (2001).
[18] Choi, H. M. T. et al. Programmable in situ amplification for multiplexed imaging of mRNA expression. Nature Biotechnology 28, 1208–1212 (2010).
[19] Yang, L., Liu, C., Ren, W. & Li, Z. Graphene surface-anchored fluorescence sensor for sensitive detection of microRNA coupled with enzyme-free signal amplification of hybridization chain reaction. ACS Applied Materials & Interfaces 4, 6450–3 (2012).
[20] Shimron, S., Wang, F., Orbach, R. & Willner, I. Amplified detection of DNA through the enzyme-free autonomous assembly of hemin/G-quadruplex DNAzyme nanowires.
Analytical Chemistry 84, 1042–8 (2012).
[22] Venter, J. C. GENOMICS: Shotgun Sequencing of the Human Genome. Science 280, 1540–1542 (1998).
[23] Ronaghi, M., Uhl´en, M. & Nyr´en, P. A sequencing method based on real-time py-rophosphate. Science 281, 363, 365 (1998).
[24] Rothberg, J. M. & Leamon, J. H. The development and impact of 454 sequencing.
Nature Biotechnology 26, 1117–24 (2008).
[25] Li, R., Li, Y., Kristiansen, K. & Wang, J. SOAP: short oligonucleotide alignment program. Bioinformatics (Oxford, England)24, 713–4 (2008).
[26] Perez, E. A., Pusztai, L. & van De Vijver, M. Improving patient care through molecular diagnostics. Seminars in Oncology 31, 14–20 (2004).
[27] Andreeff, M.et al. HOX expression patterns identify a common signature for favorable AML. Leukemia 22, 2041–2047 (2008).
[28] Brizova, H., Kalinova, M., Krskova, L., Mrhalova, M. & Kodet, R. Quantitative mea-surement of cyclin D1 mRNA, a potent diagnostic tool to separate mantle cell lym-phoma from other B-cell lymphoproliferative disorders.Diagnostic Molecular Pathology 17, 39–50 (2008).
[29] Wang, L. et al. Expression of the uptake drug transporter hOCT1 is an important clinical determinant of the response to imatinib in chronic myeloid leukemia. Clinical Pharmacology and Therapeutics 83, 258–64 (2008).
[30] Tiveljung-Lindell, A.et al.Development and implementation of a molecular diagnostic platform for daily rapid detection of 15 respiratory viruses.Journal of Medical Virology 81, 167–175 (2009).
[31] Dawson, S.-J.et al.Analysis of Circulating Tumor DNA to Monitor Metastatic Breast Cancer. New England Journal of Medicine 368, 130313140010009 (2013).
advances, and opportunities. The Journal of Infectious Diseases 205 Suppl, S147–58 (2012).
[33] Weile, J. & Knabbe, C. Current applications and future trends of molecular diagnostics in clinical bacteriology. Analytical and Bioanalytical Chemistry 394, 731–742 (2009).
[34] Watson, R. L. et al. Antimicrobial Use for Pediatric Upper Respiratory Infections: Reported Practice, Actual Practice, and Parent Beliefs. PEDIATRICS 104, 1251– 1257 (1999).
[35] Bazalov´a, Z., Benes, J. & Bronsk´a, E. [A study of antibiotic treatment of upper respiratory infections in primary care]. Klinick´a Mikrobiologie a Infekcn´ı L´ekarstv´ı14, 24–9 (2008).
[36] Alonso-Mart´ınez, J. L., S´anchez, F. J. A. & Echezarreta, M. a. U. Delay and misdiag-nosis in sub-massive and non-massive acute pulmonary embolism. European Journal of Internal Medicine 21, 278–82 (2010).
[37] Newman-Toker, D. E. & Pronovost, P. J. Diagnostic errors–the next frontier for patient safety.JAMA : The Journal of the American Medical Association 301, 1060–2 (2009).
[38] Vakil, N., Rhew, D., Soll, A. & Ofman, J. J. The cost-effectiveness of diagnostic testing strategies for Helicobacter pylori. The American Journal of Gastroenterology 95, 1691–8 (2000).
[39] Bustin, S. A. & Nolan, T. Pitfalls of quantitative real-time reverse-transcription poly-merase chain reaction. Journal of Biomolecular Techniques : JBT 15, 155–66 (2004).
[40] Metzker, M. L. Sequencing technologies - the next generation.Nature Reviews Genetics 11, 31–46 (2010).
[41] Kircher, M. & Kelso, J. High-throughput DNA sequencing–concepts and limitations.
BioEssays 32, 524–36 (2010).
[43] Mathews, D. H., Sabina, J., Zuker, M. & Turner, D. H. Expanded sequence depen-dence of thermodynamic parameters improves prediction of RNA secondary structure.
Journal of Molecular Biology 288, 911–40 (1999).
[44] Chang, B.-Y. Smartphone-based Chemistry Instrumentation: Digitization of Colori-metric Measurements. Bulletin of the Korean Chemical Society 33, 549–552 (2012).
Chapter 2
Isothermal Enzyme-Free Detection
of SNPs via Hybridization Chain
Reaction
2.1
Introduction
Single nucleotide polymorphisms (SNPs) are associated with cancer [1–5], meningitis [6, 7], hepatitis C [8], and a variety of other diseases. SNPs confer antibiotic resistance [9, 10] and can be used as pharmacogenetic [11–14] and forensic markers [15]. Owing to their importance as disease markers, a plethora of techniques for SNP detection have been de-veloped [16–20]. Yet, due to limitations in speed, cost, ease of use, portability, robustness, selectivity, or sensitivity, SNP detection technologies have mostly not been integrated into the clinic [23], with the exception of real-time PCR, which has recently found minimal use at the clinic [21, 22].
High-throughput, next-generation sequencing technologies [24], for example, rely on large, expensive instrumentation whose use in a point-of-care setup is not currently practi-cal. Similarly, microarray data analysis requires a large machine and relies on costly chips that render this technique cost-prohibitive for non-high-throughput applications. Moreover, microarrays have limited selectivity, as they often contain probes that hybridize to multi-ple genes [25], and limited sensitivity, as they do not reliably detect low-abundance genes [25, 26].
dis-criminates between SNPs [17], and can detect single copy mRNAs [27]. For these reasons, the use of qRT-PCR as a clinical diagnostic has increased in the last decade. At the same time, qRT-PCR has some shortcomings. First, its high sensitivity can be a hindrance, as even trace amounts of genetic DNA are amplified, thus providing false positives [28]. Similarly, sample impurities, as well as amplicon and target secondary structure can re-sult in false negatives [29, 30]. Moreover, to detect and quantify mRNA, qRT-PCR relies on a proxy (cDNA) that is generated by Reverse Transcriptase. The use of this enzyme introduces three additional limitations to qRT-PCR: (1) due to variance in secondary struc-tures in various RNA targets as well as in PCR primers, the formation of cDNA from an RNA template does not follow a fixed mathematical transformation, thus rendering qRT-PCR non-quantitative; (2) qRT-qRT-PCR is limited to locations and conditions that ensure the stability of Reverse Transcriptase; and (3) the optical signal created during qRT-PCR is physically separated from RNA, such that this technique offers no spatial information con-cerning the transcript whose presence and quantity the technique gauges. Lastly, qRT-PCR relies on a thermocycler, which in turn limits both the speed of the method and the use of this method in point-of-care setups.
Another technique commonly used to detect SNPs involves the use of molecular beacons [31]. While molecular beacons selectively detect SNPs [16, 17], their sensitivity is limited, as the maximum ratio of beacons that can be hybridized to targets is 1:1.
A technique that was demonstrated to achieve both high specificity and high sensitivity utilizes nicking enzymes in order to obtain signal amplification (NESA) [32]. However, to achieve detection independently of target sequence, the recognition site of the nicking enzyme is introduced to the target sequence via Rolling Circle Amplification. This, in turn, requires DNA ligase, DNA polymerase, and a heat block, in addition to a nicking enzyme and other PCR reagents. The use of multiple enzymes limits this detection technique both in buffer constitution and in permissible temperatures. Additionally, this detection scheme can only be employed where the enzymes’ stability is maintained.
techniques.
2.2
Detection of SNPs with Hybridization Chain Reaction
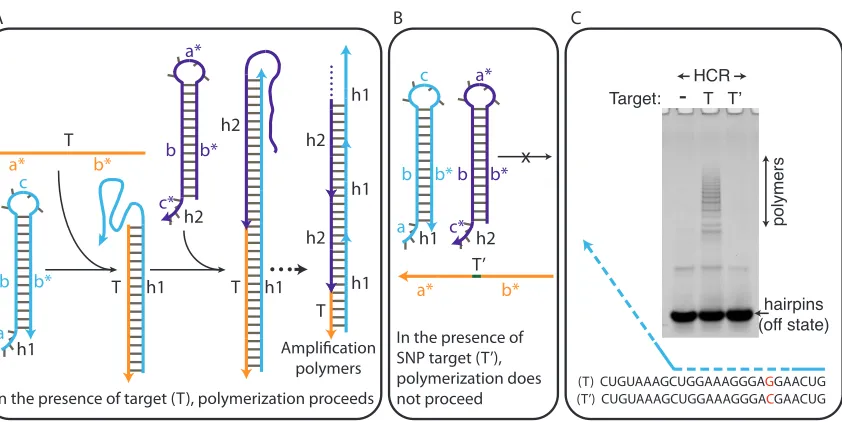
In a Hybridization Chain Reaction (HCR) [33], nucleic acid hairpins (h1 and h2) undergo isothermal, non-enzymatic self-assembly into polymers in the presence of target (T), a nucleic acid sequence with which the hairpins are designed to hybridize (Figure 2.1). HCR is initiated by a toehold-mediated branch migration of h1 in the presence of T, and it proceeds by an alternating addition of h2 and h1 to the living end of polymer (Figure 2.1, panel A). Due to the high energy of an h1·h2 intermediate, both hairpin species maintain their metastable hairpin conformation in the absence of T [34].
h1
a
h2
h2
In the presence of target (T), polymerization proceeds
h2 T
A B C
T h1 T
T h1 h1 h1 h1 h2 b b* c c* b b* a* a* b* h1 a b b* c h2 c* b b* a* T’ a* b* x polymers
(T) CUGUAAAGCUGGAAAGGGAGGAACUG (T’) CUGUAAAGCUGGAAAGGGACGAACUG
hairpins (off state)
In the presence of SNP target (T’), polymerization does not proceed Amplification
polymers
Target:
-
HCRT T’2.3
Kinetic Control of HCR via
∆
G Tuning
Because the nucleic acids utilized in HCR are metastable, the fraction of hairpins predicted to form polymers at thermodynamic equilibrium is essentially independent of target (either cognate or SNP) [34]. For this reason, HCR-mediated SNP discrimination at thermody-namic equilibrium is not predicted to be feasible. Hence, we proceed to check the feasibility of pre-equilibrium SNP detection.
We recall that HCR is initiated by the formation of either a T·h1 or a T0·h1 duplex. Once a duplex is formed, however, the rate at which hairpins are incorporated into living polymers in the subsequent steps of HCR in a T-containing test tube is about equal to the rate at which hairpins are incorporated into polymers in a T0-containing test tube. Hence, the rate of formation of T·h1 and T0·h1 at short times, i.e., while the majority of T0remains undetected, is expected to govern the duration of time during which SNP discrimination is expected to be near its optimum1. Once this time frame has passed, a non-marginal fraction of the T0 targets have turned into T0·h1 duplexes, and conversion (the fraction of hairpins that are assembled into polymers out of total hairpins) in a T0-test tube begins to approach the conversion that occurs in a T-test tube. In other words, discrimination is lost as test tubes transition from the short time scale that characterizes T polymerization to the long time scale that characterizes T0 polymerization.
Even though SNP discrimination is a transient phenomenon, we can control when SNP discrimination begins to appear (as HCR polymers in a T-containing test tube generate signal above background), and when discrimination is lost (as T0polymerization approaches T polymerization). In practice, polymerization in the absence of targets also contributes to loss of discrimination, however, target-free polymerization occurs in a longer time scale than that of T0-triggered polymerization. Controlling HCR kinetics is achieved via a principle that we refer to as ∆G tuning.
In 2009 Zhang et al. demonstrated that for short toeholds, the rate of toehold-mediated branch migration varies exponentially with the ∆G of toehold hybridization: k∼e−∆GRT [36].
Accordingly, we employ the engineering principle of ∆G tuning as a means of controlling the
1
The energetics of T·h1 formation are predicted to have less favorable energetics than all subsequent
2.4
Experimental Verification of Kinetic Control of HCR
To validate SNP detection via HCR, three different HCR systems were designed [37] accord-ing to the ∆G tunaccord-ing principle, and their conversion as a function of time was monitored in the presence of T, T0, and T00 (perfect target, a target that differs from T by an SNP, and a target that differs from T by two nucleotide substitutions, respectively). The HCR systems were designed to have characteristic time constants of discrimination of∼10 hours,
∼1 hour and a few minutes (and are thus labeled slow, medium, and fast, respectively) in
test tubes containing 1µM of each molecule. As the data presented in Figure 2.2 shows, ∆G tuning of hairpin toeholds appears to be a viable way of controlling the characteristic time constant of discrimination. Our results indicate that HCR systems can be designed to discriminate between T and T0 at a time scale of choice.
In addition to discriminating SNPs in a time scale of choice, the fast system is expected to lose its discrimination between T and T00faster than the medium speed system, which, in turn, is expected to lose its discrimination between T and T00 faster than the slow system. This expectation is supported by the data in Figure 2.2.
21 nt 30 nt 50 nt 80 nt 150 nt 300 nt 500 nt HCRslow HCRmedium HCRfast T: target T’: 1-nt mismatch T’’: 2-nt mismatch
dsRNA ladder
T Target:
monomers
T’ T’’ T T’ T’’ T T’ T’’ T T’ T’’
T T’ T’’ T T’ T’’ T T’ T’’ T T’ T’’
T T’ T’’ T T’ T’’ T T’ T’’ T T’ T’’
Target:
Target:
6 minutes
1 2 3 4 5 6 7 8 9 10 11 12 13 14 15 16
1 2 3 4 5 6 7 8 9 10 11 12 13 14 15 16 17 1 2 3 4 5 6 7 8 9 10 11 12 13 14 15 16
1 hour 10 hours 100 hours
6 minutes 1 hour 10 hours 100 hours
6 minutes 1 hour 10 hours 100 hours
T: GAUUUUGGUCUAGCUACAGAGAAAUCUCGAUGGAGU T’: GAUUUUGGUCUAGCUACAGUGAAAUCUCGAUGGAGU T’’: GAUUUUGGUCUAGCAACAGUGAAAUCUCGAUGGAGU
-4.84 -2.77 -4.81 -2.86
-4.45 -4.96 Targets Polymers monomers Targets Polymers monomers Targets Polymers
Figure 2.2: Kinetic discrimination of SNPs via HCR at a time scale of choice. The con-version of three HCR systems (labeled slow, medium, and fast, denoting systems that were designed to optimize SNP detection at the time scale of∼10 hours, ∼1 hour, and minutes, respectively) is monitored as a function of time. The fraction of hairpins that are assembled into polymers increases as a function of time with either T, T0, or T00 (a target that com-plements h1, an off-target that has an SNP when hybridized to h1, and an off-target that has two substitutions when hybridized to h1), as well as in a target-free manner. The right panel illustrates the target-nucleotides with which h1 of each of the three hairpins systems hybridizes. The red system is HCRslow; the toehold and loop of its h1 constituent are illus-trated in solid red and its stem portion is illusillus-trated with a dashed red line. HCRmedium and HCRfast appear in orange and green, respectively. The numbers that appear next to the
2.5
Effect of Mutation Location on SNP Discrimination
In the previous section, we verified that HCR discriminates between SNPs pre-equilibrium. Next, we propose a set of experiments to address the question of where an HCR system should hybridize with a T/T0 target pair to achieve an optimal discrimination ratio. We recall that HCR is initiated with a toehold-mediated branch migration of h1 in the presence of T or some off-target. Since branch migration is initiated at the toehold of h1 and is terminated in the stem portion of h1 that is closest to h1’s loop, the location along h1 at which the branch has to migrate through an SNP could possibly affect the discrimination ratio that the HCR detector achieves.
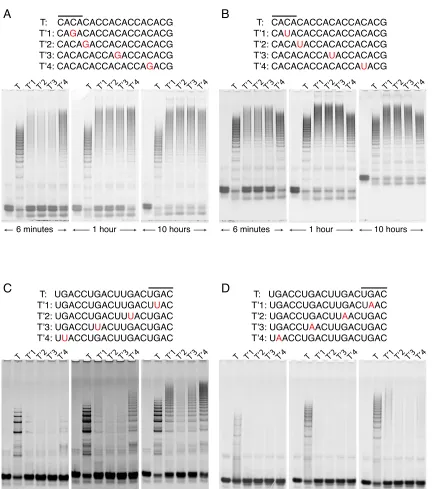
The following set of experiments was conducted in order to address this question. We designed two seed sequences lacking secondary structure2 and containing nucleotide trip-licate sequences that repeat themselves four times in the target set (Figure 2.3). Both of these seed sequences were mutated to eight daughter sequences that lack secondary struc-ture and vary from their respective parent seed sequence by an SNP. The SNP type, e.g., C→G in panel A, Figure 2.3, as well as the nearest neighbors [41] of each of the SNP loci, were conserved in four data sets that were produced from two seed sequences and sixteen daughter sequences. We then analyzed conversion as a function of mutation location at different time points.
The results of this study (Figure 2.3) suggest that SNPs located in the first half (with respect to toehold) of the stem of h1 provide discrimination ratios that are as good as, or better than, those obtained by SNPs located at either the toehold of h1 or the second half of the stem of h1. Hence, we tend to favor positioning the mutation in the first half of the stem (relative to the toehold) in an effort to increase the initial chances of success when designing new highly selective HCR systems.
2
6 minutes
T: CACACACCACACCACACG T’1: CAGACACCACACCACACG T’2: CACAGACCACACCACACG T’3: CACACACCAGACCACACG T’4: CACACACCACACCAGACG
T: CACACACCACACCACACG T’1: CAUACACCACACCACACG T’2: CACAUACCACACCACACG T’3: CACACACCAUACCACACG T’4: CACACACCACACCAUACG
T: UGACCUGACUUGACUGAC T’1: UGACCUGACUUGACUUAC T’2: UGACCUGACUUUACUGAC T’3: UGACCUUACUUGACUGAC T’4: UUACCUGACUUGACUGAC
T: UGACCUGACUUGACUGAC T’1: UGACCUGACUUGACUAAC T’2: UGACCUGACUUAACUGAC T’3: UGACCUAACUUGACUGAC T’4: UAACCUGACUUGACUGAC
1 hour 10 hours 6 minutes 1 hour 10 hours
6 minutes 1 hour 10 hours
6 minutes 1 hour 10 hours
T T’1 T’2 T’3 T’4 T T’1 T’2 T’3 T’4
T T’1 T’2 T’3 T’4 T T’1 T’2 T’3 T’4
T T’1 T’2 T’3 T’4 T T’1 T’2 T’3 T’4
T T’1 T’2 T’3 T’4 T T’1 T’2 T’3 T’4
T T’1 T’2 T’3 T’4 T T’1 T’2 T’3 T’4 T T’1 T’2 T’3 T’4 T T’1 T’2 T’3 T’4
A
B
D
C
2.6
Detection of SNP Cancer Markers
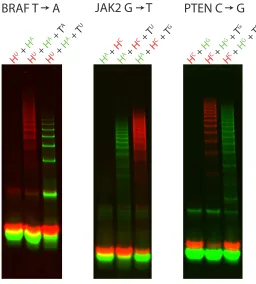
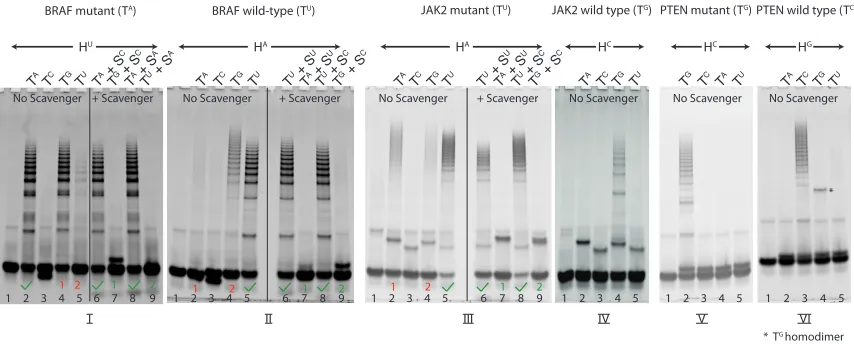
We now turn to the challenge of obtaining high levels of discrimination for an arbitrary SNP after the passage of a time period of choice, focusing on SNP cancer markers. To this end, we engineered HCR systems to detect three common SNP cancer markers, without placing any requirements on either the sequences of these targets or their secondary structures. Specifically, HCR systems were designed to detect the pervasive cancer markers BRAF 1799T→A [42–48]3, JAK2 1849G→T [2, 49, 50]4 and PTEN 388C→G [51, 52]5. Further, to demonstrate that high discrimination ratios can be obtained at a time scale of choice in a hairpin concentration of choice, we engineered the HCR systems to reach high levels of discrimination after a 1-hour incubation period at 37◦C of 1µM hairpins with 1µM targets. Three phenomena are highlighted in the results of this set of experiments (Figure 2.4). First, high selectivity is obtained for each of the three cancer markers. Second, false nega-tives are avoided by generating two distinct fluorescent signals for the wild-type and mutant sequences. Third, the use of spectrally distinct fluorophores facilitates the use of multiple HCR systems in a single test tube.
3These publications suggest that∼50% of melanoma patients carry a mutation in their BRAF gene, and
among these BRAF mutations,∼80-90% are the BRAF 1799T→A single nucleotide polymorphism.
4These publications suggest that above∼90% of polycythemia vera patients, ∼50% of essential
throm-bocythemia patients, and∼50% of primary myelofibrosis patients have the JAK2 1849G→T mutation. In
some occasions these disorders develop into malignant cancers. 5
These publications suggest that∼20% of ovarian cancer patients have some mutation in their PTEN
PTEN C G
JAK2 G T
BRAF T A
HU + HA
HU + HA +
TA
HU + HA +
TU
HC+ HG
HC+ HG +
TG
HC+ HG +
TC
HA+ HC
HA+ HC +
TU
HA+ HC +
TG
2.7
Improving HCR Discrimination with Scavenger
The discrimination ratios obtained with HCR-mediated SNP detection depend on ∆∆G of the first step of HCR (the free-energy difference between T·h1 and T0·h1). We therefore expect that HCR will provide poor discrimination ratios in the presence of SNPs that provide small ∆∆G values. Among such SNPs, the hardest to detect in RNA-RNA hybridization is G→A because the detector-target (h1U·TA) energetics are almost isoenergetic to the
detecor-off-target (h1U·TG) energetics [41, 53], thereby leading to poor discrimination ratios in the absence of Scavenger (Figure 2.5, compare lanes 2 and 3).
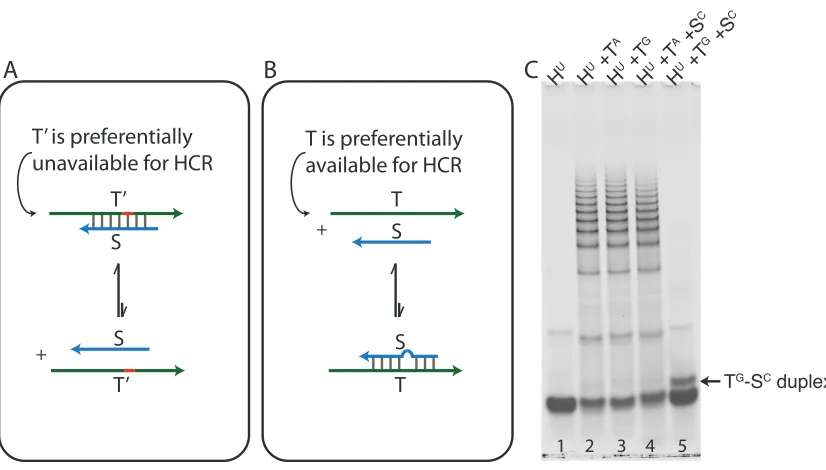
We wish to establish HCR as a tool that obtains high discrimination ratios for all possible SNPs. To achieve this goal, we introduce Scavenger as a competitive inhibitor of the nearly isoenergetic off-target. Scavenger is a single-stranded oligonucleotide that hybridizes with T0 and has an SNP when hybridized to T (Figure 2.5, panels A and B, respectively). The energetics and concentration of Scavenger are tuned such that it preferentially forms a duplex with T0 (T0·S) relatively to duplex T·S. Hence, when Scavenger and HCR are mixed together, polymerization with T0 is impeded relative to polymerization with T.
This conceptual approach is especially compelling in the case of the most-challenging SNP: G→A. For this case, HU has poor selectivity when T ≡ TA and T0 ≡ TG, because h1U·TG is nearly isoenergetic to h1U·TAthereby yielding a small ∆∆G. By contrast, Scav-enger (SC) binds strongly to TG but rejects TA, yielding a typical SNP ∆∆G. Hence, crucially, Scavenger can be selective for T0 even though HCR is not selective for T, thereby yielding HCR selectivity via competitive inhibition.
To demonstrate the utility of Scavenger, we begin with the difficult G→A substitution. HCR provides little to no selectivity for the G→A substitution (Figure 2.5, compare lanes 2–3). When the same HCR system is incubated with Scavenger, however, high discrimi-nation is obtained (Figure 2.5, lanes 4–5). To the best of our knowledge, highly selective detection of the G→A SNP in an RNA-RNA hybridization assay has not been previously demonstrated.
G A SNP
T T T’
S +
+ S
T’ S
T’ is preferentially
unavailable for HCR T is preferentially available for HCR
S
TG-SC duplex
HU HU +T
A
HU +T
A +S C
HU +T
G +S C
HU +T
G
1
A
B
C
2 3 4 5
Figure 2.5: Scavenger- and HCR-mediated SNP detection. (A, B) Scavenger is a single-stranded oligonucleotide that complements T0 and has an SNP with T. The energetics of Scavenger are chosen such that Scavenger equilibrium tends toward duplex formation in the presence of T0, but Scavenger remains mostly unhybridized in the presence of T. (C) The hardest SNP to detect in RNA-RNA hybridization is G→A, since the detector-target (HU·TA) energetics are almost isoenergetic to the energetics of the detector-off-target (HU·TG), thereby leading to diminished discrimination ratios in the absence of Scavenger (lanes 2 and 3, respectively). The presence of Scavenger dramatically improves discrimina-tion (lanes 4 and 5).
BRAF mutant (TA)
HU
TA TC TG TU TA + S C
TG + S C
TA + S A
TU + S A
TA TC TG TU TU + S U
TA + S U
TU + S C
TG + S C
TA TC TG TU TU + S U
TA + S U
TU + S C
TG + S C
TA TC TG TU TG TC TA TU
BRAF wild-type (TU) JAK2 mutant (TU) JAK2 wild type (TG) PTEN mutant (TG) PTEN wild type (TC)
TA TC TG TU
No Scavenger + Scavenger No Scavenger + Scavenger No Scavenger No Scavenger No Scavenger
1 2 1 2
1 2 1 2
* TG homodimer *
HA HA HC HC HG
1 2 3 4 5 6 7 8 9 1 2 3 4 5 6 7 8 9 1 2 3 4 5 1 2 3 4 5 1 2 3 4 5
I II III IV V VI
No Scavenger + Scavenger
1 2 1 2
1 2 3 4 5 6 7 8 9
2.8
SNP Profiling via HCR Multiplexing
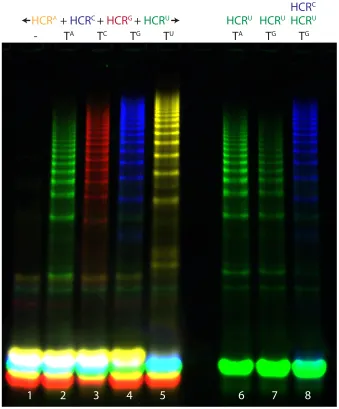
In Section 2.6 we demonstrated that multiplexing with two HCR systems in a single test tube is feasible. Since the ability to multiplex more than two genes at once is highly useful in a variety of applications including pathogenic bacteria genotyping [9, 16] and pathogenic virus genotyping [54], we sought to expand 2-color multiplexing to 4-color multiplexing. Accordingly, we proceed to demonstrate highly selective SNP profiling of four target se-quences that vary from each other by an SNP (Figure 2.7). To this end, four HCR systems, each labeled with a different fluorophore, were mixed in a single test tube. In each of the four target sequences that were tested (Figure 2.7), only one HCR system formed the ma-jority of the polymers observed in the test tube. Thus, an arbitrary nucleotide identity was selectively determined using four HCR systems in a single test tube. False negatives were avoided by generating a different signal for each of the four possible nucleotide identities.
In order to obtain optimal results from SNP profiling, i.e., reduce incorrect signal as much as possible, the kinetic behavior of the various HCR systems ought to be controlled by tuning either ∆G (Section 2.3) or the concentration of the various HCR systems. Since a concentration change is both easier to implement and more economical than a redesign of a fluorescently labeled HCR system, we adopt that approach preferentially when tuning multiple HCR systems to work at the same time point. Using the four HCR systems that are presented in Figure 2.7, we found it useful to increase the concentration of HC and HG 2× with respect to HA and HU. We increased the concentration of HC so as to inhibit HU from forming polymers with TG via G·U wobble pair formation. We increased the concentration of HG as it was relatively slow to polymerize compared to the other HCR systems. A further requirement of HCR multiplexing is that the HCR systems not share too much sequence space with each other, since this leads to mixed, multi-fluorophore-containing, polymers. Figure 2.7 depicts the sequence windows that were detected by each of the four HCR systems.
other HCR systems from hybridizing with the target. As a result, test tubes containing multiple HCR systems can exhibit higher discrimination ratios than test tubes containing a single HCR system (lanes 4 and 8 vs. 7, Figure 2.7). Multiplexing, therefore, provides a form of selective target scavenging, which results in increased selectivity.
2.9
Detection of SNPs in Long RNA
T
A-
T
CT
GT
UT
AT
GT
GHCR
A+
HCR
C+
HCR
G+
HCR
UHCR
UHCR
UHCR
HCR
UC
2
1
3
4
5
6
7
8
T
G: CUGUAAAGCUGGAAAGGGA
G
GAACUGGUGUAAUGAU
T
C: CUGUAAAGCUGGAAAGGGA
C
GAACUGGUGUAAUGAU
T
A: CUGUAAAGCUGGAAAGGGA
A
GAACUGGUGUAAUGAU
T
U: CUGUAAAGCUGGAAAGGGA
U
GAACUGGUGUAAUGAU
Figure 2.7: SNP profiling via HCR multiplexing. Each of four distinct targets triggers the polymer formation of its complementary HCR system but not of other HCR systems. The undesired polymerization that occurs in an HU+TG test tube (lane 7) is reduced in an HU+HC+TG test tube, because the target TG is scavenged by the HCR system with which TG is designed to interact (HC, lane 8). The sequence variance between the four targets
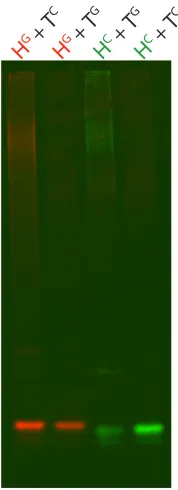
HG + T
C
HG + T
G
HC+ T
G
HC+ T
C
2.10
Conclusion
References
[1] Cantwell-Dorris, E. R., O’Leary, J. J. & Sheils, O. M. BRAFV600E: implications for carcinogenesis and molecular therapy. Molecular Cancer Therapeutics 10, 385–94 (2011).
[2] Jelinek, J.et al.JAK2 mutation 1849G>T is rare in acute leukemias but can be found in CMML, Philadelphia chromosome-negative CML, and megakaryocytic leukemia.
Blood 106, 3370–3 (2005).
[3] Kato, H. et al. Functional evaluation of p53 and PTEN gene mutations in gliomas.
Clinical Cancer Research 6, 3937–3943 (2000).
[4] Ghoussaini, M. et al. Multiple loci with different cancer specificities within the 8q24 gene desert. Journal Of The National Cancer Institute 100, 962–966 (2008).
[5] Greenman, C. et al. Patterns of somatic mutation in human cancer genomes. Nature 446, 153–8 (2007).
[6] Katz, L. S. et al. Using single-nucleotide polymorphisms to discriminate disease-associated from carried genomes of Neisseria meningitidis. Journal of Bacteriology 193, 3633–41 (2011).
[7] da Silva, T. A. et al. SNPs in DNA repair genes associated to meningitis and host immune response. Mutation Research 713, 39–47 (2011).
[8] Lin, C.-Y. et al. IL28B SNP rs12979860 is a critical predictor for on-treatment and sustained virologic response in patients with hepatitis C virus genotype-1 infection.
PloS one 6, e18322 (2011).
[10] Song, J. et al. Simultaneous pathogen detection and antibiotic resistance character-ization using SNP-based multiplexed oligonucleotide ligation-PCR (MOL-PCR). Ad-vances in Experimental Medicine and Biology 680, 455–64 (2010).
[11] Chapman, P. B. et al. Improved survival with vemurafenib in melanoma with BRAF V600E mutation. The New England Journal of Medicine 364, 2507–2516 (2011).
[12] Health, C. f. D. & Radiological. Recently-Approved Devices - cobas 4800 BRAF V600 Mutation Test - P110020.
[13] Laing, R. E., Hess, P., Shen, Y., Wang, J. & Hu, S. X. The role and impact of SNPs in pharmacogenomics and personalized medicine. Current Drug Metabolism 12, 460–86 (2011).
[14] van Ooij, C. Pharmacogenetics: A SNP for hepatitis C treatment failure. Nature Reviews Genetics 10, 738–739 (2009).
[15] Planz, J. V. et al. Enhancing resolution and statistical power by utilizing mass spec-trometry for detection of SNPs within the short tandem repeats. Forensic Science International: Genetics Supplement Series 2, 529–531 (2009).
[16] Marras, S. A., Russell Kramer, F. & Tyagi, S. Multiplex detection of single-nucleotide variations using molecular beacons. Genetic Analysis: Biomolecular Engineering 14, 151–156 (1999).
[17] Mhlanga, M. M. & Malmberg, L. Using molecular beacons to detect single-nucleotide polymorphisms with real-time PCR. Methods 25, 463–71 (2001).
[18] Ye, S., Dhillon, S., Ke, X., Collins, A. R. & Day, I. N. M. An efficient procedure for genotyping single nucleotide polymorphisms. Nucleic Acids Research 29, e88 (2001).
[20] Brockman, W. et al. Quality scores and SNP detection in sequencing-by-synthesis systems. Genome Research 18, 763–70 (2008).
[21] Brizova, H., Kalinova, M., Krskova, L., Mrhalova, M. & Kodet, R. Quantitative mea-surement of cyclin D1 mRNA, a potent diagnostic tool to separate mantle cell lym-phoma from other B-cell lymphoproliferative disorders.Diagnostic Molecular Pathology 17, 39–50 (2008).
[22] Tiveljung-Lindell, A.et al.Development and implementation of a molecular diagnostic platform for daily rapid detection of 15 respiratory viruses.Journal of Medical Virology 81, 167–175 (2009).
[23] Ragoussis, J. & Elvidge, G. Affymetrix GeneChip system: moving from research to the clinic. Expert Review of Molecular Diagnostics 6, 145–152 (2006).
[24] Li, R.et al. SNP detection for massively parallel whole-genome resequencing. Genome Research 19, 1124–32 (2009).
[25] Zhang, J., Finney, R. P., Clifford, R. J., Derr, L. K. & Buetow, K. H. Detecting false expression signals in high-density oligonucleotide arrays by an in silico approach.
Genomics 85, 297–308 (2005).
[26] Draghici, S., Khatri, P., Eklund, A. C. & Szallasi, Z. Reliability and reproducibility issues in DNA microarray measurements. Trends in Genetics 22, 101–9 (2006).
[27] Bustin, S. Absolute quantification of mRNA using real-time reverse transcription poly-merase chain reaction assays. Journal of Molecular Endocrinology 25, 169–193 (2000).
[28] Corless, C. E. et al. Contamination and sensitivity issues with a real-time universal 16S rRNA PCR. Journal of Clinical Microbiology 38, 1747–52 (2000).
[30] Bustin, S. A. Molecular medicine, gene-expression profiling and molecular diagnostics: putting the cart before the horse. Biomarkers in Medicine 2, 201–7 (2008).
[31] Tyagi, S. & Kramer, F. R. Molecular beacons: probes that fluoresce upon hybridization.
Nature Biotechnology 14, 303–308 (1996).
[32] Li, J. J., Chu, Y., Lee, B. Y.-H. & Xie, X. S. Enzymatic signal amplification of molecular beacons for sensitive DNA detection.Nucleic Acids Research36, e36 (2008).
[33] Dirks, R. M. & Pierce, N. A. Triggered amplification by hybridization chain reaction.
Proceedings of the National Academy of Sciences of the United States of America 101, 15275–8 (2004).
[34] Beck, V. A. Personal communication (2010).
[35] Demidov, V. V. & Frank-Kamenetskii, M. D. Two sides of the coin: affinity and speci-ficity of nucleic acid interactions. Trends in Biochemical Sciences 29, 62–71 (2004).
[36] Zhang, D. Y. & Winfree, E. Control of DNA strand displacement kinetics using toehold exchange. Journal of the American Chemical Society 131, 17303–17314 (2009).
[37] Zadeh, J. N., Wolfe, B. R. & Pierce, N. A. Nucleic acid sequence design via efficient ensemble defect optimization.Journal of Computational Chemistry 32, 439–452 (2011).
[38] Dirks, R. M. & Pierce, N. A. An algorithm for computing nucleic acid base-pairing probabilities including pseudoknots. Journal of Computational Chemistry 25, 1295– 1304 (2004).
[39] Dirks, R. M., Bois, J. S., Schaeffer, J. M., Winfree, E. & Pierce, N. A. Thermodynamic Analysis of Interacting Nucleic Acid Strands. SIAM Review 49, 65 (2007).
[40] Zadeh, J. N.et al. NUPACK: Analysis and design of nucleic acid systems. Journal of Computational Chemistry 32, 170–173 (2011).
[42] Davies, H.et al. Mutations of the BRAF gene in human cancer. Nature 417, 949–54 (2002).
[43] Maldonado, J. L. et al. Determinants of BRAF mutations in primary melanomas.
Journal of the National Cancer Institute 95, 1878–90 (2003).
[44] Uribe, P., Wistuba, I. I. & Gonz´alez, S. BRAF mutation: a frequent event in benign, atypical, and malignant melanocytic lesions of the skin. The American Journal of Dermatopathology 25, 365–370 (2003).
[45] N Poynter, J. et al. BRAF and NRAS mutations in melanoma and melanocytic nevi.
Melanoma Research 16, 267–273 (2006).
[46] Rubinstein, J. C. et al. Incidence of the V600K mutation among melanoma patients with BRAF mutations, and potential therapeutic response to the specific BRAF in-hibitor PLX4032. Journal of translational medicine 8, 67 (2010).
[47] Lovly, C. M. et al. Routine multiplex mutational profiling of melanomas enables en-rollment in genotype-driven therapeutic trials. PloS One 7, e35309 (2012).
[48] Ascierto, P. A. et al. The role of BRAF V600 mutation in melanoma. Journal of Translational Medicine 10, 85 (2012).
[49] Steensma, D. P. JAK2 V617F in myeloid disorders: molecular diagnostic techniques and their clinical utility. The Journal of Molecular Diagnostics 8, 397–411 (2006).
[50] Murugesan, G. et al. Identification of the JAK2 V617F mutation in chronic myelopro-liferative disorders using FRET probes and melting curve analysis. American Journal of Clinical Pathology 125, 625–633 (2006).
[51] Kanaya, T.et al. Association of mismatch repair deficiency with PTEN frameshift mu-tations in endometrial cancers and the precursors in a Japanese population. American Journal of Clinical Pathology 124, 89–96 (2005).
[53] Mathews, D. H., Sabina, J., Zuker, M. & Turner, D. H. Expanded sequence depen-dence of thermodynamic parameters improves prediction of RNA secondary structure.
Journal of Molecular Biology 288, 911–40 (1999).
Chapter 3
Transducing Sequence to Light
with Quenched HCR
3.1
Introduction
Molecular beacons [1] are nucleic acid sequences that fold into a toehold-free hairpin struc-ture. Upon hybridization with a target of choice via their loop domain, molecular beacons undergo a conformational change that disrupts the integrity of their stem. As the 50-end of molecular beacons is conjugated to a fluorophore and their 30-end is conjugated to a quencher, hybridization to target disrupts their fluorophore-quencher FRET pair. This, in turn, leads to an increase in emitted fluorescence. Because molecular beacons directly hy-bridize with nucleic acid targets and offer high sequence selectivity, they have found broad use in biological applications. Some examples include SNP detection in homogenous so-lution [2], in situ RNA imaging [3], and dynamic monitoring of RNA in live cells [4–6]. While the isothermal, direct mode of target detection provided by molecular beacons has facilitated their broad use, the fact that a maximum of one molecular beacon can hybridize with a target site has limited their sensitivity to the nanomolar scale [7].
transcription PCR (qRT-PCR).” Since qRT-PCR is both sensitive and semi-quantitative1, it has recently found some diagnostic use. At the same time, the sensitivity improvement seen with qRT-PCR requires the use of a thermocycler. Large, expensive, and in need of continuous electricity supply, thermocyclers limit the use of qRT-PCR as a point-of-care diagnostic on the one hand, and render qRT-PCR unsuitable for both in situ and live cell applications on the other hand.
In an attempt to capture the isothermal mode of detection offered by molecular beacons while simultaneously achieving target amplification, Li et al. developed the Nicking Enzyme Signal Amplification (NESA) method and obtained ∼6.2pM sensitivity [9]. At the same time, to create the recognition sequence2 required by the nicking enzyme with a target of choice, the authors incorporated heat inactivation steps into their protocol, thus re-introducing the dependence on a thermocycler. As NESA requires both a thermocycler and enzymes (DNA ligase and DNA polymerase), NESA’s limitations in a point-of-care setup are similar to those faced by qRT-PCR.
In this chapter, we explore Quenched HCR as a new method for nucleic acid detection in bulk. We recall from Section 2.2 that HCR entails the self-assembly of hairpins into polymers in the presence of a target sequence with which the hairpins are designed to hybridize [10]. To date, all applications in which direct readout of HCR polymers was sought required either gel analysis [10], immobilization to surfaces [11], or tethering to immobilized RNAin situ followed by a wash [12]. Here, we discuss Quenched HCR, as the first wash-free method for HCR readout in bulk. Quenched HCR combines some of the positive attributes of molecular beacons with those of qRT-PCR. like molecular beacons, Quenched HCR offers an isothermal, non-enzymatic mode of detection. Like qRT-PCR, Quenched HCR provides signal amplification, though not to the same extent. For these reasons, we propose that Quenched HCR may be integrated intoin vitro applications, e.g., diagnostics, and expression profiling in a lysate, in situ applications, e.g., HCR-ISH [12],
1A comparison of the fluorescent signal generated by a transcript of interest (via the transcript’s cDNA
proxy) and analogous fluorescent signals generated by multiple housekeeping genes, provides quantitative ratios.
2
and possibly, live cell applications, e.g., cell sorting.
3.2
Design of 2-Hairpin and 4-Hairpin Quenched HCR
We sought to design Quenched HCR systems that polymerize in the time scale of dozens of minutes or more so as to allow Quenched HCR optical measurement from∼t0and onwards.
Accordingly, DNA hairpins composed of toehold/loop sizes of 6-nt, and stem sizes of 18– 19-nt were designed. The domain sizes and sequence compositions of hairpins were chosen such that the free energy [13, 14] of the hairpins’ stems is≥25 kcal/mol, and the free energy of their toehold and loop domains is 7–10.5 kcal/mol3.
The design of Quenched HCR systems necessitates consideration of the distance between the fluorophore and quencher. This distance, which is mostly controlled by the ∆G4between the fluorophore and quencher, and the length and flexibility of the linkers used to conjugate these two moieties, ought to be within the range of quenching in the hairpin conformation and mostly out of the range of quenching in the polymer conformation. Hence, we required that the quencher be placed in the 50-end or 30-end of h1 (in accordance with IDT’s catalog orders), and that the fluorophore be placed across from the quencher (internally, between the toehold and the stem domains, as is illustrated in Figure 3.1, panels A, B).
The combination of these design criteria, for the relatively small-toehold systems we fo-cused on, suggests that the use of 4-hairpin-periodicity Quenched HCR (Figure 3.1, panel A) is preferable to the use of 2-hairpin-periodicity Quenched HCR (Figure 3.1, panel B). In 4-hairpin-periodicity Quenched HCR, the distance between the fluorophore and the quencher in the polymer conformation is increased via the insertion of “insulating,” unlabeled hair-pins between every dually labeled hairpin and its nearest neighbor on the same side of the double-helix HCR polymers. In 2-hairpin Quenched HCR, the distance between the
3
NUPACK calculations were based on parameters that were obtained by SantaLucia et al. [14]. Calcula-tions did not account for the ∆G contribution of fluorophore-quencher modificaCalcula-tions. Toehold and loop free energy calculations utilized the sequences of these domains and their reverse DNA complements, without considering the nearest neighbors of these two domains. Lastly, the free energy range of 7–10.5 kcal/mol
characterizes elongation steps of the HCR reaction, but does not characterize the free energy of T·h1
for-mation from T and h1, since this free energy value is derived from the addition of an DNA h1 to an RNA target.
4Differences in ∆∆G between hairpins that are modified with fluorophore-quencher pairs and their
fluorophore and quencher within the polymer can be too small (Figure 3.1 panel B). With internally labeled 2-hairpin Quenched HCR (Figure 3.1 panel C), however, the distance be-tween the quencher and the fluorophore within the polymer is predicted to be large enough to facilitate the use of small DNA hairpins of toehold / loop sizes of 6-nt, and stem sizes of 18–19-nt. Internally-labeled 2-hairpin Quenched HCR was not studied here, because inter-nally labeled hairpins are difficult to synthesize. We note that quenching distance drops as
1
R6, where R is the distance between the fluorophore and quencher [15], and for our choice
of quenchers, the distance in which the quencher is at ∼50% efficiency is reported to be between 3–7nm by the manufacturer (IDT) [16].
Lastly, two fluorophore-quencher pairs with minimal cross-talk were chosen so as to allow for multiplexing. As Integrated DNA Technologies (IDT) offer a limited set of five different internal fluorophore modifications (6-FAMK, Fluorescein, Cy3, TAMRA and Cy5), the maximum number of spectrally distinct Quenched HCR systems (known to be sufficiently resistant to photobleaching) that we could test was two. Accordingly, Cy3 and Cy5 were chosen as the fluorophores with which to label the Quenched HCR systems.
3.3
Analysis of 2-Hairpin and 4-Hairpin Quenched HCR
To demonstrate the feasibility of Quenched HCR without placing any requirements on the sequences of the Quenched HCR systems, the mutated states of three of the most-commonly occurring SNPs in cancer were chosen as targets: BRAF T→A, JAK2 G→T, and PTEN C→G, denoted by T1, T2, and T3, respectively.
h1 h1 h1 h1 a h2 h2 h2 T T h2 T h1 h1 h1 h2 h2 T h1 h1 b b* c h1 a b b* c c* b b* a* h2 T h1 T Quenched conformation h2 c* b b* a* Quenched conformation a* b*
Internally Labeled 2-Hairpin-Periodicity Quenched HCR 4-Hairpin-Periodicity Quenched HCR
h1 a h2 h2 h4 T T h1 h1 h2 T h1 h1 h3 h2 h4 T h1 h3 b b* c h3 d* b b* e c* b b* d h4 e* b b* a*
Fluorescene-emitting amplification polymers The fluorophore and quencher are pulled apart, and hence, fluorescence is emitted
h2 T h1 T Quenched conformation a* b*
2-Hairpin-Periodicity Quenched HCR
h1 a h2 h2 h2 T T h2 T h1 h1 h1 h2 h2 T h1 h1 b b* c h1 a b b* c c* b b* a* h2 T h1 T Quenched conformation h2 c* b b* a* Quenched conformation a* b* h1 h1 h1 A B C
In the presence of target (T), polymerization is initiated
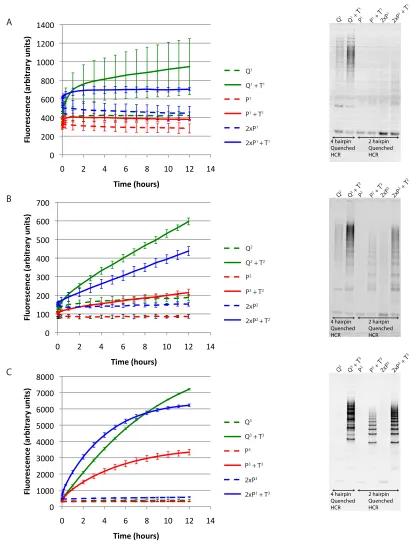
To analyze Quenched HCR, we designed 2-hairpin-periodicity and 4-hairpin-periodicity Quenched HCR systems that detect cancer markers BRAF T→A, JAK2 G→T, and PTEN C→G (Section 2.6). We denote these targets as T1, T2, and T3, respectively, the 2-hairpin-periodicity Quenched HCR systems that detect them as P1, P2, and P3, respectively, and
the 4-hairpin-periodicity Quenched HCR that detect the targets as Q1, Q2, and Q3, re-spectively. As demonstrated in Figure 3.2, 4-hairpin-periodicity Quenched HCR systems were successfully designed for all three targets. Among the 2-hairpin-periodicity Quenched HCR systems that were tested, P3 and P2 were successfully implemented, with the for-mer performing better. As expected (Section 3.2), 4-hairpin-periodicity Quenched HCR outperformed 2-hairpin-periodicity Quenched HCR.
In addition to engineering 4-hairpin Quenched HCR in a long time scale, focusing on monitoring the kinetic performance of Quenched HCR starting at ∼t0, we also designed a
fast Quenched HCR system (Figure B.4). Guided by the ∆G tuning principle (Section 2.3), fast Quenched HCR utilized hairpins of toehold / loop sizes of 10-nt, and stem sizes of 26-nt. Since 10-nt toeholds were used in this instance, as opposed to the 6-nt toeholds utilized in Figure 3.2, fast Quenched HCR utilized 2-hairpin periodicity (Figure 3.1, panel B). Lastly, we note that an RNA-based 4-hairpin periodicity Quenched HCR was also designed, and successfully implemented (Appendix B.3).
3.4
Multiplexing Quenched HCR
The utilization of fluorophores that emit at different wavelengths allows for multiplexed gene detection in a single test tube. To demonstrate this, two test tube compositions (T2 + Q2 + Q3, and T3 + Q2 + Q3) are analyzed in this section; additional conditions are presented in Figure B.1. The total fluorescence traces generated from this study demonstrate that multiplex Quenched HCR performs well: both test tubes produce monotonically increasing optical trace for the Quenched HCR system that they are expected to turn ‘on,’ but not for the Quenched HCR system that should be kept ‘off’ (Figure 3.3).
!" #!!" $!!" %!!" &!!" '!!!" '#!!" '$!!"
!" #" $" %" &" '!" '#" '$"
!"#$% &'(&)(&*+ ,%-./% ,% 0*#)./'1 * 2.3&*+4$#%'1* ""('" ""(')*'" ""+'" ""+')*'" ""#,+'" ""#,+')*'" !" #!!" $!!" %!!" &!!" '!!" (!!" )!!"
!" $" &" (" *" #!" #$" #&"
!"#$% &'(&)(&*+ ,%-./% ,% 0*#)./'1 * 2.3&*+4$#%'1* ""+$" ""+$,-$" "".$" "".$,-$" ""$/.$" ""$/.$,-$" !" #!!!" $!!!" %!!!" &!!!" '!!!" (!!!" )!!!" *!!!"
!" $" &" (" *" #!" #$" #&"
!"#$% &'(&)(&*+ ,%-./% ,% 0*#)./'1 * 2.3&*+4$#%'1* ""+%" ""+%,-%" "".%" "".%,-%" ""$/.%" ""$/.%,-%" A B C
Q2 Q2 +
T2
P2
P2 + T
2
2xP
2
2xP
2 + T
2
Q3 Q3 +
T3
P3
P3 + T
3
2xP
3
2xP
3 + T
3
Q1 Q1 +
T1
P1 P1 + T
1
2xP
1
2xP
1 + T
1 4 hairpin Quenched HCR 2 hairpin Quenched HCR 4 hairpin Quenched HCR 2 hairpin Quenched HCR 4 hairpin Quenched HCR 2 hairpin Quenched HCR Q1
Q1 + T1
P1 P1 + T1
2xP1 2xP1 + T1
Q2
P2
P2 + T2 2xP2
2xP2 + T2 Q2 + T2
Q3
Q3 + T3 P3
P3 + T3
2xP3
2xP3 + T3
!" !#$" !#%" !#&" !#'" (" (#$" (#%"
!" $" %" &" '" (!" ($" (%"
!"#
$
%&'(
)*+,-"+$
%.
/+$
)%01#
)*2+3
1"#
)04
)54
)+
6'$)+,7"1#02+
T
2test tube
Q
2readout
Q
3readout
T
3test tube
T
2test tube
T
3test tube
Figure 3.3: Multiplex detection of cancer gene markers. Two test tubes containing either the JAK2 cancer marker T2 or the PTEN cancer marker T3 were incubated in the presence of two 4-hairpin-periodicity Quenched HCR systems (Q2 and Q3 designed to detect T2 and T3, respectively). Each of the test tubes reveals an increase in signal with time in a manner that agrees with its target gene content. Quenched HCR system 2 is labeled with Cy3, and is monitored using 515–530nm excitation filter and a 560–580nm emission filter. Quenched HCR system 3 is labeled with Cy5, and is monitored using 620–650nm excitation filter and 675-690nm emission filter. Plotted data represent mean and standard deviation of two experiments, normalized by the maximum mean value in each channel.
provide some indication5 of the extent to which the dually labeled hairpin is quenched, where the closer the intersection is to zero, the more quenched the dually labeled hairpin. With respect to this, we note that the Cy5-labeled system that detects T3 appears more quenched than the Cy3-labeled system that detects T2. This agrees with the data collected in the single-channel experiments (Figure 3.2).
5The exact interpretation of the intersect with the y-axis is the ratio between total signal that is
3.5
Conclusion
Quenched HCR using DNA or RNA hairpins (Figure B.3) was demonstrated to selectively detect RNA targets. Quenched HCR can be parallelized when usedin vitro; in our experi-ments we analyzed as many as 36 test tubes at the same time, but the upper limit, which depends on the optical device used, is significantly higher.
In its basic in vitro implementation, HCR requires the use of an additional assay to determine the extent to which polymers are present in solution. Traditionally, this assay takes the form of gel electrophoresis.
Quenched HCR has solved, or ameliorated, four problems that pertain to gel analysis of HCR. First, single-time-point monitoring of HCR polymers, as provided by gel analysis, can be replaced with continuous monitoring of the polymerization signal. Second, the time (normally ∼ 30 minutes or more) that elapses between an HCR reaction and the completion of both the gel run and the gel imaging has been effectively reduced to zero. Third, the materials, chemical waste, and costs associated with running a gel have also been dramatically reduced. Fourth, the challenge of quantifying often blurred bands from the background of a gel, which is not transparent through a large portion of the visible light spectrum, has been eliminated, and instead, an instrument that monitors fluorescence is required [17].
References
[1] Tyagi, S. & Kramer, F. R. Molecular beacons: probes that fluoresce upon hybridization.
Nature Biotechnology 14, 303–308 (1996).
[2] Tyagi, S., Bratu, D. P. & Kramer, F. R. Multicolor molecular beacons for allele discrimination. Nature Biotechnology 16, 49–53 (1998).
[3] Lenaerts, J., Lappin-Scott, H. M. & Porter, J. Improved fluorescent in situ hybridiza-tion method for detechybridiza-tion of bacteria from activated sludge and river water by using DNA molecular beacons and flow cytometry. Applied and Environmental Microbiology 73, 2020–3 (2007).
[4] Bratu, D. P., Cha, B.-J., Mhlanga, M. M., Kramer, F. R. & Tyagi, S. Visualizing the distribution and transport of mRNAs in living cells. Proceedings of the National Academy of Sciences of the United States of America 100, 13308–13313 (2003).
[5] Mhlanga, M. M., Vargas, D. Y., Fung, C. W., Kramer, F. R. & Tyagi, S. tRNA-linked molecular beacons for imaging mRNAs in the cytoplasm of living cells. Nucleic Acids Research 33, 1902–1912 (2005).
[6] Bratu, D. P., Catrina, I. E. & Marras, S. A. E. Tiny molecular beacons for in vivo mRNA detection. Methods in Molecular Biology (Clifton, N.J.) 714, 141–57 (2011).
[7] Zhang, P., Beck, T. & Tan, W. Design of a Molecular Beacon DNA Probe with Two Fluorophores. Angewandte Chemie (International ed. in English) 40, 402–405 (2001).
[8] Manganelli, R., Tyagi, S. & Smith, I. Real Time PCR Using Molecular Beacons : A New Tool to Identify Point Mutations and to Analyze Gene Expression in Mycobac-terium tuberculosis. Methods in Molecular Medicine 54, 295–310 (2001).
[9] Li, J. J., Chu, Y., Lee, B. Y.-H. & Xie, X. S. Enzymatic signal amplification of molecular beacons for sensitive DNA detection.Nucleic Acids Research36, e36 (2008).
Proceedings of the National Academy of Sciences of the United States of America 101, 15275–8 (2004).
[11] Yang, L., Liu, C., Ren, W. & Li, Z. Graphene surface-anchored fluorescence sensor for sensitive detection of microRNA coupled with enzyme-free signal amplification of hybridization chain reaction. ACS Applied Materials & Interfaces 4, 6450–3 (2012).
[12] Choi, H. M. T. et al. Programmable in situ amplification for multiplexed imaging of mRNA expression. Nature Biotechnology 28, 1208–1212 (2010).
[13] Zadeh, J. N., Wolfe, B. R. & Pierce, N. A. Nucleic acid sequence design via efficient ensemble defect optimization.Journal of Computational Chemistry 32, 439–452 (2011).
[14] SantaLucia, J. A unified view of polymer, dumbbell, and oligonucleotide DNA nearest-neighbor thermodynamics. Proceedings of the National Academy of Sciences 95, 1460– 1465 (1998).
[15] Lackowicz Joseph R.Principles of Fluorescence Spectroscopy (Google eBook)(Springer, 2009).
[16] Integrated DNA Technologies - Probes. URL http://www.idtdna.com/catalog/
DNaProbes/Page1.aspx.
Chapter 4
Sequence Transduction with
Conditional Probes
4.1
Introduction
As was discussed in Chapter 2, HCR is a fast, enzyme-free, isothermal, selective nucleic acid detector. While these properties suggest that HCR could be used as a diagnostic, the dependence of HCR on a gel-based [1], or immobilization-based assay [2] for purposes of differentiating between HCR polymers and hairpin-monomers diminishes the utility of HCR in some diagnostic settings.
In Chapter 3 we discussed Quenched HCR, which was developed to eliminate HCR’s dependence on gel electrophoresis. Quenched HCR is a technique that measures fluorescent signal as a proxy for polymer formation, thus eliminating the loss of time and reagents associated with running gel electrophoresis. While Quenched HCR maintains many of the positive attributes of HCR, Quenched HCR also poses non-trivial synthesis challenges. Specifically, the dually labeled molecules that Quenched HCR requires are costly and time-consuming to generate.
There is, therefore, a need for a molecule that hybridizes with both a target sequence of choice and Quenched HCR. A transducer molecule of this nature would allow for the detection of a target of choice using Quenched HCR without the need to design, synthesize, and run quality control experiments on Quenched HCR systems every time the detection of a new gene is sought.
the transducer must be conditional, that is, the transducer should only expose an initiator sequence for the cognate Quenched HCR, or other triggered hybridization system of choice, if target is present. An unconditional probe, by comparison, would trigger the formation of Quenched HCR independent of the absence/presence of target, thus removing the diagnostic capability of Quenched HCR. Since the probe design discussed in this chapter is conditional, we refer to it as “Conditional Probe,” or “CP.”
Conditional Probe executes molecular logic similar to that of molecular beacons. Molec-ular beacons are nucleic acids that assume a stem-loop structure in the absence of target, but lose the integrity of their stems in the presence of target (Figure 4.1 panel A) [3]. Molecular beacons can therefore be viewed as conditional probes that undergo a triggered reaction wherein their stem-sequestered sequences turn into single-stranded sequences only in the presence of target. Hence, these molecules carry out the following logic operation: in the presence of sequence A, expose sequence space B. Although molecular beacons are inherently conditional sequence transducers, they have found very limited use as such, and instead have been used primarily as fluorescent reporters1. The design of CP is inspired by molecular beacons. Unlike molecular beacons that transduce sequence A-to-light, however, we propose to engineer CPs to transduce sequence A-to-sequence B.
Upon hybridization with a target, via the CP loop, the stem of CP is disrupted, exposing single stranded tails that can serve as initiators for other reactions. For our purposes, the motif we wish to turn ‘on’ in the presence of target and CP is Quenched HCR.
Other groups have utilized sequence transducers. Seelig et al. [4], for example, have implemented a sequence transducer based on strand displacement reactions using duplexes. Special care is required when duplex molecular motifs are introduced to biological samples, since an excess of one strand over the other can lead to false positives. With Seelig’s sequence transducer, the output sequence is released upon detection of the input sequence. By comparison, the unimolecular CP studied here remains bound to target, and is thus suitable forin situ applications and for substrate-based assays.
Wilner