Developing High-Affinity Protein Capture Agents
and Nanotechnology-Based Platforms for In Vitro Diagnostics
Thesis by
Rosemary Dyane Rohde
In Partial Fulfillment of the Requirements for the Degree of
Doctor of Philosophy
California Institute of Technology Pasadena, California
2009
© 2009
This thesis is dedicated to my Mom for her unconditional and everlasting love and support.
Acknowledgements
Lai, and Dr. Bruce Brunschwig for their teachings and help with experiments.
I greatly appreciate the Bill and Melinda Gates Foundation for supporting my education, including my undergraduate studies at UCLA. I thank the Genomics Facility for use of the Genepix 4200 array scanner. ESI- and MALDI-MS analysis was completed by the Protein/Peptide MicroAnalytical Laboratory. Fluorescence polarization experiments were done in the Beckman Institute Laser Resource Center. SPR experiments were performed in the Protein Expression Center, under the direction of Jost Vielmetter. I thank Carl S. Parker for assistance with dot blot experiments.
Abstract
diagnostics measurements are pauciparameter. Fifth, the sensitivity, specificity, and/or dynamic range of the biomarker detection strategies are often limited.
A general method for the non-oxidative functionalization of single-crystal silicon (111) is described in Chapter 1. The general approach is to start with a silicon-on-insulator (SOI) wafer. A SOI wafer is comprised of a thin, single-crystal silicon film (~ 30–50 nm) on top of a thick, insulating SiO2 layer (on the order of microns). It is from this SOI layer that the nanowire sensors are fabricated. The silicon film, unless specially treated, is naturally passivated with a thin (1–2 nm thick) native oxide (SiO2) layer as described above. To remove the native oxide, the silicon surface is fully acetylenylated (-C≡CH), thus preventing the growth of oxidation. Additionally, the -C≡CH group also provides a chemical handle for additional functionalization via the ‘click’ reaction25,26 between an azide containing benzoquinone (masked with a primary amine) and the surface-bound alkyne. The benzoquinone is electrochemically reduced, exposing the amine terminus. During this process, minimal oxidation is present. Molecules presenting a carboxylic acid have been immobilized to the exposed amine sites. This strategy provides a general platform that can incorporate organic and biological molecules on Si (111) with minimal oxidation of the silicon surface. This method can further be extended towards the selective biopassivation of capture agent arrays of nanoelectronic sensor devices.
The development of these devices is, in part, driven by early diagnosis, differential treatment, monitoring, and personalized medicine— all of which are
protein-biomarker-based in vitro diagnostics inexpensive involves developing capture agents to detect the proteins. In the content of this thesis, a capture agent is a biochemical
molecule that has specificity for a distinct target molecule and can be naturally derived and/or synthetic. A major thrust of this thesis is to develop multi-valent, high-affinity and high-selectivity protein capture agents using in situ click chemistry.27–30 In situ click chemistry is a tool that utilizes the protein itself to catalyze the formation of a biligand from individual azide and alkyne ligands that are co-localized. Large libraries of peptides are used to form the body of these ligands, also providing high chemical diversity and protease stability, with minimal synthetic effort. Peptide-based moderate-affinity lead compounds can be isolated from a 2-generation screen of the protein against a one-bead one-compound (OBOC) library. By modifying that peptide with appropriate alkyne or azide functionalities, that peptide becomes an anchor (1°) ligand, and part of the capture agent. Simultaneously screening the protein against this single anchor ligand and a large library of click-complementary secondary (2°) ligands constitutes our strategy for identifying biligand capture agents. The protein target holds the two peptide-units in close proximity promoting the covalent coupling between the azide and alkyne moieties. This process can be repeated— the biligand capture agent can serve as the new anchor unit and the same OBOC library can be employed to identify a triligand, tetraligand, and so forth. The addition of each ligand to the capture agent causes the affinity and
serum. In situ click chemistry screens are shown to yield results identical to more traditional OBOC screens, but the in situ screens permit orders of magnitude more chemical space to be sampled. Moreover, the resulting multiligand protein capture agents can be produced in gram-scale quantities using conventional synthetic methods with designed control over chemical and biochemical stability and water solubility.
Chapter 2 will cover the synthesis of the azide containing artificial amino acids at the multi-gram quantity scale. The construction of large (up to 20 million elements on 100 million beads) peptide libraries for screening, including bulk peptide synthesis and on-bead click reaction will be discussed. Bead-based library screening procedures will be reviewed. Analysis of lead compounds by Edman degradation will be introduced, including calibrating peptide-sequencing equipment so artificial amino acids can be identified.
References:
1. Hood, L.; Heath, J. R.; Phelps, M. E.; Lin, B. Y. Science 2004, 306, 640–643. 2. Fan, R.; Vermesh, O.; Srivastava, A.; Yen, B.; Qin, L.; Ahmad, H.; Kwong, G.;
Liu, C.; Gould, J.; Hood, L.; Heath, J. R. Nature Biotechnology 2008, 26, 1373– 1378.
3. Davidson, E. H., et al. Science 2002, 295, (5560), 1669–1678. 4. Kitano, H. Science 2002, 295, (5560), 1662–1664.
5. Ludwig, J. A.; Weinstein, J. N. Nature 2005, 5, 845–856.
6. Toner, M.; Irimia, D. Annu. Rev. Biomed. Eng. 2005, 7, 77–103. 7. Yang, S.; Undar, A.; Zahn, J. D. Lab Chip 2006, 6, 871–880. 8. Fritz, J., et al. Science 2000, 288, 316.
9. Cui, Y.; Wei, Q.; Park, H.; Lieber, C. M. Science 2001, 293, 1289. 10. Chen, R. J., et al. Proc. Natl. Acad. Sci. U.S.A. 2003, 100, 4984. 11. Patolsky, F.; Lieber, C. M. Mater. Today 2005, 8, 20.
12. Bunimovich, Y. L.; Shin, Y.-S.; Yeo, W.-S.; Amori, M.; Kwong, G.; Heath, J. R. J. Am. Chem. Soc. 2006, 128, 16323–16331.
13. Lee, J. F.; Hesselberth, J. R.; Meyers, L. A.; Ellington, A. D. Nucleic Acids Res. 2004, 32, D95–D100.
14. Fabian, M. A., et al. Nat. Biotechnol. 2005, 23, 329–336. 15. Smith, G. P.; Petrenko, V. A. Chem. Rev. 1997, 97, 391–410. 16. Lam, K. S.; Lebl, M.; Krchňák, V. Chem. Rev. 1997, 97, 411–448.
17. Agnew, H. D.; Rohde, R. D.; Millward, S. W.; Nag, A.; Yeo, W.-S.; Hein, J. E.; Pitram, S. M.; Tariq, A.-A.; Burns, V. M.; Krom, R. J.; Fokin, V. V.; Sharpless, B. K.; Heath, J. R. Angew. Chem. Int. Ed. 2009, accepted.
18. Cui, J., Liu, Q., Puett, D., Xu, Y. Bioinformatics 2008, 24, 2370–2375. 19. Davidson, E. H., et al. Science 2002, 295, 1669–1678.
20. Kitano, H. Science 2002, 295, 1662–1664.
22. Zheng, G.; Patolsky, F.; Cui, Y.; Wang, W. U.; Lieber, C. M. Nature Biotechnol. 2005, 23, 1294, and references therein.
23. Hu, K.; Fan, F.-R. F.; Bard, A. J.; Hillier, A. C. J. Phys. Chem. B 1997, 101, 8298.
24. Yablonovitch, E.; Allara, D. L.; Chang, C. C.; Gmitter, T.; Bright, T. B. Phys. Rev. Lett. 1986, 57, 249.
25. Kolb, H. C.; Finn, M. G., Sharpless, K. B. Angew. Chem., Int. Ed. 2001, 40, 2004.
26. Bock, V. D.; Hiemstra, H.; van Maarseveen, J. H. Eur. J. Org. Chem. 2006, 51, and references therein.
27. Lewis, W. G.; Green, L. G.; Grynszpan, F.; Radić, Z.; Carlier, P. R.; Taylor, P.; Finn, M. G.; Sharpless, K. B. Angew. Chem. Int. Ed. 2002, 41, 1053–1057. 28. Manetsch, R.; Krasiński, A.; Radić, Z.; Raushel, J.; Taylor, P.; Sharpless, K. B.;
Kolb, H. C. J. Am. Chem. Soc. 2004, 126, 12809–12818.
29. Bourne, Y.; Kolb, H. C.; Radić, Z.; Sharpless, K. B.; Taylor, P.; Marchot, P. Proc. Natl. Acad. Sci. USA 2004, 101, 1449–1454.
Table of Contents
Acknowledgements ………...……….iv
Abstract ……….………...vi
References ………..………xii
Table of Contents ………...………..xiv
List of Figures, Schemes, and Tables ………...xvii
Chapter 1: A Non-Oxidative Approach Towards Chemically and Electrochemically Functionalizing Si(111) ...……….1
1.1 Introduction ...………....2
1.2 Experimental Methods ...………...…………5
1.2.1 Chemicals ………...5
1.2.2 Acetylenylation of Si(111) ………...6
1.2.3 Synthesis and Attachment of Electroactive Benzoquinone …...7
1.2.4 Electrochemical Activation and Attachment …...10
1.3 Surface Characterization Methods …...12
1.3.1 X-Ray Photoelectron Spectroscopy …...12
1.3.2 Contact Angle Measurements …...12
1.3.3 Electrochemical Characterization of Surface Coverages ...13
1.3.4 Infrared Surface Characterization ...13
1.4 Results and Discussions ...14
1.4.1 X-Ray Photoelectron Spectroscopy Measurements ...14
1.4.2 Contact Angle Measurements ...18
1.4.3 Electrochemical Characterization of Surface Coverages ...18
1.4.5 Infrared Surface Characterization ...21
1.4.6 Biofunctionalization of Si(111) Surfaces ...23
1.5 Conclusion ...24
1.6 References ...26
Chapter 2: Identifying Protein Capture Agent via In Situ Click Chemistry ...30
2.1 Introduction ...31
2.2 Artificial Amino Acid Synthesis ...36
2.3 One-Bead One-Compound Peptide Library Construction ...39
2.3.1 Materials ...39
2.3.2 Library Construction ...40
2.4 On Bead Click Reaction …...42
2.4.1 Materials ...42
2.4.1 Click Reaction ...42
2.5 Bead-Based Library Screening Procedures ...43
2.5.1 Proteins ...43
2.5.2 Screening ...44
2.6 Analysis of Lead Compounds by Edman Degradation ...46
2.6.1 Method ...46
2.6.2 Custom Edman Degradation ...47
2.7 Bulk Peptide Synthesis ...50
2.8 Conclusion ...50
2.9 References ...51
Chapter 3: Generating a High-Quality Triligand Capture Agent for bCAII...54
3.1 Introduction ...55
3.2 Peptide Library Construction ...56
3.3 Screening and Results for Anchor Ligand ...57
3.3.2 Re-Screening for Anchor Ligand with a Focused Library…...60
3.4 Binding Measurements for Anchor Ligand by Fluorescence Polarization ...61
3.5 In Situ Click and On Bead Biligand Screens and Results ...63
3.5.1 First-Generation In Situ Biligand Screen ...63
3.5.2 First-Generation On Bead Biligand Screen ...65
3.6 Binding Measurements for Biligand by Surface Plasmon Resonance (SPR) ...68
3.7 In Situ Click and On Bead Triligand Screens and Results ...69
3.7.1 First-Generation In Situ Triligand Screen …...69
3.7.2 First-Generation On Bead Triligand Screen …...71
3.7.3 Azide-Free In Situ Triligand Screen …...72
3.7.4 Re-Screening for Triligand Ligand with Focused Libraries …...73
3.8 Binding Measurements for Triligand using SPR ...76
3.8.1 Protein ...76
3.8.2 SPR ...76
3.9 Dot Blot Selectivity/Sensitivity Assays in Serum ...78
3.10 Conclusion ...80
3.11 References ...83
3.12 Future Directions …...85
Appendix A. Structure of the Twenty D-Amino Acids...87
Appendix B. Complete Structures of Biligands and Triligands ...88
List of Figures
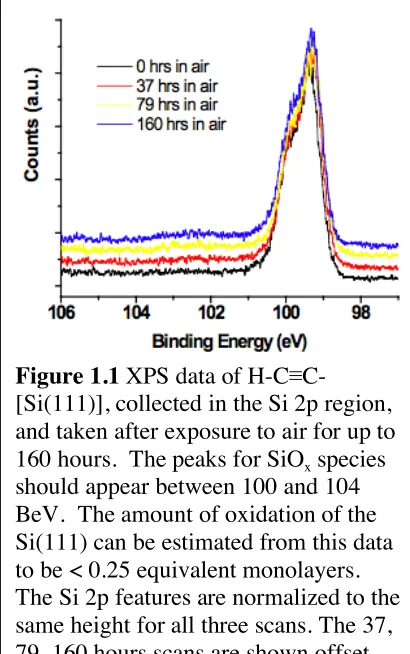
Figure 1.1 XPS data of H-C≡C-[Si(111)], collected in the Si 2p region, and taken after exposure to air for up to 160 hours. The peaks for SiOx species should appear between 100 and 104 BeV. The amount of oxidation of the Si(111) can be estimated from this data to be < 0.25 equivalent monolayers. The Si 2p features are normalized to the same height for all three scans. The 37, 79, 160 hours scans are shown offset from the 0 hours scan to reveal the spectral detail.
15
Figure 1.2 High-resolution XPS spectra of H-C≡C-[Si(111)], and of that surface following the click reaction to form 1s and the reduction of 1s to 2s. A) Si 2p region revealing the near absence of oxide growth during the CuI-catalyzed click reaction, and during the reductive transformation of 1s to 2s. B) Scan of the C 1s region of H-C≡C-[Si(111)]. The Si-C peak is unique to H-C≡C-[Si(111)] surfaces. The C-C peak contains contributions from the C≡C bond and adventitious carbon from the environment. The C-O peak present also arises from adventitious hydrocarbons. C) Scan of the N 1s region of 1s, validating the click formation of 1s. The area ratio of the three peaks is 1:2:1, respectively. D) Scan of the Fe 2p region showing the formation of 3s via the amide coupling of ferrocene carboxylic acid to 2s. The control plots are of 1s (dark grey) and the H-C≡C-Si(111) surface (light grey) after exposure to ferrocene carboxylic acid under the same conditions.
16
Figure 1.3 Cyclic voltammetry (CV) results for 1s and 3s. A) The electrochemical activation of 1s 2s. The black trace is of the first scan, and the grey traces are of two subsequent scans, indicating nearly complete conversion of benzoquinone to hydroquinone during the first scan. B) The reversible oxidation of 3s. Two subsequent scans are shown. All voltages are relative to Ag/AgCl.
19
Figure 1.4 ATR-FTIR characterization of a [Si(111)] and of H-C≡C-[Si(111)] in the region of the 2083 cm-1
Si-H mode
22
Figure 1.5 Demonstration of bioattachment to H-C≡C-[Si(111)], through reductive formation of 2s followed by the
amide coupling of biotin. A) XPS of the biotinylated Si(111) surface following exposure to strept-Au, but prior to the electroless Au amplification. The Au 4f region is comprised of two spin-orbit coupled peaks: Au 4f7/2 (~84 BeV) and Au 4f5/2 (~88 BeV). The dotted trace is from H-C≡C-[Si(111)], and the gray trace is from 1s, each exposed to biotin and strept-Au as controls. The three SEM images (B, C, and D) are of the activated and biofunctionalized surface, plus two controls. All images were taken following the electroless amplification step. The scale bar is 1 µm.
B) 2s, incubated with biotin, and exposed to strept-Au. C) H-C≡C-[Si(111)] incubated with biotin, and exposed to strept-Au. D) 1s incubated with biotin, and exposed to strept-Au. There are at least 500 Au nucleation sites on B, 5 on C, and 7 on D.
Figure 2.1 In situ click chemistry schematic. Azide-alkyne partners (represented by the green hemisphere and blue cylinder, respectively) can click together on bovine carbonic anhydrase II (bCAII). The expected affinity for the biligand could approach 1 x 10-14 M.
33
Figure 2.2 Azide- and acetylene-containing amino acids used in this study
35
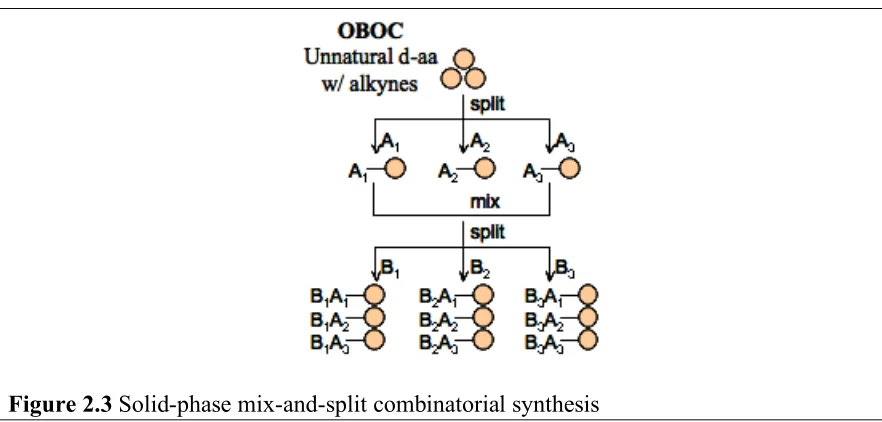
Figure 2.3 Solid-phase mix-and-split combinatorial synthesis 40
Figure 2.4 Imaging hit beads 46
Figure 2.5 Pulsed-Liquid cLC extended method 48
Figure 2.6 Normal 1 cLC extended gradient 48
Figure 2.7 Final steps of flask normal extended flask cycle 48 Figure 2.8 Edman traces for artificial azide-containing amino acids 49
Figure 2.9 Edman sequencing calibration for the in situ click hit 49
Figure 3.1 Screening for anchor ligand 58
Figure 3.2 Histogram for 51 hit sequences isolated from screen
An1 (first-generation anchor ligand screen) 59
anchor ligand lklwfk-(D-Pra), showing KD ≈ 500 µM.
Figure 3.4 A) Biligand chemical structure. B) SPR response sensorgrams obtained with increasing concentration of the biligand kwlwGl-Tz2-kfwlkl (2 nM to 5 µM) demonstrate a 3 -µM binding affinity to bCAII.
69
Figure 3.5 A) Triligand chemical structure. B,C) SPR
response sensorgrams were obtained with increasing concentration of triligand (0.1 nM to 162 nM) and demonstrate 45 -nM and 64 -nM affinities for human (B) and bovine (C) CA II, respectively.
77
Figure 3.6 A) Dot blot illustrating the limit of detection by the triligand for bCAII and hCAII in 10% serum. B) When the biligand anchor is used as the capture agent in 0.1% serum, the sensitivity is reduced > ten fold. C) Dot blot illustrating the selectivity of the triligand, compared to a commercial antibody.
80
List of Schemes
Scheme 1.1 Click reaction, leading to the formation of a 1,2,3-triazole
4
Scheme 1.2 Strategy for the functionalization of Si(111) 6 Scheme 1.3 Synthesis of electroactive benzoquinone 8
Scheme 1.4 The chemical and electrochemical steps involved in non-oxidatively activating Si(111) surfaces. The molecules or molecular components are colored to highlight their different functions. 1s represents the surface-bound benzoquinone that resulted from the click reaction of 1 to the acetylene-modified Si(111) surface (reacted acetylene group drawn in black). Upon reduction at –800 mV (vs Ag/AgCl) of the benzoquinone to the hydroquinone, an intramolecular cyclization reaction ensues to produce 2l (red lactone leaving group) and 2s (the green triazole ring with an amine terminus). This represents the activated surface. The ferrocene carboxylic acid (orange), a second electrochemically active molecule, is then coupled to the Si(111) surfaces.
11
screen
Scheme 2.2 Synthesis for azide-containing artificial amino acids 36
Scheme 2.3 On bead ‘classic’ click reaction 42
Scheme 2.4 Edman Degradation method 47
Scheme 3.1 Preparation of protein-catalyzed, multi-ligand capture agents
55
Scheme 3.2 A) In situ biligand screen schematic, illustrating
the on bead biligand synthesis catalyzed by bCAII. B) On bead biligand library schematic
63
List of Tables
Table 1.1 Measured contact angles for various Si(111) surface
18
Table 1.2 The measured molecular surface coverages for various Si(111) surfaces, as measured by XPS or electrochemistry (EC)
20
Table 2.1 Screening summary; pH=7.4 and
T=25oC, unless otherwise noted 44
Table 3.1 Libraries used in this study 57
Table 3.2 First-generation anchor ligand screen An1 (100 nM) results
59
Table 3.3 Second-generation anchor ligand screen An2a (50 nM)
results 60
Table 3.4 Second-generation anchor ligand screen An2b (8nM)
results 60
Table 3.5 In situ biligand screen Bi1 (50 nM) results 64 Table 3.6 On bead biligand screen Bi2a (50 nM) results 66 Table 3.7 On bead biligand screen Bi2b (10 nM) results 67 Table 3.8 First-generation in situ triligand screen Tri1 (10 nM)
results
Table 3.9 First-generation on bead triligand screen Tri2 (10 nM)
results 71
Table 3.10 Azide-free in situ triligand screen TriX results (control) 72 Table 3.11 Table 3.11 Position-dependent histograms for the
first-generation in situ click screens, for peptides with and without an azide-containing amino acid, to generate a triligand. The final, consensus triligand sequence is indicated by red font. For the in situ screen, 1/3 of the beads had no azide at the x1 or x7 positions, but all hit beads contained an azide. Sample size: in situ and in situ no azide n=24
73
Table 3.12 Second-generation in situ triligand screen Tri3 (500
pM) results 75
Table 3.13 Second-generation on bead triligand screen Tri4 (250
pM) results 75
Chapter 1: A Non-Oxidative Approach Towards Chemically and Electrochemically
Functionalizing Si (111)
The text of this chapter was taken in part from the following manuscripts:
Rohde, R. D.; Agnew, H. D.; Yeo, W.-S.; Bailey, R. C.; Heath, J.R. J. Am. Chem. Soc.,
1.1 Introduction
Semiconductor devices and semiconductor processing are playing an increasingly
large role in biotechnology, with applications that include nanowires (NWs)1 and
nanocantilevers2,3 for label-free biomolecular sensors, nanofluidics for biomolecular
separations,4–7 and a host of microfabricated lab-on-a-chip technologies.8,9 Coupled with
these emerging nano- and microtechnologies has been the emergence of mechanical,10–12
chemical, and electrochemical approaches for functionalizing and/or selectively
activating surfaces. Electrochemical activation of surfaces is particularly relevant since it
is shape conformal and is only limited by the size of electronically addressable features
(which can be much denser than what can be spotted with an inkjet, for example).
Electrochemical activation of metal surfaces has been pioneered by Mrksich,13–16 and
applications of that chemistry towards the biofunctionalization of semiconductor
nanowires has been demonstrated by at least two groups.17,18 For Si surfaces, the
chemistry is particularly challenging: without protection, Si will form a native oxide that
can prevent the use of silicon electrodes for electrochemical functionalization. The
native oxide on silicon also has a low isoelectric point, meaning that under physiological
conditions (= pH 7.4), SiO2 surfaces are negatively charged.19 These surface charges can
potentially limit the sensitivity of certain nanoelectronic biomolecular sensor devices
through Debye screening20 of the biomolecular probe/target binding event to be sensed.
Furthermore, the native oxide of Si can detrimentally impact carrier recombination
rates.21 For high-surface-area devices, such as Si NWs, this can likely result in a
degradation of electrical properties. Thus, the ideal biofunctionalization strategy for
approach should also provide continued protection of the Si surface against subsequent
oxidation, and should limit the number of surface traps that can increase carrier
recombination rates.
Several methods for attaching organic molecules onto non-oxidized Si surfaces
have been reported. One class of schemes relies upon the direct covalent attachment of
alkene-terminated molecules to H-terminated surfaces by thermal induction, ultraviolet
(UV) light, or catalysis.22–29 These strategies have not been demonstrated as giving
long-term protection to the Si surface against oxidation. Lewis’ group has developed the
two-step chlorination/alkylation procedure for Si(111) surfaces that is based upon Grignard
chemistry.30–35 A limitation of these approaches is that only the methylated Si(111)
surface (using Lewis’ chemistry) can be 100% covered.31,36 For example, the coverage
that can be achieved through the ethylation of Cl-terminated Si(111) is limited by steric
affects and is about 80% of the atop sites.37 For larger organic molecules, surface
coverages will most certainly be lower, and resistance to oxidation reduced. In order to
fully passivate the Si(111) surface, generate resistance to oxide growth, and provide for a
chemically versatile surface, different surface chemistries are needed. Recently, J. J.
Gooding has made passivated Si(100) surfaces using hydrosilylation and bis-alkyne for
much more technologically relevant Si(100) surface against oxidation.38
Chapter 1 describes a versatile and robust strategy for chemically passivating
Si(111) surfaces in a manner that stabilizes the underlying Si against oxidation and
allows for both chemical and electrochemical functionalization of the surface. Based
upon our previous work on methylated and ethylated Si(111),30–37 we chose to explore the
Work by Nemanick39 and Lewis’ group40,41 indicated that the chlorination/alkylation
chemistry for acetylenylating Si(111) could proceed to completion. The footprint of the
-C≡CH on Si(111) should be as small or smaller than the –CH3 group, and so a high
surface coverage should be possible. Equally important is that the -C≡CH group also
provides a chemical handle for additional functionalization via the Cu(I) catalyzed
Huisgen 1,3-dipolar cycloaddition (‘click’ reaction42,43) between an azide and the
surface-bound alkyne to form a 1,4-disubstituted 1,2,3-triazole (Scheme 1.1).
R1 H
N N
N
R2
N N N
R2
R1
Cu(I) catalyst
+
-+
Scheme 1.1 Click reaction, leading to the formation of a 1,2,3-triazole
In particular, we designed an azide-functionalized, modified benzoquinone for
attachment, via the click reaction, to the surface-bound acetylenyl groups to form a
1,2,3-triazole. The click reaction is useful because azides and acetylenes are synthetically easy
to introduce, compatible with a variety of solvents and species, and tolerant against other
functionality (highly specific, coupling can only occur between these two groups). Our
work here follows reports that have demonstrated that different molecules can be clicked
onto gold and SiO2 surfaces in a variety of solvent and pH conditions.44–52
We previously reported on the electrochemistry of hydroquinones on Si(111) and
Si(100) surfaces, attached via the UV-activation of H-terminated Si.17 In that work, the
hydroquinones could be reversibly oxidized to form benzoquinones (the ‘activated’
surface) which could then react by way of either Diels-Alder cycloaddition13,15 or
or nanowire surface. However, while the hydroquinone coverage on the Si(111) surface
did yield at least some protection for that surface against oxidation, the electrochemical
step to oxidize the hydroquinone also led to oxidation of the underlying Si(111). Thus, in
this work, we have designed and synthesized a benzoquinone that can be clicked onto the
acetylenylated Si surface. The surface-bound benzoquinone may be then activated via
electrochemical reduction to produce an amine terminus. We demonstrate that the entire
chemical process may be accomplished in a fashion that greatly reduces the oxidation of
the underlying Si. We also demonstrate the selective attachment of ferrocene onto an
electrochemically activated Si(111) surface, as well as the model biomolecule, biotin.
1.2 Experimental Methods
1.2.1 Chemicals
Anhydrous methanol and anhydrous tetrahydrofuran (THF, inhibitor-free) were
obtained from Aldrich and exclusively stored and used in a N2(g)-purged glove box.
Chlorobenzene, benzoyl peroxide, and sodium acetylide (18 wt% in xylenes/light mineral
oil) were purchased from Aldrich and were stored and used in the glove box. Phosphorus
pentachloride (PCl5) was acquired from Riedel-de Haën (Seelze, Germany). The 40%
NH4F(aq) solution was obtained from Transene Co. (Rowland, MA) and was used as
received. The CuSO4·5H2O was obtained from Spectrum Chemical Mfg. Corp.
(Gardena, CA). Sodium ascorbate, ferrocene carboxylic acid, and anhydrous N,N
-dimethylformamide (DMF) were obtained from Aldrich. N,N′-Diisopropylcarbodiimide
(DIC) was purchased from Anaspec (San Jose, CA). Dulbecco’s Phosphate Buffered
Saline (DPBS) (2.7 mM KCl, 1.5 mM KH2PO4, 137 mM NaCl, 8 mM Na2HPO4) pH 7.4
Biotechnology, Inc. (Rockford, IL). Nanogold Streptavidin was purchased from
Invitrogen (Carlsbad, CA). GoldEnhance-EM kit for Nanogold amplification was bought
from Nanoprobes (Yaphank, NY).
1.2.2 Acetylenylation of Si(111)
Scheme 1.2 shows the strategy used for functionalization of Si(111), using a
two-step chlorination/alkylation method followed by Cu(I)-catalyzed click chemistry. The
acetylene passivation leads to a high coverage of atop sites on an unreconstructed Si(111)
surface (97 ± 5 %), which resists native oxidation of the surface.40,41 Another advantage
is the ability to use the terminal alkyne to attach a variety of molecules via click
chemistry.
Scheme 1.2 Strategy for the functionalization of Si(111)
The starting surfaces used in these experiments were single-crystal, polished
Si(111) wafers, that were 500–550 µm thick, phosphorus-doped (n-type), with 0.005–
0.02 Ω-cm resistivity, and a miscut angle of 3–4° (Montco Silicon Technologies, Spring
City, PA). Prior to use, the Si wafers (1 cm × 1 cm) were cleaned by successive
Millipore (18 MW) water and then placed into basic piranha solution (5:1:1 =
H2O:H2O2:NH4OH warning: caustic!) at 80 °C for 5 min. The samples were removed
from piranha solution, rinsed with copious amounts of Millipore water and dried under
streaming N2(g). The samples were immediately place in degassed NH4F(aq) solution for
15 min. The samples were subsequently removed from the NH4F(aq), rinsed copiously
with water, dried under streaming N2(g), and immediately loaded into a glove box.
Chlorination of the Si(111) surfaces (Scheme 1.2, Step 1) was carried out in a
N2(g)-purged glove box, according to published methods.30–37 A saturated solution of
PCl5 in chlorobenzene was prepared and heated for one hour prior to use to ensure
complete dissolution of the PCl5. To 2 ml of this PCl5 solution, the Si substrate was
added with a grain of benzoyl peroxide. The solution was heated to 90 °C for 50 min.
Subsequently, the samples were rinsed with anhydrous THF several times and
immediately used for the acetylenylation step.
Acetylenylation of the chlorinated Si(111) surfaces (Scheme 1.2, Step 2) was
performed inside the N2(g)-purged glove box. The chlorinated wafers were immersed in
a sodium acetylide (18 wt% in xylenes/light mineral oil) suspension and heated to 130 °C
for 5 hours.41 After reaction, the samples were removed from solution, rinsed copiously
with anhydrous THF, and then rinsed with anhydrous methanol. The samples were then
immersed into a fresh volume of anhydrous methanol, taken out of the glove box into air,
sonicated for 10 min, and then dried in a stream of N2(g).
1.2.3 Synthesis and Attachment of Electroactive Benzoquinone
Scheme 1.3 describes the synthetic procedure for making the electroactive
treated with dimethylacrylic acid to give a lactone (a) by a Friedel-Crafts type addition
reaction. The quinone acid (b) was prepared by oxidation of the resulting lactone (a)
with aqueous N-bromosuccinimide (NBS). The acid was activated with an
N-hydroxysuccinimidyl (NHS) group to give (c), which was then subjected to
3-azidopropylamine to afford 1.
Scheme 1.3 Synthesis of electroactive benzoquinone
6-Hydroxy-4,4,5,7,8-peptamethyl-chroman-2-one (a).
2,3,5-Trimethylhydroquinone (2 g, 13.1 mmol) was mixed with 3,3-dimethylacrylic acid (1.45
g, 14.5 mmol) and methanesulfonic acid (10 ml). The mixture was stirred at 85 °C under
nitrogen for 3 hours and then cooled to room temperature. To the mixture was added 100
g of ice with stirring. The precipitate was extracted with ethyl acetate (4 × 50 ml). The
combined organic layer was washed with saturated NaHCO3 (2 × 50 ml) and water (2 ×
50 ml), and dried over MgSO4. After filtration and evaporation, an obtained residue was
recrystallized from hexane and ethyl acetate (2:1, v/v) to give 2.6 g (84%) of the desired
product as a white solid. 1H NMR 300 MHz (CDCl3) δ 4.69 (s, 1H), 2.56 (s, 2H), 2.37 (s,
3-Methyl-3-(2,4,5-trimethyl-3,6-dioxocyclohexa-1,4-dienyl)butanoic acid (b).
To a solution of the lactone a (1.58 g, 6.74 mmol) in a mixture of acetonitrile (15 ml) and
water (3 ml) was added N-bromosuccinimide (1.26 g, 7.08 mmol) in portions with
stirring at room temperature. After 30 min, the organic solvents were evaporated under
reduced pressure, and the remaining solution was extracted with CH2Cl2 (2 × 30 ml).
The combined organic layer was dried over MgSO4, and reduced solvent to give 1.65 g
(98%) of a yellow oily product, which was used without further purification. 1H NMR
300 MHz (CDCl3) δ 3.04 (s, 2H), 2.15 (s, 3H), 1.96 (m, 3H), 1.94 (m, 3H), 1.45 (s, 6H).
3-Methyl-3-(2,4,5-trimethyl-3,6-dioxocyclohexa-1,4-dienyl)butanoic acid,
N-hydroxysuccinimidyl ester (c). To a solution of acid b (326 mg, 1.30 mmol) and
N-hydroxysuccinimide (152 mg, 1.32 mmol) in CH2Cl2 (15 ml), was added
1,3-dicyclohexylcarbodiimide (DCC, 270 mg, 1.31 mmol) portionwise, followed by a
catalytic amount of N,N-dimethylaminopyridine (DMAP). The reaction mixture was
stirred for 1 hour. The white precipitate was filtered and the filtrate was concentrated.
The residue was redissolved in cold ethyl acetate (5 ml) and insoluble impurities were
filtered. Solvent was removed to give 419 mg (93%) of a yellow foamy solid product.
1H NMR 300 MHz (CDCl
3) δ 3.27 (s, 2H), 2.77 (s, 4H), 2.15 (s, 3H), 1.94 (s, 6H), 1.51
(s, 6H).
N-(3-azidopropyl)-3-methyl-3-(2,4,5-trimethyl-3,6-dioxocyclohexa-1,4-dienyl)
butanamide (1). To a solution of c (443 mg, 1.28 mmol) in DMF (5 ml) was added
diisopropylethylamine (DIEA, 523 ml, 3.06 mmol), followed by 3-azidopropylamine
(153 mg, 1.53 mmol). The reaction mixture was stirred overnight at 50 °C, diluted with
reduced and the residue was purified by silica gel chromatography (hex/EtOAc, 2:1) to
give 370 mg (87%) of product as a yellow solid. 1H NMR 300 MHz (CDCl3) δ 3.30 (t, J
= 6.6, 2H), 3.23 (q, J = 6.6, 2H), 2.81 (s, 2H), 2.12 (s, 3H), 1.96 (m, 3H), 1.94 (m, 3H),
1.70 (quint, J = 6.6, 2H), 1.41 (s, 6H). Mass (ES) m/z 333.0 ([M+1]+).
Click reaction to attach 1 onto acetylene-terminated Si(111). The click
reaction of acetylene-terminated Si(111) (Scheme 1.2, Step 3) with 1 (Scheme 1.3) was
carried out in anhydrous DMF. Relative to the azide, 20 mol% sodium ascorbate was
added, followed by 10 mol% of CuSO4·5H2O, and a 10 mM azide solution of 1 in DMF.
The reaction was run for 12 hours in the glove box. After the reaction, the surface was
sonicated in DMF for 5 min three times and then rinsed with methanol and blow dried
under N2(g).
1.2.4 Electrochemical Activation and Attachment
Ferrocene. 1 was attached to acetylene-terminated Si(111) using the Cu(I)-catalyzed
click reaction (Scheme 1.2, Step 3), to form 1s (Scheme 1.4). Reductive electrochemistry
(–800 mV referenced to Ag/AgCl) was performed to convert the modified benzoquinone
to hydroquinone in degassed DPBS (pH 7.4). The hydroquinone then underwent an
intramolecular cyclization reaction leaving a free amine on the surface (2s) and releasing
a lactone species (2l). This amine terminus allows for a variety of subsequent reactions,
including amide coupling chemistry, which is commonly utilized to attach biomolecules
to surfaces. We first illustrated the use of this electrochemical reduction process to attach
Scheme 1.4 The chemical and electrochemical steps involved in non-oxidatively activating Si(111) surfaces. The molecules or molecular components are colored to highlight their different functions. 1s represents the surface-bound benzoquinone that resulted from the click reaction of 1 to the acetylene-modified Si(111) surface (reacted acetylene group drawn in black). Upon reduction at –800 mV (vs Ag/AgCl) of the benzoquinone to the hydroquinone, an intramolecular cyclization reaction ensues to produce 2l (red lactone leaving group) and 2s (the green triazole ring with an amine terminus). This represents the activated surface. The ferrocene carboxylic acid (orange), a second electrochemically active molecule, is then coupled to the Si(111) surface.
Ferrocene carboxylic acid (0.02 M) and N,N′-diisopropylcarbodiimide (DIC) (0.13 M) in
DMF were added to the free amine surface. The amide coupling reaction was run
overnight covered in an N2-purged glove box. The surface was then sonicated three
times in DMF, then MeOH, and then blown dry.
Biotin. Biotin (0.02 M) and DIC (0.13 M) in DMF were added to the free amine surface
2s. The amide coupling reaction was run overnight in an N2-purged glove box at 50 °C.
The surface was then sonicated three times in DMF, then MeOH, and blown dry.
Subsequently, the Nanogold streptavidin (10 pM in 0.05% Tween20/DPBS) was
introduced for 15 min. The surface was sonicated in 0.05% Tween20/DPBS for 25 min
and then water for 5 min. The gold particles were then amplified with gold enhancement
1.3 Surface Characterization Methods
1.3.1 X-Ray Photoelectron Spectroscopy
X-ray photoelectron spectroscopy (XPS) was utilized to characterize many of the
steps of both Schemes 1.2 and 1.4. All XPS measurements were performed in an
ultra-high vacuum chamber of an M-probe surface spectrometer that has been previously
described.54 All measurements were taken on the center of the sample at room
temperature. Monochromatic Al Kα X-rays (1486.6 eV) were incident at 35° from the
sample surface and were used to excite electrons from samples. The emitted electrons
were collected by a hemispherical analyzer at a take-off angle of 35° from the plane of
the sample surface.
ESCA-2000 software was used to collect and analyze the data. To get an
overview of the species present in the sample, survey scans were run from 0 to 1000
binding eV (BeV). The Si 2p (97–106 BeV), Cl 2p (196–206 BeV), C 1s (282–292
BeV), N 1s (393–407 BeV), Fe 2p (695–745 BeV), and Au 4f (77–97 BeV) regions were
investigated in detail.
1.3.2 Contact Angle Measurements
The sessile contact angle of water on the functionalized Si(111) surface was used
to check the fidelity of the monolayer for all surfaces of Schemes 1.2 and 1.4 except H-
and Cl-terminated Si(111). Contact angle measurements were obtained with an NRL
C.A. Goniometer Model #100-00 (Rame-Hart, Inc.) at room temperature. Contact
needle onto the surface. This was repeated three times and averaged to obtain the θ for
the surface.
1.3.3 Electrochemical Characterization of Surface Coverages
Electrochemistry was performed in a custom-made cell using a VMP
Multi-Potentiostat (Princeton Applied Research, Oak Ridge, TN). Dulbecco’s Phosphate
Buffered Saline (DPBS) was used as the electrolyte, with silicon as a working electrode,
a Pt coil as a counter electrode, and an Ag/AgCl reference electrode. Molecular coverage
was obtained by integrating the cathodic peak of the first scan in which all the modified
benzoquinone was reduced to hydroquinone.
1.3.4 Infrared Surface Characterization
The H- and H-C≡C-terminated Si(111) surfaces were characterized by Attenuated
Total Reflection Fourier Transform Infrared Spectroscopy (ATR-FTIR). The Si(111)
surfaces were prepared from single-crystal, polished Si(111), miscut 3–4°, boron-doped
(n-type), 500–550 µm thick, and with 4–20 Ω-cm resistivity (Addison Engineering, Inc.,
San Jose, CA). Samples were cut into (2 cm × 2 cm) pieces and underwent the
acetylenylation and click reactions as described above. Samples were mounted on a
Germanium ATR crystal (GATR, Harrick Scientific Products, Inc.) for a grazing angle of
65°. The sample was placed in a Vertex 70 FT-IR spectrometer (Bruker Optics Inc.) for
measurements. In an air-purged sample chamber, 512 or 1024 scans were taken, with
background scans of air subtracted from the spectra. Spectra were fitted with a linear
1.4 Results and Discussions
1.4.1 X-Ray Photoelectron Spectroscopy Measurements
XPS survey scans revealed the progression of the acetylenylation and click
chemistry steps. For a freshly prepared, H-terminated Si(111) surface (H-[Si(111)]), Si
2p and Si 2s peaks were observed, at 100 BeV and 150 BeV, respectively. Additional
small C ls and O ls peaks, corresponding to adventitiously adsorbed carbon and oxygen
on the surface, were also detected. After chlorination of H-[Si(111)] by PCl5, two new
peaks at 200 BeV and 270 BeV appeared in the XPS spectrum, representing the Cl 2p
and Cl 2s electrons, respectively. Upon a treatment with sodium acetylide, the chlorine
peaks disappeared and a pronounced C 1s appeared at 285 BeV, verifying that the
acetylene-terminated Si(111) surface (H-C≡C-[Si(111)]) has been generated. Other
adsorbed carbon can contribute to the C 1s peak intensity for this scan. After the click
reaction, a new N 1s peak appears at 400 BeV.
High-Resolution XPS Measurements. High-resolution XPS measurements were
utilized to quantitate the chemical steps of Schemes 1.2 and 1.4. In particular, the Si 2p
region was used to monitor the growth of silicon oxides as a function of exposure time to
air (Figure 1.1) and as a function of the chemical and electrochemical steps of Scheme
1.4 (Figure 1.2A) in two sets of experiments. For both measurements, a Shirley baseline
Figure 1.1 XPS data of H-C≡
C-[Si(111)], collected in the Si 2p region, and taken after exposure to air for up to 160 hours. The peaks for SiOx species should appear between 100 and 104 BeV. The amount of oxidation of the Si(111) can be estimated from this data to be < 0.25 equivalent monolayers. The Si 2p features are normalized to the same height for all three scans. The 37, 79, 160 hours scans are shown offset from the 0 hours scan to reveal the spectral detail.
2p3/2 and 2p1/2 were fitted to Voigt
functions fixed at 95% Gaussian and 5%
Lorentzian, with a 15% asymmetry. The Si
2p1/2 and 2p3/2 peaks were fitted with the
two peaks held 0.6 BeV apart, the full
width at half maximum (FWHM) was
fixed at 1, and the integrated area ratio of
the 2p1/2/2p3/2 peaks was fixed at 0.51, as
has been previously described.30–32,40 The
broad peak between 100 and 104 BeV was
assigned as Si+ to Si4+ oxides and was
fitted to a third peak. The positions of the
three peaks and the width of the third peak
were optimized to get the best fit to the
experimental spectrum. For very thin oxide layers, the oxide coverage was calculated
from the SiOx:Si 2p peak area ratio. This was determined by dividing the area under the
third peak by the total area of the Si 2p3/2 and 2p1/2 peaks.32 The SiOx:Si 2p peak area
ratio was then divided by a normalization constant of 0.21 for Si(111) to estimate the
fraction of surface atoms that were oxidized.30–32 We estimated that there were < 0.25
equivalent monolayers of oxide on the acetylene-terminated Si(111) surface after 6 days
exposure to air (Figure 1.1). This is consistent with other results that have shown
and the reduction of 1s to 2s at –800 mV (Scheme 1.4), the amount of oxide was
calculated to be 0.29 and 0.34 equivalent monolayers, respectively (Figure 1.2A).
Figure 1.2 High-resolution XPS spectra of H-C≡C-[Si(111)], and of that surface following the click reaction to form 1s and the reduction of 1s to 2s. A) Si 2p region revealing the near absence of oxide growth during the CuI-catalyzed click reaction, and during the reductive transformation of 1s to 2s. B) Scan of the C 1s region of H-C≡ C-[Si(111)]. The Si-C peak is unique to H-C≡C-[Si(111)] surfaces. The C-C peak contains contributions from the C≡C bond and adventitious carbon from the environment. The C-O peak present also arises from adventitious hydrocarbons. C) Scan of the N 1s region of
1s, validating the click formation of 1s. The area ratio of the three peaks is 1:2:1, respectively. D) Scan of the Fe 2p region showing the formation of 3s via the amide coupling of ferrocene carboxylic acid to 2s. The control plots are of 1s (dark grey) and the H-C≡C-Si(111) surface (light grey) after exposure to ferrocene carboxylic acid under the same conditions.
The H-C≡C-[Si(111)] surface was also characterized using high-resolution XPS
of the C 1s spectrum (Figure 1.2B). This spectrum was deconvoluted and fitted to three
peaks, the silicon-bonded carbon at 283.8 BeV, the carbon-bonded carbon at 284.9 BeV,
were fitted to Voigt functions having 70% Gaussian and 30% Lorentzian line shapes.
The peak center-to-center distances were fixed at 1.1 BeV between the Si-C and C-C
peaks, and at 2.9 BeV between the Si-C and O-C peaks. To calculate the surface
coverage of the acetylene the integrated area under the silicon-bonded carbon peak was
ratioed to the total integrated area of the Si 2p3/2 and 2p1/2 peaks and normalized with
respect to scan time. The ratio calculated was referenced to a methyl terminated Si(111)
surface that was scanned under the same conditions. The effective coverage of acetylene
on the Si surface was 97 ± 5 %, consistent with other measurements of such surfaces.41
The statistical uncertainty in this number is largely determined by the signal-to-noise
ratio of the XPS data (~ 30:1).
The high-resolution N 1s spectrum of 1s illustrates the attachment of the
benzoquinone (1) via click chemistry (Figure 1.2C). The spectrum was deconvoluted and
fitted to three peaks, each composed of 80% Gaussian and 20% Lorentzian line shapes.56
The three peaks correspond to the amide nitrogen at 401.7 BeV, the doubly bonded
nitrogen atoms (in the triazole ring) at 400.3 BeV, and the singly bonded nitrogen (in the
triazole ring) at 398.2 BeV, respectively. The ratio of peak areas was found to be 1:2:1,
consistent with the structure of 1s. After electrochemical cleavage to 2s, the N 1s region
remained unchanged.
Figure 1.2D is a high-resolution scan of the Fe 2p region that demonstrates the
attachment of ferrocene carboxylic acid onto 2s to form 3s. The Fe 2p3/2 and 2p1/2 peaks
occur at 711.3 and 724.8 BeV, respectively. It is difficult to quantify the amount of iron
from such data because the peak shape is highly asymmetric and hard to deconvolute
However, as discussed below, the surface coverage of 3s can be estimated from cyclic
voltammetry measurements. Figure 1.2D also shows two control experiments. Although
a trace amount of ferrocene residue is detected on the controls, this measurement does
confirm that the large majority of ferrocene is the result of the covalent bond formation
between carboxylic acid of the ferrocene and the free amine of 2s.
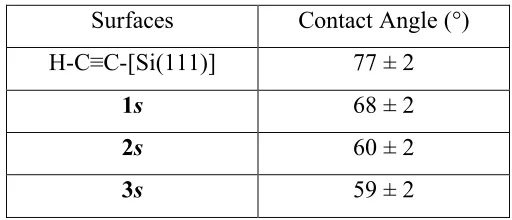
1.4.2 Contact Angle Measurements
As the functionalized Si (111) surface changes and becomes more hydrophilic, the
contact angle of water decreases. These results are listed in Table 1.1.
Table 1.1 Measured contact angles for various Si(111) surfaces
Surfaces Contact Angle (°)
H-C≡C-[Si(111)] 77 ± 2
1s 68 ± 2
2s 60 ± 2
3s 59 ± 2
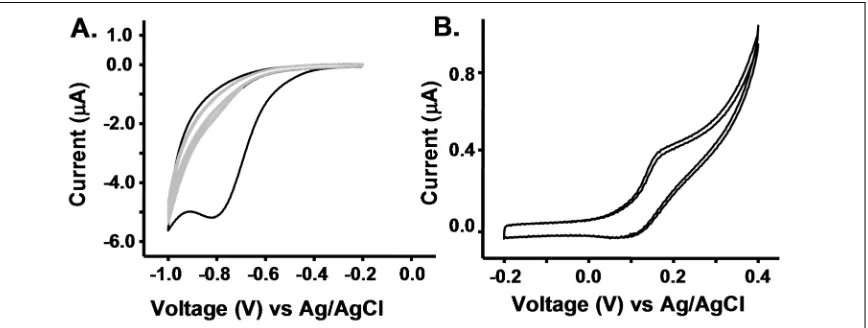
1.4.3 Electrochemical Characterization of Surface Coverages
Figure 1.3A depicts the cyclic voltammogram (CV) for 1s. The prominent
cathodic peak in the first scan confirms the presence of electroactive benzoquinone and,
therefore, that the click reaction proceeded. Molecular coverage was obtained by
integrating the cathodic peak of the first scan in which all the modified benzoquinone was
reduced to hydroquinone. Complete conversion of 1s to 2s accompanied by the release
of 2l (Scheme 1.4) was achieved at potentials below –0.9 V. Consecutive CV scans show
under the cathodic peak was obtained after subtracting the non-Faradaic current. This
area was converted to the number of molecules by a stoichiometric ratio of 2 electrons to
1 electroactive molecule. Then the number of molecules was divided by the electrode
surface area and then normalized to the Si atop atom surface density (7.8 × 10¹⁴ /cm2for
Si(111)).17 The coverage calculated for 1s on the H-C≡C-[Si(111)] was 6.7 ± 0.3 %.
Figure 1.3 Cyclic voltammetry (CV) results for 1s and 3s. A) The electrochemical activation of 1s 2s. The black trace is of the first scan, and the grey traces are of two subsequent scans, indicating nearly complete conversion of benzoquinone to
hydroquinone during the first scan. B) The reversible oxidation of 3s. Two subsequent scans are shown. All voltages are relative to Ag/AgCl.
Figure 1.3B represents a CV of 3s, the product of the amide coupling of ferrocene
carboxylic acid with 2s. The CV shows reversible Fc0/+ redox behavior, as expected for
ferrocene oxidation. The peak spacing confirms that ferrocene is covalently attached (but
not adsorbed) onto the surface. The coverage was calculated by integrating the anodic
peak after subtracting the non-Faradaic current. The number of molecules was divided
by the electrode surface area and normalized to Si atom surface density which is 7.8 ×
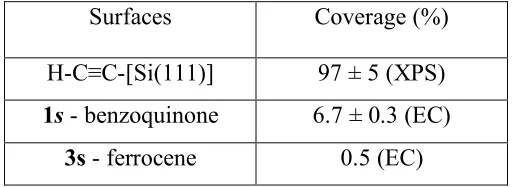
1.4.4 Surface Coverages Summary
The coverage values for H-C≡C-[Si(111)], surface 1s, and surface 3s are
summarized in Table 1.2, calculated with respect to all atop sites on an unreconstructed
Si(111) surface.
Table 1.2 The measured molecular surface coverages for various Si(111) surfaces, as
measured by XPS or electrochemistry (EC)
Surfaces Coverage (%)
H-C≡C-[Si(111)] 97 ± 5 (XPS)
1s - benzoquinone 6.7 ± 0.3 (EC)
3s - ferrocene 0.5 (EC)
The 97% coverage of the H-C≡C-[Si(111)] surface is consistent with the Si 2p
XPS in Figure 1.1 (and other studies41) that indicated little surface-bound SiOx. The
acetylene carbons are sp-hybridized, implying a perpendicular attachment to the Si(111)
surface. The atomic radius for C is smaller than that for Si (0.70 Å vs 1.10 Å), and there
is a 3.8 Å spacing between atop sites on Si(111). These values support the notion that a
100% passivation of Si(111) surfaces can be achieved using the approach we described
here.
The coverage of the electroactive benzoquinone 1 on Si(111) to form 1s was
calculated to be ~ 7% of all available Si(111) atop sites. We previously reported on
electrochemically activating Si(111) and Si(100) surfaces through the use of protected
hydroquinones that were attached to H-terminated Si surfaces via UV activation.17 For
protection groups on the hydroquinone led to slightly reduced surface coverages,
implying steric interactions played at least some role in limiting coverage. It is likely that
steric interactions play a dominating role in determining the efficiency of the click
reaction to form 1s. While the acetylene footprint may be approximated by the van der
Waals radius of the carbon atom, the triazole ring formed upon the click reaction will
obviously be much larger. In fact, it is possible that the click chemistry is only effective
at the step edges of the Si(111) surface. We have extensively characterized various
Si(111) surfaces that have been alkylated using the two-step chlorination/alkylation
chemistry using high-resolution Scanning Tunneling Microscopy (STM). For both
methylated31,36 and ethylated37 Si(111), we find that about 10% of the Si surface atoms lie
at step edges. This arises from etch pits that are apparently formed during the
chlorination step57, implying that the H-C≡C-[Si(111)] surface likely has a similar
morphology. In that case, acetylene groups located at step edges would not have the
steric constraints that would limit the formation of the triazole ring. It is interesting that
the 7% coverage of 2s is similar to the number of Si atop sites that would reside at step
edges.
1.4.5 Infrared Surface Characterization
Additional support for 100% acetylenylation of Si(111) comes from the
ATR-FTIR measurements of H-[Si(111)] and H-C≡C-[Si(111)] (Figure 1.4; black and grey
Figure 1.4 ATR-FTIR characterization of a H-[Si(111)] and of H-C≡C-[Si(111)] in the region of the 2083 cm-1 Si-H mode
Whereas XPS allows analysis of the elemental composition of surfaces, infrared
spectroscopy (IR) gives information about the types of chemical functionality on a
surface. The spectra shown in Figure 1.4 are expanded to highlight the region containing
the signature Si-H (2083 cm-1) stretching frequency that is observed for the H-[Si(111)].
The Si-H stretch is strong and sharp, indicating that the surface sites are passivated with
one hydrogen atom per atop site. This is expected for a H-[Si(111)] freshly prepared by
an NH4F(aq) etch.58 For H-C≡C-[Si(111)], the 2083 cm-1 vibration has quantitatively
disappeared, again consistent with 100% acetylenylation and with other work.41 A weak
C≡C stretch might be expected in this region (2120–2175 cm-1),41,47 although we have not
observed it. When H-[Si(111)] is ethylated through a similar chlorination/alkylation
procedure, the coverage of ethyl groups on the atop sites of the Si(111) surface is limited
by steric interactions to be approximately 80%.37 Following the Grignard alkylation of
Si(111), no Cl is detected on the surface,30 and FTIR data indicates that the remaining
broadened, shifted (to 2070 cm-1), and reduced in intensity to 14% of that observed for
the H-[Si(111)] surface.59
1.4.6 Biofunctionalization of Si(111) Surfaces
The stated goal of this work was to develop a general strategy for
electrochemically directing the biofunctionalization of Si(111) surfaces without oxidizing
the underlying Si(111). To this end, we demonstrated the electrochemical activation and
subsequent attachment of the model biomolecule, biotin, using a modification of the
chemistry described in Scheme 1.4.
Figure 1.5A shows the XPS of the biotinylated Si(111) surface following exposure to
strept-Au, but prior to the electroless Au amplification. The Au 4f region is comprised of
two spin-orbit coupled peaks: Au 4f7/2 (~ 84 BeV) and Au 4f5/2 (~ 88 BeV). The dotted
trace is from H-C≡C-[Si(111)], and the gray trace is from 1s, each exposed to biotin and
strept-Au as controls. To detect surface-bound biotin, we utilized Au
nanoparticle-labeled streptavidin (strept-Au) and followed through with electroless amplification of
the Au to produce particles that were imaged using Scanning Electron Microscopy
(SEM). Representative data from this experiment, shown in Figure 1.5B, indicates that
the selectivity for attachment of strept-Au onto 2s is about 100-fold greater than on two
control surfaces, H-C≡C-[Si(111)] and 1s, both of which were also treated with biotin
and exposed to strept-Au.
1.5 Conclusion
Acetylenylation of the Si(111) surface via the two-step chlorination/alkylation
procedure was combined with click chemistry to provide a non-oxidative approach for
adding chemical functionality to a silicon surface. Si(111) surfaces can be nearly 100%
passivated with acetylene groups. A specifically designed, electroactive benzoquinone
molecule has been immobilized to the H-C≡C-[Si(111)] surface. A 7% coverage of the
benzoquinone was found, which implies that the click reaction likely occurred at step
edges on the H-C≡C-[Si(111)] surface. The attachment of an electroactive benzoquinone
was highly selective and was accomplished with only a minimal amount of oxidation of
the underlying Si(111). The electroactive benzoquinone was reduced and cleaved from
the surface to produce an amine terminus. In separate experiments, ferrocene carboxylic
activated surface. X-ray photoelectron spectroscopy (XPS), Fourier transform infrared
spectroscopy (FTIR), cyclic voltammetry (CV), and contact angle goniometry were
utilized to characterize and quantitate each step in the functionalization process. As a
result, the actylene and click chemistries can modify silicon surfaces with minimal
oxidation. This approach can be used as a general platform to prepare functional surfaces
for various applications and can be extended towards the selective biopassivation of
1.6 References
1. Zheng, G.; Patolsky, F.; Cui, Y.; Wang, W. U.; Lieber, C. M. Nature Biotechnol. 2005, 23, 1294, and references therein.
2. Beckmann, N.; Zahnd, C.; Huber, F.; Bietsch, A.; Plückthun, A.; Lang, H.-P.; Güntherodt, H.-J.; Hegner, M.; Gerber, C. Proc. Natl. Acad. Sci. U.S.A. 2005, 102, 14587.
3. Yue, M.; Lin, H.; Dedrick, D. E.; Satyanarayana, S.; Majumdar, A.; Bedekar, A. S.; Jenkins, J. W.; Sundaram, S. J. Microelectromech. Syst.
2004, 13, 290.
4. Reccius, C. H.; Mannion, J. T.; Cross, J. D.; Craighead, H. G. Phys. Rev. Lett. 2005, 95, 268101.
5. Stavis, S. M.; Edel, J. B.; Li, Y. G.; Samiee, K. T.; Luo, D.; Craighead, H. G. J. Appl. Phys. 2005, 98, 044903.
6. Fan, R.; Karnik, R.; Yue, M.; Li, D. Y.; Majumdar, A.; Yang, P. D. Nano Lett. 2005, 5, 1633.
7. Karnik, R.; Castelino, K.; Fan, R.; Yang, P.; Majumdar, A. Nano Lett.
2005, 5, 1638.
8. Craighead, H. G.; James, C. D.; Turner, A. M. P. Curr. Opin. Solid State Mater. Sci. 2001, 5, 177.
9. Jung, D. R.; Kapur, R.; Adams, T.; Giuliano, K. A.; Mrksich, M.; Craighead, H. G.; Taylor, D. L. Crit. Rev. Biotechnol. 2001, 21, 111.
10.Piner, R. D.; Zhu, J.; Xu, F.; Hong, S.; Mirkin, C. A. Science 1999, 283, 661.
11.Lee, K.-B.; Park, S.-J.; Mirkin, C. A.; Smith, J. C.; Mrksich, M. Science
2003, 295, 1702.
12.Jung, H.; Dalal, C. K.; Kuntz, S.; Shah, R.; Collier, C. P. Nano Lett. 2004,
4, 2171.
13.Yousaf, M.; Mrksich, M. J. Am. Chem. Soc. 1999, 121, 4286. 14.Hodneland, C. D.; Mrksich, M. J. Am. Chem. Soc. 2000, 122, 4235. 15.Yeo, W.-S.; Yousaf, M. N.; Mrksich, M. J. Am. Chem. Soc. 2003, 125,
16.Yeo, W.-S.; Mrksich, M. Adv. Mater. 2004, 16, 1352.
17.Bunimovich, Y. L.; Ge, G.; Beverly, K. C.; Ries, R. S.; Hood, L.; Heath, J. R. Langmuir 2004, 20, 10630.
18.Curreli, M.; Li, C.; Sun, Y.; Lei, B.; Gundersen, M. A.; Thompson, M. E.; Zhou, C. J. Am. Chem. Soc. 2005, 127, 6922.
19.Hu, K.; Fan, F.-R. F.; Bard, A. J.; Hillier, A. C. J. Phys. Chem. B 1997,
101, 8298.
20.Israelachvili, J. Intermolecular and Surface Forces; Academic Press: London, 1985.
21.Yablonovitch, E.; Allara, D. L.; Chang, C. C.; Gmitter, T.; Bright, T. B.
Phys. ReV. Lett. 1986, 57, 249.
22.Sung, M. M.; Kluth, G. J.; Yauw, O. W.; Maboudian, R. Langmuir 1997,
13, 6164.
23.Sieval, A. B.; Demirel, A. L.; Nissink, J. W. M.; Linford, M. R.; van der Maas, J. H.; de Jeu, W. H.; Zuilhof, H.; Sudhölter, E. J. R. Langmuir 1998,
14, 1759.
24.Effenberger, F.; Gotz, G.; Bidlingmaier, B.; Wezstein, M. Angew. Chem., Int. Ed. 1998, 37, 2462.
25.Boukherroub, R.; Wayner, D. D. M. J. Am. Chem. Soc. 1999, 121, 11513. 26.Linford, M. R.; Fender, P.; Eisenberger, P. M.; Chidsey, C. E. D. J. Am.
Chem. Soc. 1995, 117, 3145.
27.Cicero, R. L.; Linford, M. R.; Chidsey, C. E. D. Langmuir 2000, 16, 5688. 28.Buriak, J. M.; Allen, M. J. J. Am. Chem. Soc. 1998, 120, 1339.
29.Stewart, M. P.; Buriak, J. M. J. Am. Chem. Soc. 2001, 123, 7821. 30.Webb, L. J.; Nemanick, E. J.; Biteen, J. S.; Knapp, D. W.; Michalak, D.
J.; Traub, M. C.; Chan, A. S. Y.; Brunschwig, B. S.; Lewis, N. S. J. Phys. Chem. B 2005, 9, 3930.
31.Yu, H. B.; Webb, L. J.; Ries, R. S.; Solares, S. D.; Goddard, W. A.; Heath, J. R.; Lewis, N. S. J. Phys. Chem. B 2005, 109, 671.
32.Webb, L. J.; Lewis, N. S. J. Phys. Chem. B 2003, 107, 5404.
Chem. B 2001, 105, 10266.
34.Royea, W. J.; Juang, A.; Lewis, N. S. Appl. Phys. Lett. 2000, 77, 1988. 35.Bansal, A.; Lewis, N. S. J. Phys. Chem. B 1998, 102, 4058.
36.Solares, S. D.; Yu, H.; Webb, L. J.; Lewis, N. S.; Heath, J. R.; Goddard, W. A., III. J. Am. Chem. Soc. 2006, 128, 3850.
37.Yu, H.; Webb, L. J.; Heath, J. R.; Lewis, N. S. Appl. Phys. Lett.2006, 88, 252111. 38.Ciampi, S.; Böcking. T.; Kilian, K. A.; James, M.; Harper, J. B.; Gooding, J. J.
Langmuir, 2007, 23, 9320.
39.Nemanick, E. J. Chemical and Electrical Passivation of Single Crystal Silicon Surfaces through Covalently Bound Organic Monolayers, Caltech Ph.D. Thesis, 2005.
40.Nemanick, E. J.; Hurley, P. T.; Brunschwig, B. S.; Lewis, N. S. J. Phys. Chem. B 2006, 110, 14800–14808.
41.Hurley, P. T.; Nemanick, E. J.; Brunschwig, B. S.; Lewis, N. S., J. Am. Chem. Soc.2006, 128, 9990–9991.
42.Kolb, H. C.; Finn, M. G., Sharpless, K. B. Angew. Chem., Int. Ed. 2001,
40, 2004.
43.Bock, V. D.; Hiemstra, H.; van Maarseveen, J. H. Eur. J. Org. Chem. 2006, 51, and references therein.
44.Zhang, Y.; Luo, S.; Tang, Y.; Yu, L.; Hou, K.-Y.; Cheng, J. P.; Zeng, X.; Wang, P. G. Anal. Chem. 2006, 78, 2001.
45.Lummerstorfer, T.; Hoffmann, H. J. Phys. Chem. B 2004, 108, 3963. 46.Lee, J. K.; Chi, Y. S.; Choi, I. S. Langmuir 2004, 20, 3844.
47.Li, H.; Cheng, F.; Duft, A. M.; Adronov, A. J. Am. Chem. Soc. 2005, 127, 14518.
48.Zirbs, R.; Kienberger, F.; Hinterdorfer, P.; Binder, W. H. Langmuir 2005,
21, 8414.
49.Collman, J. P.; Devaraj, N. K.; Chidsey, C. E. D. Langmuir 2004, 20, 1051. 50.Collman, J. P.; Devaraj, N. K.; Eberspacher, T. P. A.; Chidsey, C. E. D.
Langmuir 2006, 22, 2457.
Chem. Soc. 2006, 128, 1794.
52.Devaraj, N. K.; Miller, G. P.; Ebina, W.; Kakaradov, B.; Collman, J. P.; Kool, E. T.; Chidsey, C. E. D. J. Am. Chem. Soc. 2005, 127, 8600.
53.Giovanelli, D.; Lawrence, N. S.; Jiang, L.; Jones, T. G. J.; Compton, R. G.
Anal. Lett. 2003, 36, 2941.
54.Rousell, C.; Rohner, T. C.; Jensen, H.; Girault, H. H. ChemPhysChem 2003,
4, 200.
55.Zheng, A.; Shan, D.; Binghe, W. J. Org. Chem. 1999, 64, 156.
56.Yeo, W.-S.; Hodneland, C. D.; Mrksich, M. ChemBioChem 2001, 590.
57.Cao, P.; Yu, H.; Heath, J. R. J. Phys. Chem. B, 2006, 110, 23615.
58.Haber, J. A.; Lewis, N. S. J. Phys. Chem. B 2002, 106, 3639.
59.Babiæ-Samardzija, K.; Lupu, C.; Hackerman, N.; Barron, A. R.; Luttge, A.
2.1 Introduction
In vitro diagnostic tests can be instrumental in the characterization of disease
pathways and mechanisms of cancer, providing more-targeted treatment plans and better
survival rates for patients. Quantitative, multi-parameter measurements of proteins in the
blood, which monitor the changes in protein levels in a patient, will revolutionize in vitro
diagnostics. A major challenge in realizing this goal is to find an efficient and general
approach for producing protein capture agents for protein-biomarker-based detection that
have positive attributes of antibodies, and exhibit a high level of chemical and
biochemical stability. Antibodies are proteins and are, thus, unstable towards thermal
shock, dehydration, pH variation, degradation and many chemical processes. In addition,
developing a high affinity and selectivity antibody is very expensive and time consuming.
Therefore, commercial antibodies do not exist for all proteins.1 This is becoming an
increasingly important problem as diagnostic measurements of proteins are quickly
moving from single parameter to multi-parameter assays of large panels of biomarkers.2–4
Despite the drawbacks, antibodies remain the standard protein capture agent used in
protein assays because of their high sensitivity and selectivity for their cognate proteins.
Nucleic acid aptamers, small molecules, and phage-display peptides are
alternatives to antibodies. Nucleic acid aptamers5–7 are promising alternatives, with an
extensive sequence space that can be screened in parallel (~ 1015 elements).8 However,
the chemical diversity of aptamers is typically limited to 4 chemical constituents rather
than 20 amino acids compared to peptides. Although, aptamers have been prepared as
![Figure 1.2 High-resolution XPS spectra of H-C≡C-[Si(111)], and of that surface following the click reaction to form 1s and the reduction of 1s to 2s](https://thumb-us.123doks.com/thumbv2/123dok_us/1126484.1141521/37.612.105.544.131.402/figure-high-resolution-spectra-surface-following-reaction-reduction.webp)
![Figure 1.4 ATR-FTIR characterization of a H-[Si(111)] and of H-C≡C-[Si(111)] in the region of the 2083 cm-1 Si-H mode](https://thumb-us.123doks.com/thumbv2/123dok_us/1126484.1141521/43.612.102.546.65.256/figure-atr-ftir-characterization-si-si-region-mode.webp)
![Figure 1.5 Demonstration of bioattachment to H-C≡C-[Si(111)], through reductive formation of 2s followed by the amide coupling of biotin](https://thumb-us.123doks.com/thumbv2/123dok_us/1126484.1141521/44.612.105.546.308.588/figure-demonstration-bioattachment-reductive-formation-followed-coupling-biotin.webp)