ISSN: 2319-8753
I
nternational
J
ournal of
I
nnovative
R
esearch in
S
cience,
E
ngineering and
T
echnology
(An ISO 3297: 2007 Certified Organization)
Vol. 2, Issue 10, October 2013
Copyright to IJIRSET www.ijirset.com 5752
ADSORPTION OF CADMIUM (II) AND
LEAD (II) FROM A STOCK SOLUTION
USING NEEM LEAVES POWDER AS A
LOW-COST ADSORBENT
Ghanshyam G. Pandhare
1, Nikhilesh Trivedi
2, Rajesh Pathrabe
3, S. D. Dawande
4M.Tech, Dept. of Chemical Engineering, Laxminarayan Institute of Technology, Nagpur, India1,2
B.Tech, Dept. of Chemical Engineering, Laxminarayan Institute of Technology, Nagpur, India3
Associate Professor, Dept. of Chemical Engineering, Laxminarayan Institute of Technology, Nagpur, India4
Abstract :The study on performance of low-cost adsorbent such as Neem leaves powder in the removal of Cadmium (II) and Lead (II) ion from aqueous solution is performed. In present study Neem Leaves Powder adsorbent prepared using chemical activation process and the surface area measured. The adsorbent material adopted was found to be an efficient media for removal of Cadmium (II) and Lead (II) ion with different parameter like Adsorbent dosages, Concentration and contact time etc. A comparative study has also been done on the adsorption capacity of Neem Leaves Powder. The column studies were conducted with different contact time and reduced concentration determines using Atomic Absorption Spectrophotometer (AAS). It was found that the metal uptake capacity (amount of removal) of Cadmium (II) and Lead (II) ion decreased but the adsorption capacity (percentage of removal) increased with the decrease in the concentration of Cadmium (II) and Lead (II) in the initial sample solution. Correlation coefficient and isotherm constant was also calculated from isotherm studies with different parameter.
Keywords: Adsorption, Neem leaves Powder, Cadmium, Lead, Fixed column, Freundlich and Langmuir Isotherm
I. INTRODUCTION
Adsorption is effectively in removing trace components from a liquid phase and may be used either to recover the components or simply to remove noxious substance from industrial waste. Any potential application of adsorption has to be considered along with alternatives such as distillation, absorption and liquid extraction. Each separation process exploits a difference between properties of substance to separate. In distillation the property applied is volatility, in absorption it is solubility, in extraction it is distribution coefficient. Separation by adsorption depends on one component being more readily adsorbed than other. The selection of a suitable process depends upon the ease with which the separated components are removed.
Adsorption is present in many natural physical, biological, and chemical systems, and is widely used in industrial applications such as activated charcoal, capturing and using waste heat to provide cold water for air conditioning and other process requirements (adsorption chillers), synthetic resins, increase storage capacity of carbide-derived carbons for carbon, and water purification.
ISSN: 2319-8753
I
nternational
J
ournal of
I
nnovative
R
esearch in
S
cience,
E
ngineering and
T
echnology
(An ISO 3297: 2007 Certified Organization)
Vol. 2, Issue 10, October 2013
Copyright to IJIRSET www.ijirset.com 5753
copper consumption in high doses brings about serious toxicological concerns since it can be deposited in the brain, skin, liver, kidney damage and anemia. Lead (Pb) has been cited as one of the three most toxic heavy metals that have latent long-term negative impacts on health, causing anemia, encephalopathy, hepatitis and nephritic syndrome [17]. Cadmium also exposes human health to severe risks, as it can provoke cancer, kidney damage, mucous membrane destruction, vomiting, bone damage as well as affect the production of progesterone and testosterone [15]. Moreover, the presence of nickel exceeding its critical level might bring about serious lung and kidney problems.
Cadmium can mainly be found in the earth's crust. Cadmium also consists in the industries as an inevitable by-product of zinc an. After being applied it enters the environment mainly through the ground, because it is found in manures and pesticides. Naturally a very large amount of cadmium is released into the environment, Lead occurs naturally in the environment. However, most lead concentrations that are found in the environment are a result of human activities. Due to the application of lead in gasoline an unnatural lead-cycle has consisted. In car engines lead is burned. These lead salts enter the environment through the exhausts of cars. The larger particles will drop to the ground immediately and pollute soils or surface waters, the smaller particles will travel long distances through air and remain in the atmosphere. Lead is a soft metal that has known many applications over the years. It has been used widely since 5000 BC for application in metal products, cables and pipelines, but also in paints and pesticides. Lead is one out of four metals that have the most damaging effects on human health.
II. MATERIALS AND METHOD
The Neem tree (Azadirachta indica A. Juss.) has been known as the wonder tree for centuries in the Indian subcontinent. It has become important in the global context today because it Offers answers to the major concerns facing mankind. The history of the Neem tree is inextricably linked to the history of the Indian way of life. Although the antiquity of Neem is shrouded in the mists of time, this evergreen robust looking tree has long been cherished as a symbol of health in the country of its origin. It has, for a very long time, been a friend and protector of the Indian village. It contains recommendations for specific trees to be planted in the vicinity of one’s house. Neem was highly recommended. The medical properties of Neem have been known to Indians since time immemorial.
A. Objective of the Present Work:
The objective of the present work is conversion of agricultural waste material like Neem leaves into adsorbent, characterization and study of utility in removal of two metals namely Cd and Pb from aqueous solution.
The present Work is divided into following parts:
Synthesis of adsorbent by using chemical activation thermal technique Characterization of adsorbent
Adsorption study for removal of Cd and Pb from aqueous solution
B. Characterization of the synthesized adsorbent obtained from Neem leaves powder by BET method:
The surface area of carbon obtained from Neem leaves powder is determined by Brunauer, Emmett and Teller (BET) N2 sorption procedure with liquid N2 at 217.15oC. The specific surface area is found to be 421 m2/g.
C. Batch Adsorption Experiments:
Batch experiments are performed with 100ml of a sample solution and a desired adsorbent dose of 1 to 5 gm and parameter like contact time, concentration of solution. The mixture is transferred into a 250 ml conical flask and stirred for 48 hour, filtered and analyzed for its absorbance and concentration. All experiments are performed at room temperature conditions. Absorbance and concentration determine by Atomic absorption spectrophotometer.
D. Preparation of Absorbent
Initially Neem leaves were washed repeatedly by using distilled water to remove moisture and soluble impurities. Then neem leaves kept in dryer at 900C, for2-3 hrs till leaves turn pale yellow. Then crushed and screen by 10-15um mesh size.
ISSN: 2319-8753
I
nternational
J
ournal of
I
nnovative
R
esearch in
S
cience,
E
ngineering and
T
echnology
(An ISO 3297: 2007 Certified Organization)
Vol. 2, Issue 10, October 2013
Copyright to IJIRSET www.ijirset.com 5754
About 20 gm of sample and 10ml of Ortho-H3PO4 acid taken in silica crucible and kept in furnace. The furnace is initially at normal room temperature then furnace set at 2600C. Heating was carried out for 20 minute. Then sample was removed and cool. After cooling the sample was repeatedly washed for 7 times using hot water to remove free acid and moisture .Then sample kept in dryer for 20-25 minute and the activated black color adsorbent stored in bottle.
E. Preparation of Cadmium chloride solution
In a clean beaker 100 ml distilled water is heated, in this boiling water 0.6131 gm of Cadmium chloride added with constant stirring .Then solution shake well and cooled, then solution make 1000ppm and take 10ml of this to make 100ppm solution after this the various concentration of solution prepared for experimental procedure.
F. Preparation of Lead nitrite solution
In a clean beaker 100 ml distilled water taken add 0.3213 gm of Lead Nitrite with constant stirring .Then solution shake well, then solution make 1000ppm and take 10ml of this to make 100ppm solution after this the various concentration of solution prepared for experimental procedure.
III. RESULTS AND DISCUSSION
1. Observation Table for CdCl2 Solution:
1.1. Effect of Concentration:
Effect of initial metal ion concentration (C0) on the amount of metal adsorbed (q) at pH 6.5 is presented in
table no. 1 The maximum quantities of q were achieved by chemically activated Neem leaves powder adsorbent. The q values increased with increase in initial ion concentration (C0). This increase is probably due to a high driving force for
mass transfer. When the concentration of metal ions in solution was higher, the adsorption capacity increased. Absorbance and concentration determine by Atomic absorption spectrophotometer
Table 1: AAS Reading of CdCl2 solution with Concentration Sr.no. Conc. Of CdCl2
Soln (Co)
Wt. of Adsorbent
Absorbance % Adsorption Adsorbed Cadmium (q)
(ppm)
1 05ppm/100ml 1gm 0.76 65.26% 3.263
2 10ppm/100ml 1gm 0.62 73.66% 7.366
3 15ppm/100ml 1gm 0.48 86.62% 12.993
4 20ppm/100ml 1gm 0.42 91.15% 18.23
5 25ppm/100ml 1gm 0.30 95.02% 23.755
The figure 1 shows the reduced absorbance of CdCl2 from different concentration of solution, It can be concluded that the concentration of solution reduced using 1gm of adsorbent and the adsorption of Cd increases at desired parameter. the % Adsorption for CdCl2 using 100ml solution of various concentrations with 1gm of adsorbent. And figure 2 indicates the % Adsorption with various amount of concentration.
Figure1: Conc. Of solution (CdCl2) Vs Absorbance Figure2: Conc. Of solution (CdCl2) Vs % Adsorption
0 0.2 0.4 0.6 0.8
0 10 20 30
ab
sor
b
an
ce
conc (ppm)
0 50 100
0 10 20 30
%
Ad
sor
p
tion
conc. (ppm)
ISSN: 2319-8753
I
nternational
J
ournal of
I
nnovative
R
esearch in
S
cience,
E
ngineering and
T
echnology
(An ISO 3297: 2007 Certified Organization)
Vol. 2, Issue 10, October 2013
Copyright to IJIRSET www.ijirset.com 5755
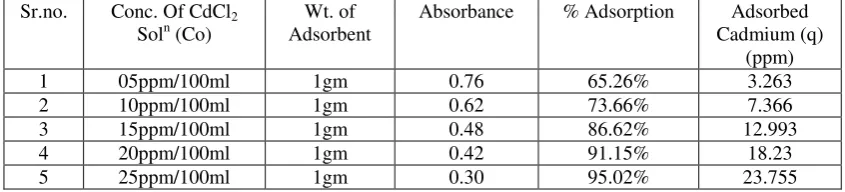
1.2 Effects of Adsorbent Dosages:
Adsorbent dosage is one of the important parameter of adsorption. The effect of adsorption dosage was determined at initial metal ions concentration of 10ppm/100ml and at pH 6.5. The results summarized in Table no. 2
indicate that, with the increase in dosage of adsorbent, the amount of metal ion concentration per unit mass of the adsorbent decreased but the percentage of adsorption increased. This effect can be due to some of adsorption sites remaining unsaturated during the adsorption reaction.
Table 2: AAS Reading of CdCl2 solution with adsorbent dosages Sr.no. Wt. of Adsorbent Conc. Of CdCl2 Soln
(Co)
Absorbance % Adsorption
Adsorbed Cadmium (q)
(ppm)
1 1gm 10ppm/100ml 0.45 81.04% 8.104
2 2gm 10ppm/100ml 0.43 81.92% 8.192
3 3gm 10ppm/100ml 0.39 83.15% 8.365
4 4gm 10ppm/100ml 0.37 84.48% 8.448
5 5gm 10ppm/100ml 0.35 88.65% 8.865
The figure 3 shows the reduced absorbance of CdCl2 from different wt. of adsorbent, It can be concluded that the different wt. of adsorbent reduced the concentration of solution and the adsorption of Cd increases at desired parameter. the % Adsorption for CdCl2 solution using various weight of adsorbent and 10ppm/100ml CdCl2 solution figure 4 indicates the % Adsorption with various weight of adsorbent.
Figure3: Wt. of Adsorbent Vs Absorbance Figure4: Wt. of Adsorbent Vs % Adsorption
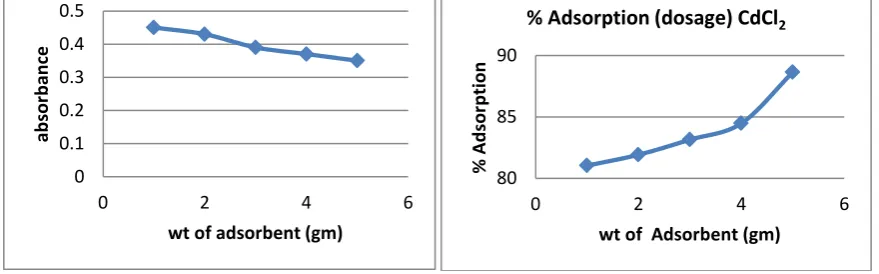
1.3 Effect of Contact Time:
Contact time also one of the important parameter of adsorption. The effect of contact time was determined at initial metal ions concentration of 10ppm/100ml and at pH 6.5. The results summarized in Table 3 indicate that, with the increase in contact time, the amount of metal ion concentration per unit mass of the adsorbent decreased but the percentage of adsorption increased. This effect can be due to some of adsorption sites remaining unsaturated during the adsorption reaction.
Table 3: AAS Reading of CdCl2 solution with contact time Sr.no Contact time of
CdCl2 Soln
Wt. of Adsorbent Absorbance % Adsorption Adsorbed Cadmium (q)(ppm)
1 12hr 1gm/100ml 0.45 81.34% 8.134
2 24hr 1gm/100ml 0.34 86.75% 8.675
3 36hr 1gm/100ml 0.25 89.74% 8.974
4 48hr 1gm/100ml 0.23 90.75% 9.075
5 60hr 1gm/100ml 0.16 93.33% 9.333
0 0.1 0.2 0.3 0.4 0.5
0 2 4 6
ab
sor
b
an
ce
wt of adsorbent (gm)
80 85 90
0 2 4 6
%
Ad
sor
p
tion
wt of Adsorbent (gm)
ISSN: 2319-8753
I
nternational
J
ournal of
I
nnovative
R
esearch in
S
cience,
E
ngineering and
T
echnology
(An ISO 3297: 2007 Certified Organization)
Vol. 2, Issue 10, October 2013
Copyright to IJIRSET www.ijirset.com 5756
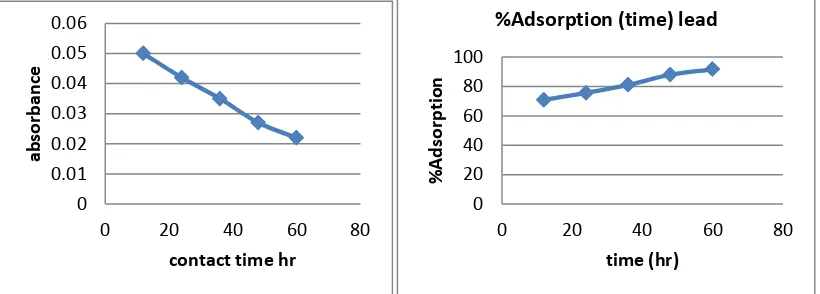
The figure 5 shows the reduced absorbance of CdCl2 from different contact time, It can be concluded that the different contact time reduced the concentration of solution and the adsorption of Cd increases at desired parameter. Following fig. 6 shows the % Adsorption for CdCl2 solution using various contact time.
Figure5: Contact time (hr) Vs Absorbance Figure6: Contact time (hr) Vs %Adsorption
2. Observation Table for Lead NitriteSolution:
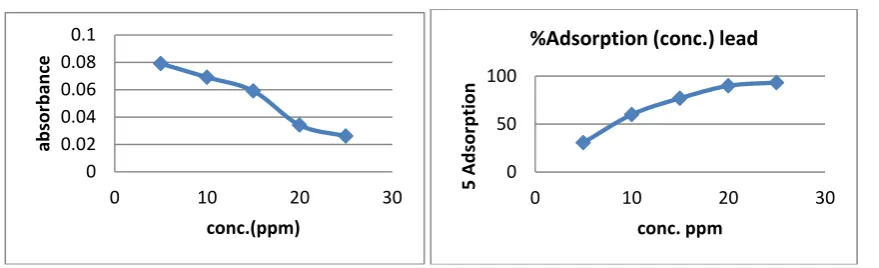
2.1. Effect of Concentration:
Effect of initial metal ion concentration (C0) on the amount of metal adsorbed (q) at pH 7 is presented in table
no. 4 The maximum quantities of q were achieved by chemically activated Neem leaves powder adsorbent. The q values increased with increase in initial ion concentration (C0). This increase is probably due to a high driving force for
mass transfer. When the concentration of metal ions in solution was higher, the adsorption capacity increased. Absorbance and concentration determine by Atomic absorption spectrophotometer
Table 4: AAS Reading of Lead nitrite solution with concentration Sr. no. Conc. Of Lead Nitrite Soln
(Co)
Wt. of Adsorbent Absorbance % Adsorption Adsorbed Lead
(q)(ppm)
1 05ppm/100ml 1gm 0.079 30.68% 1.534
2 10ppm/100ml 1gm 0.069 59.99% 5.999
3 15ppm/100ml 1gm 0.059 77% 11.551
4 20ppm/100ml 1gm 0.034 89.97% 17.995
5 25ppm/100ml 1gm 0.026 93.32% 23.332
The figure 7 shows the reduced absorbance of lead nitrite from different concentration of solution, It can be concluded that the concentration of solution reduced using 1gm of adsorbent and the adsorption of lead increases at desired parameter Following fig 8 shows the % Adsorption for 100ml lead nitrite solution with 1gm of adsorbent
0 0.1 0.2 0.3 0.4 0.5
0 20 40 60 80
ab
sor
b
an
ce
s
time (hr)
80 85 90 95
0 20 40 60 80
%
Ad
sor
p
tion
time (hr)
ISSN: 2319-8753
I
nternational
J
ournal of
I
nnovative
R
esearch in
S
cience,
E
ngineering and
T
echnology
(An ISO 3297: 2007 Certified Organization)
Vol. 2, Issue 10, October 2013
Copyright to IJIRSET www.ijirset.com 5757
Figure7: Conc. Of solution (lead Nitrite) Vs Absorbance Figure8: Conc. Of solution (lead Nitrite) Vs % Adsorption
2.2. Effect of Adsorbent Dosages:
Adsorbent dosage is one of the important parameter of adsorption. The effect of adsorption dosage was determined at initial metal ions concentration of 10 ppm/100ml and at pH 7. The results summarized in Table no 5 indicate that, with the increase in dosage of adsorbent, the amount of metal ions per unit mass of the adsorbent decreased but the percentage of adsorption increased. This effect can be due to some of adsorption sites remaining unsaturated during the adsorption reaction.
Table 5: AAS Reading of lead nitrite solution with adsorbent dosages Sr.no. Wt. of Adsorbent Conc. Of Lead Nitrite
Soln (Co)
Absorbance % Adsorption Adsorbed Lead
(ppm) (q)
1 1gm 10ppm/100ml 0.067 61.36% 6.136
2 2gm 10ppm/100ml 0.056 67.29% 6.729
3 3gm 10ppm/100ml 0.038 78.03% 7.803
4 4gm 10ppm/100ml 0.012 92.84% 9.284
5 5gm 10ppm/100ml 0.002 98.83% 9.883
The figure9 shows the reduced absorbance of lead nitrite from different wt. of adsorbent. It can be concluded that the different wt. of adsorbent reduced the concentration of solution and the adsorption of lead increases at desired parameter. the % Adsorption for lead nitrite solution using various weight of adsorbent and 10ppm/100ml solution of lead nitrite fig.10 shows % Adsorption using various amount of adsorbent dosages.
Figure9: Wt. of Adsorbent Vs Absorbance Figure10: Wt. of Adsorbent Vs % Adsorption
0 0.02 0.04 0.06 0.08 0.1
0 10 20 30
ab
sor
b
an
ce
conc.(ppm)
0 50 100
0 10 20 30
5 Ad
sor
p
tion
conc. ppm
%Adsorption (conc.) lead
0 0.02 0.04 0.06 0.08
0 2 4 6
ab
sor
b
an
ce
wt. of adsorbent (gm)
0 50 100 150
0 2 4 6
%
Ad
sor
p
tion
wt of adsorbent (gm)
ISSN: 2319-8753
I
nternational
J
ournal of
I
nnovative
R
esearch in
S
cience,
E
ngineering and
T
echnology
(An ISO 3297: 2007 Certified Organization)
Vol. 2, Issue 10, October 2013
Copyright to IJIRSET www.ijirset.com 5758
2. 3. Effect of Contact Time:
Contact time also one of the important parameter of adsorption. The effect of contact time was determined at initial metal ions concentration of 10ppm/100ml and at pH 7. The results summarized in Table no. 6 indicate that, with the increase in contact time, the amount of metal ion concentration per unit mass of the adsorbent decreased but the percentage of adsorption increased. This effect can be due to some of adsorption sites remaining unsaturated during the adsorption reaction.
Table 6: AAS Reading of Lead Nitrite solution with contact time Sr. no Contact time of Lead
Nitrite Soln
Wt. of Adsorbent Absorbance % Adsorption Adsorbed Cadmium
(ppm)
1 12hr 1gm/100ml 0.05 70.77% 7.077
2 24hr 1gm/100ml 0.042 75.6% 7.56
3 36hr 1gm/100ml 0.035 81.03% 8.103
4 48hr 1gm/100ml 0.027 87.95% 8.795
5 60hr 1gm/100ml 0.022 91.66% 9.166
The figure11 shows the reduced absorbance of lead nitrite from different contact time, It can be concluded that the different contact time reduced the concentration of solution and the adsorption of lead increases at desired parameter. the % Adsorption for lead nitrite solution using various weight of adsorbent and figure12 shows the % Adsorption using various contact time.
Figure11: Contact time (hr) Vs Absorbance Figure12: Contact time (hr) Vs % Adsorption
3. Adsorption isotherm 3.1 Freundlich isotherm
The Freundlich isotherm model is the well-known earliest relationship describing the adsorption process. This model applies to adsorption on heterogeneous surfaces with the interaction between adsorbed molecules, and the application of the Freundlich equation also suggests that sorption energy exponentially decreases on completion of the sorption of an adsorbent. This isotherm is an empirical equation and can be employed to describe heterogeneous systems and is expressed as follows in linear form:
Original form: q = Kf C 1/n
Linearised form: log q = log Kf + (1/n) log C
Where Kf and 1/n is the Freundlich constant related to the bonding energy, 1/n is the heterogeneity factor and n is a measure of the deviation from linearity of adsorption. Freundlich equilibrium constants were determined from the plot of log q versus log C, on the basis of the linear of Freundlich equation. The n value indicates the degree of nonlinearity between solution concentration and adsorption as follows: if n = 1, then adsorption is linear; if n < 1, then adsorption is a chemical process; if n > 1, then adsorption is a physical process. The n value in Freundlich equation was found since n lies between 1 and 10, this indicates the physical biosorption of cadmium (II) and lead (II)
0 0.01 0.02 0.03 0.04 0.05 0.06
0 20 40 60 80
ab
sor
b
an
ce
contact time hr
0 20 40 60 80 100
0 20 40 60 80
%
A
d
sor
p
tion
time (hr)
ISSN: 2319-8753
I
nternational
J
ournal of
I
nnovative
R
esearch in
S
cience,
E
ngineering and
T
echnology
(An ISO 3297: 2007 Certified Organization)
Vol. 2, Issue 10, October 2013
Copyright to IJIRSET www.ijirset.com 5759
3.2 Langmuir isotherm
The Langmuir isotherm assumes monolayer adsorption on a uniform surface with a finite number of adsorption sites. Once a site is filled, no further sorption can take place at that site. As such, the surface will eventually reach a saturation point where the maximum adsorption of the surface will be achieved. The linear form of the Langmuir isotherm model is described as,
Original form: Q = (qm. KL. C)/ (1+ KL.C) Linearised form: C/q = 1 / (KL.qm) + (C/qm)
Where KL is the Langmuir constant related to the energy of adsorption and qmax is the maximum adsorption capacity (mg/gm). Values of Langmuir parameters qmax and
KL was calculated from the slope and intercept of the linear plot of 1/qe versus 1/C as shown in Figures. Values of qmax, KL, and regression coefficient R2 are listed. These values for Neem Leaves Adsorbent indicate that Langmuir theory describes the adsorption phenomena as favorable. The essential characteristics of the Langmuir isotherm parameters can be used to predict the affinity between the adsorbate and adsorbent using separation factor.
This equation straight line plot of log q Vs log C should be straight line with slope 1/n and intercept log K however it is actually found that the plot were straight line at low concentration, while at higher concentration they showed a straight curvature especially at low this indicate that Freundlich equation approximate and does not apply to adsorption of gases by solids at high conc.
Freundlich and Langmuir isotherm model for different adsorbent Dosages with CdCl2
Freundlich isotherm and Langmuir isotherm model for different concentration with CdCl2
y = 0.7755x + 0.04 R² = 0.7
0 0.5 1
0 0.5 1
Log q
Log c
Freundlich Isotherm
y = 1.0269x + 0.1 R² = 0.7929
0 0.2 0.4 0.6 0.8
0 0.2 0.4 0.6
1/q
1/C
Langmuir Isotherm
y = 0.5845x + 0.0888 R² = 0.9731
0 0.5 1
0 0.5 1 1.5
Log q
Log C
Freundlich Isotherm
y = 0.9279x + 0.114 R² = 0.9571
0 0.2 0.4 0.6
0 0.1 0.2 0.3 0.4
1/q
1/C
ISSN: 2319-8753
I
nternational
J
ournal of
I
nnovative
R
esearch in
S
cience,
E
ngineering and
T
echnology
(An ISO 3297: 2007 Certified Organization)
Vol. 2, Issue 10, October 2013
Copyright to IJIRSET www.ijirset.com 5760
Freundlich isotherm and Langmuir isotherm model for different contact timewith CdCl2
Freundlich isotherm and Langmuir isotherm model for different Adsorbent dosages with Lead Nitrite
Freundlich isotherm and Langmuir isotherm model for different Concentration with Lead Nitrite
Table 7: Correlation Coefficient (R2) and constant (n & k) of isotherm model for adsorption of CdCl2 solution.
CdCl2 Solution Langmuir isotherm model Freundlich isotherm model
R2 qmax (mg/gm) KL KF n R2
Dosages 0.792 8.104 0.1233 0.775 1.290 0.712
Concentration 0.957 6.755 0.1507 0.584 1.712 0.973
Time 0.787 3.276 0.3052 0.819 1.221 0.789
y = 0.819x - 0.2486 R² = 0.7897
0 0.2 0.4 0.6
0 0.5 1
lo
g
q
log C
Freundlich Isotherm
y = 1.5935x + 0.1646 R² = 0.7872
0 0.2 0.4 0.6 0.8
0 0.1 0.2 0.3 0.4
1/q
1/C
Langmiur Isotherm
y = 0.729x - 0.0875 R² = 0.6413
0 0.2 0.4 0.6 0.8
0 0.5 1
lo
g
q
log c
Freundlich Isotherm
y = 1.0217x + 0.1965 R² = 0.6725
0 0.2 0.4 0.6 0.8
0 0.2 0.4 0.6
1/q
1/c
Langmuir Isotherm
y = 0.8315x + 0.3888 R² = 0.6493
0 0.5 1
0 0.2 0.4 0.6
Log q
Log C
Freundlich Isotherm
y = 1.2754x + 0.2129 R² = 0.5885
0 0.2 0.4 0.6 0.8
0 0.2 0.4 0.6
1/q
1/C
ISSN: 2319-8753
I
nternational
J
ournal of
I
nnovative
R
esearch in
S
cience,
E
ngineering and
T
echnology
(An ISO 3297: 2007 Certified Organization)
Vol. 2, Issue 10, October 2013
Copyright to IJIRSET www.ijirset.com 5761
Table 8: Correlation Coefficient (R2) and constant (n & k) of isotherm model for adsorption of Lead Nitrite solution.
Lead Nitrite Solution
Langmuir isotherm model Freundlich isotherm model
R2 qmax (mg/gm) KL KF n R2
Dosages 0.672 3.508 0.2417 0.729 1.371 0.641
Concentration 0.877 5.995 0.1507 0.729 1.371 0.786
Time 0.588 5.864 0.2850 0.831 1.203 0.649
In order to determine the adsorption isotherm, chemically activated Neem Leaves Powder adsorbent used. The experiments were performing at various parameters like concentration (ppm), weight of adsorbent (gm), contact time (hr). The effect of final concentration (C) on the Cadmium and lead adsorbed per specific mass of adsorbent q (mg/gm) is presented in figure. The shape of adsorption isotherm indicates that adsorption of Cadmium from CdCl2 solution and Lead from Lead Nitrite on Neem leaves powder adsorbent
IV. CONCLUSION
Batch Adsorption studies were performed for removal of Cadmium (II) and Lead (II) ion from stock solution using different concentration, adsorbent dosages, and contact time. The study indicated the suitability of the adsorbent for removal of Cadmium (II) and Lead (II) ion from aqueous solutions. The adsorbent may be viewed as a useful material while considering the economic aspects of wastewater treatment. The obtained results may be summarized as follows:
The metal uptake capacity decreases with decrease in the initial concentration of Cadmium (II) and Lead (II) solutions. However, the percentage of removal or the adsorption capacity is found to increase with lower initial values of different parameter.
The observed order of metal uptake capacity as well as adsorption capacity of Cadmium (II) and Lead (II) ion with different concentration, adsorbent dosages, and contact time parameter are 95.03%, 88.63% and 93.33%
respectively and 93.32%, 98.83%, and 91.66% respectively. These experimental studies on the specified adsorbent would be quite useful in developing an appropriate technology for the removal of Cadmium (II) and Lead (II) ions from contaminated industrial effluents.
Future scope of work:
1. Similar continuous column studies can be performed for locally available Neem leaves powder adsorbent to compare the metal uptake capacity and adsorption capacities.
2. The metal uptake capacity and adsorption capacity can also be studied at different concentration, adsorbent dosages, pH and contact time. The column bed and by also varying the bed height.
REFERENCES
1) Mohammad Reza Mehrasbi & Zohreh Farahmandkia & Bahareh Taghibeigloo & Azra Taromi “Adsorption of Lead and Cadmium from Aqueous Solution by Using Almond Shells” Water Air Soil Pollut (2009) 199:343–351
2) Kumar Sunil, Gupta Asha, Yadav J.P. “Removal of fluoride by thermally activated carbon prepared from neem leaves (Azadirachtaindica) and kikar leaves (Acacia aeabica)”, Journal of
Environmental Biology March 2008, 29(2) 227-232
3) Venkateswarlu P., Ratnam M.Venkata, Rao D.Subba & Rao Venkateswara “Removal of chromium from an aqueous solution using Azadirachta indica (neem) leaf powder as adsorbent”,
International Journal of Physical Sciences Vol. 2 (8), August 2007 pp. 188-195
4) Kehinde O.Olayinka, Oluwatoyin T.Adetunde, & Aderonke O.Oyeyiola “Comparative analysis of the efficiencies of two low cost adsorbents in the removal of Cr (VI) & Ni (II) from aqueous
solution”, African Journal of Environmental Science and Technology Vol. 3 (11), November 2009 pp. 360-369
5) Velmurugan .P, Kumar Rathina. V, Dhinakaran.G “Dye removal from aqueous solution using low cost adsorbent”, International Journal of Environmental Sciences Volume 1 No.7, 2011 pp
1492-1503
6) Lavecchia Roberto, Pugliese Alessio and Zuorro Antonio “Removal of lead from aqueous solutions by spent tea leaves”.
7) Immicha Ana Paula S, Mundima Bruno , Antônio Augusto Ulson de Souzaa, Selene M. A., de Souzaa Guelli U. “Color removal from textile effluent using Azadirachta indica leaf powder as
an adsorbent”, Proceedings of European Congress of Chemical Engineering (ECCE-6)Copenhagen, 16-20 September 2007
8) Mahvi Amir Hossein, Naghipour Dariush, Vaezi Forugh and Nazmara Shahrokh “Tea waste as An Adsorbent for Heavy Metal Removal from Industrial Wastewaters”, American Journal of
Applied Sciences 2 (1): 2005 372-375
9) Gupta Suresh, Babu B. V. “Economic feasibility analysis of low cost adsorbents for the removal of Cr(VI) from wastewater”
10) Tijani Jimoh Oladejo , Musah Muriana and Blessing Izuelumba “Sorption of Lead (II) and Copper (II) ions from Aqueous Solution by Acid Modified and Unmodified Gmelina Arborea
(Verbenaceae) Leaves” Journal of Emerging Trends in Engineering and Applied Sciences (JETEAS) 2 (5):734-740
11) Gopalakrishnan. S., T. Kannadasan, S. Velmurugan, S. Muthu, and P. Vinoth Kumar “Biosorption of Chromium (VI) from Industrial Effluent using Neem Leaf Adsorbent” Research Journal of Chemical Sciences Vol. 3(4), April (2013) 48-53,
12) Gupta S., Babu B.V., Adsorption of Cr (VI) by a low-cost adsorbent prepared from neem leaves, Proc. Natl. Conf. Environ. Conserv. (2006) 175–180.
13) Bhattacharyya K.G., Sharma A., Adsorption of Pb (II) from aqueous solution by azadirachta indica (Neem) leaf powder, J. Hazard. Mater. B 113 (2004) 97–109.
14) Athar M., Farooq U., Hussain B., Azadirachata indicum (neem): an effective biosorbent for the removal of lead (II) from aqueous solutions, Bull. Environ. Contam. Toxicol. 79 (2007)288–
292.
15) Rao K.S., Mohapatra M, Anand S. , Venkateswarlu P. “Review on cadmium removal from aqueous solutions “ International Journal of Engineering, Science and Technology ENGINEERING, Vol. 2, No. 7, 2010, pp. 81-103
16) Pandhare Ghanshyam G., Trivedi Nikhilesh, Dawande S. D. “ ADSORPTION OF COLOR FROM A STOCK SOLUTION USING NEEM LEAVES POWDER AS A LOW-COST