Article
A Galvanic Coupling Method for Assessing
Hydration Rates
Clement Ogugua Asogwa *, Stephen F. Collins, Patrick Mclaughlin and Daniel T.H. Lai
College of Engineering & Science, Victoria University, Melbourne, VIC 8001, Australia;
[email protected] (S.F.C.); [email protected] (P.M.); [email protected] (D.T.H.L.) *Correspondence: [email protected]; Tel.: +61-3-9919-5047
Academic Editors: Enzo Pasquale Scilingo and Gaetano Valenza Received: 30 May 2016; Accepted: 1 July 2016; Published: 13 July 2016
Abstract:Recent advances in biomedical sensors, data acquisition techniques, microelectronics and wireless communication systems opened up the use of wearable technology for ehealth monitoring. We introduce a galvanic coupled intrabody communication for monitoring human body hydration. Studies in hydration provide the information necessary for understanding the desired fluid levels for optimal performance of the body’s physiological and metabolic processes during exercise and activities of daily living. Current measurement techniques are mostly suitable for laboratory purposes due to their complexity and technical requirements. Less technical methods such as urine color observation and skin turgor testing are subjective and cannot be integrated into a wearable device. Bioelectrical impedance methods are popular but mostly used for estimating total body water with limited accuracy and sensitive to 800 mL–1000 mL change in body fluid levels. We introduce a non-intrusive and simple method of tracking hydration rates that can detect up to 1.30 dB reduction in attenuation when as little as 100 mL of water is consumed. Our results show that galvanic coupled intrabody signal propagation can provide qualitative hydration and dehydration rates in line with changes in an individual’s urine specific gravity and body mass. The real-time changes in galvanic coupled intrabody signal attenuation can be integrated into wearable electronic devices to evaluate body fluid levels on a particular area of interest and can aid diagnosis and treatment of fluid disorders such as lymphoedema.
Keywords:galvanic coupling; signal attenuation; hydration rates; body fluid level
1. Introduction
Assessment of human body composition is fundamental to the understanding of body physiological and metabolic processes. Body fluid contributes up to 60 percent of the mass of the human body. The body’s fluid state is affected by both endogenous processes, such as body metabolism, and exogenous factors such as climatic changes, exercise, disease, and diet. Investigations into hydration are required because they help identify or quantify ill-health and understanding poor exercise performance. Consequences of excessive fluid losses or inadequate fluid intake can include hypohydration, urinary infections, reduction in cognitive function, reduction of cellular metabolism and mortality [1]. The body fluid shifts between the intracellular and the extracellular tissues to maintain water balance. This movement follows an osmotic gradient in order to ensure that optimal concentrations of electrolytes and non-electrolytes are maintained in the cells, tissues, plasma, and interstitial fluid. Two adverse conditions can be identified: hyperhydration, in which there is excess water in the body, and hypohydration or dehydration, when there is less than the normal amount of water to meet the body’s requirement [1] and accurate and easy estimates of hydration levels with cost effective technology are essential to policy makers in setting public health priorities [2], for doctors and clinicians to classify body fluid and cell mass conditions of healthy persons and patients with certain
diseases [3] and for individuals, especially the elderly who are at higher risk of dehydration [3,4]. Further research evidence on the elderly showed that older people who were dehydrated at admission were more likely to die than their counterparts [5].
An electrical signal passing through the human body is strongly affected by the size of the tissue, available fluid and its dielectric properties. Tissues have a high ability to store electrical energy. High frequencies are affected by human body antenna effects and possible radiation. Our frequency range lies between 800 kHz and 1.3 MHz, which lies within theβdispersion region that is related to the
cellular structure of biological materials [6] and can penetrate into the extracellular and intracellular tissue spaces. This also falls within the frequency range (5–1000 kHz) used for whole-body fluid analysis with bioimpedance spectroscopy method [7]. The electrical conduction at this frequency is affected by the amount of water solute available in the tissue spaces. Loss of body fluid, for example, during exercise could cause up to 6% increase in muscle impedance [8]. Thus, by coupling a low frequency electrical signal galvanically on the body, the signal passing through the tissue will vary in attenuation to the changes in the water level. Consequently, the attenuation (negative gain) of the signal amplitude will depend on the composition of the tissue in terms of the amount of water present at the time, the tissue muscle-fat ratio and the input signal frequency. External factors such as the type of electrode, the distance between the connecting electrodes and environmental conditions can be experimentally controlled. Similarly, signal changes due to the effects of limbs around joints [9] can be minimised by avoiding measurement on joint areas.
Techniques for assessing hydration include intrusive and non-intrusive methods. The intrusive method requires intravenous access to the body and is usually performed by trained personnel such as technicians, doctors or nurses. This system requires in vivo access and testing of the blood and is regarded as a later indicator of dehydration rather than a warning system that informs a quick preventative measure [10]. Physical signs such as urine color observation, urine specific gravity test, and body weight changes are some examples of non-intrusive methods for assessing human body hydration [11]. This method gives oversimplified results and poorly sensitive to changes in dehydration [12]. Wearable electronics that measure perspiration metabolites [13] can only estimate the physiological state of an individual’s body fluid level under sweat and not without sweat secretion. Moreover, these techniques can not be used to target fluid disorder on a specific part of the body. The purpose of this work is to introduce a galvanic coupled signal propagation method for assessing hydration rates that can also be used for assessing fluid changes on a particular area of the body. Our results are comparable to previous methods, but present an easier wearable alternative to hydration. We argue that undertaking a composite testing of our proposed system alongside known urinary markers of dehydration is vital to validating our proposed idea. This paper is organised are follows: Section 2 details the modification of our previous circuit model. Section 3 is our methodology and Section 4 is the results. This is followed by discussion in Section 5 and conclusion in Section 6.
2. Modification on Previous Circuit Model
Our group developed a human body circuit model [14], which was later improved by introducing a dynamic tissue impedanceZF(t). We defined hydration as the process of gaining tissue fluid and proposed in [15] a circuit model of real time human body hydration with time variable fluid impedance (Figure1), in whichZESis the impedance of the contact interface to the body at the transmitter and the receiver nodes,ZTcorresponds to the transverse impedance, whileZbis the cross impedance.Viis the transmit voltage, whileV0is the output voltage at the receiver end with loadRl.ZLis the longitudinal impedance of the transmission path consisting of the skin, fat, muscle, and bone, body fluid, cortical bone and bone marrow. We defined the variable impedance due to hydration as:
ZF(t) =Zf0−Zw(1−e−
t
τ)[15], (1)
wheret is the time for the change in impedance to occur,Zf0is the impedance at time t= 0 just
characteristic that predicts the rate of hydration.τis the time constant that characterises the metabolic
process of a particular individual. We found that given an initial fluid volumeVibbefore hydration andVwamount of fluid consumed, the body will hydrate to a fluid volumeVbgiven as:
Vb =Vib+Vwe
t
τ;t=0;Vb =Vib, (2)
and would reach the state of water balance at timetf.
Figure 1.Circuit diagram of galvanic coupled intrabody signal with variable impedance component from variable changes in human body fluid [15], Copyright 2016, IEEE.
Based on this, we propose that the increase in the volume of body fluid, as hydration occurs, increases the volume of tissue fluid which will result in a gain in body weight by an amount equivalent to
wtg=Vwe
t
τ, (3)
wherewtgis gain in weight, since short term changes in body weight can be attributed to loss or gain of body water and 1 mL of water has a mass of one gram [16]. By representing the anthropometric parameter contributing to the longitudinal impedance between the transmitter and the receiver electrode pairs by the cross-sectional area of the muscle-fat,θ, as a ratio. We have
θ= Am Af
, (4)
whereAmandAf are the cross-sectional areas of muscle and fat, respectively, to the distance between the transmitter and receiver electrode pairs. We set 0<θ<1—if we assume highθcorresponded to
low fat index (low BMI) and lowθcorresponded to high fat index (high BMI). BMI by definition is
body weight(wt)divided by square of height(h2), unit is (kg/m2)
BMI= wt
h2. (5)
Assuming no change in height, since all experimental protocols and measurements were completed within 14 h for each participating adult, then,
and a change inwtdue to hydration or dehydration will also result in a change inBMI,
∆wt∝ ∆BMI. (7)
Therefore,θcan be defined in terms of the changes in real body weight. We know from [17,18]
that short term changes in body mass are associated with changes in human body hydration state given by Equation (3). wtg=∆wt. If we assume a BMI mainly due to fat mass, thenθis inversely
proportional to BMI. By these definitions:
∆wt∝ ∆1
θ, (8)
or
∆wtθ=k. (9)
Similarly,
∆wt∝ ∆G, (10)
where∆Gis the change in gain (negative attenuation) of the electrical signal as a result of the change in the body hydration state, measured in dB/minute.∆wtis related toθby a proportionality constant k. If∆wtand θare biological constants, then the constant of proportionality k which affects the
biological behaviour of the body under hydration is also biological and, from Equations (9) and (10), kis a metabolic process equivalent toτ, which, by Mifflin-St. Jeor equation [19], is related to resting
metabolic rate (RMR). A dynamic change in the impedance caused by a change in the human body hydration state would result in a change of the impedance ofZT,ZL, andZbas following:
´
ZT=ZT+ZF(t), (11)
´
ZL=ZL+ZF(t), (12)
´
Zb=Zb+ZF(t). (13)
Similarly,G(f;t;wt;τ).
Thus, the signal attenuationG(f,t,wt,τ)of a galvanically coupled circuit passing through the human body can be expressed in terms of frequency f, time t, change in body weightwt, and a time-dependent constantτrelated to RMR [19]. This expression is similar to our previous expression
of the gainGof a galvanic coupled circuit (Figure1), with the transfer function as shown in [15]. We argued that if Equation (5) defined BMI in terms of excess body fat, then individuals with high BMI will, on average, have a lower hydration rates, will keep water longer in the body, and hence take longer to urinate, and the reverse is true if defined in terms of excess muscle mass. We shall use this relationship to empirically determine the attenuation per unit volume of water consumed in Section 3.
3. Methodology
3.1. Equipment
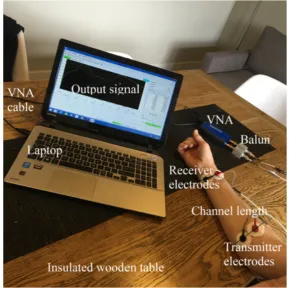
that participants’ diets prior to experiment were controlled and exclusive of supplements, were not taking medical drugs, and are healthy. Moreover, the experiment started after an overnight 12-h fast. We also set the specific gravity measurements as a second test for determining individual hydration level and used it in conjunction with body mass changes for our investigation. We used Hanna digital thermometer model number HI-98509 (Manufactured by Hanna Instruments, Woonsocket, RI, USA,) to measure the temperature of the urine samples. We measured the urine specific gravity of the urine samples at the required temperature of 20.0◦C . A mini Pro Vector Network Analyser (VNA), frequency range 100 kHz to 200 MHz, manufactured by Mini Radio Solutions, Poland, baluns (Coaxial RF transformers, FTB-1-1+, turns ratio of one, manufactured by Mini-Circuits (Brooklyn, NY, USA), and frequency range 0.2–500 MHz), and round pre-gelled self-adhesive Ag/AgCl snap single electrodes (1 cm diameter, manufactured by Noraxon (Noraxon Inc.,Scottsdale, AZ, USA) were used with 20 cm as the separation distance between the transmit and receive electrodes [23] to measure the signal attenuation. The Noraxon self-adhesive Silver/Silver-Chloride electrodes (Ag/AgCl) are preferred because they are designed for both research and clinical use, contain hypoallergenic gel, can be used for two hours of measurement, and reduce the effects of motion artifacts and refection compared to polarizable electrodes. The baluns are used to electrically isolate the two ports of the VNA to ensure the return current does not make a loop through the common ground of the two ports. An off-the-shelf electronic WeightWatchers weight tracking & body composition monitor model number WW125A (made in China) with measurement uncertainty±50 g was used to measure changes in body mass of the subjects. Subjects wore light clothing and were barefoot. Subject height was measured to the nearest 0.5 cm measured against the wall bare footed and heels together with buttocks, shoulders, and head touching the vertical wall surface and clear horizontal marking sighted. Participants were given time to read and understand the experiment procedures and their consents were obtained in line with the approved procedures of the Victoria University Human Research Ethics Committee.
3.2. Experiment I: Hydration Testing
Twenty subjects consisting of 12 males and eight females participated in this experiment. We defined two experimental protocols in this test. First, the hydration measurement protocol, which is preceded by fluid abstinence after supper (latest 10.00 pm) until 10 a.m. to induce dehydration. We measured the level of dehydration on each subject by testing the specific gravity of urine sample 1 collected prior to the start of the experiment. In addition, 600 mL of water was given to each subject to drink and the rate of hydration measured 5 min after intake—this is because water appears in plasma and blood cells within 5 min after consumption [24]. All of the participants sat on a plastic chair and were told not to move as much as humanly possible. The measured arm rested on a wooden table (Figure2) was insulated to ensure no current leakage and to ensure movement artefacts were minimized. In the second protocol, we determined the rate of dehydration after the subjects had urinated following the consumption of 600 mL of water. We also recorded the elapsed time to produce urine by each subject. We established the pre and post hydration states of each subject by testing the individual urine specific gravity of both urine samples 1 and 2 with the hand held refractometer. We observed the urine colour changes and took measurements of the body mass differences with the electronic floor scale. The body mass of each participant was measured asW0before drinking,
W1immediately after drinking andW2after urinating. We used a volumetric cylinder to measure
the volume of urine samples produced after the 600 mL of water intake. Both the hydration and dehydration measurements were measured by taking five measurements of signal attenuation at 5 min intervals, and the average was used. The change in post drink weight and post urination weight was observed and recorded against the refractometer readings and the changes in signal attenuation. Subjects were not permitted to do rigorous exercises during the intervals throughout the period of the experiment, and all measurements were carried out at 10.00 am and average room temperature of 25±0.1 ◦C was maintained throughout. Interference and background noise was minimised by switching off electronic devices and wireless systems around the vicinity. We also isolated communication cables away from power packs and the laptop operated at battery mode. All measurements followed the approved procedures of the Victoria University Human Research Ethics Committee, approval number HRE 14-122.
3.3. Experiment II: Sensitivity Test By Empirical Measurement
Three subjects consented to participate further in this experiment. The experiment was performed on three random days and completed in three weeks. We set the control for the sensitivity test as the average value of the signal attenuation measured for a given period of time before fluid intake. We define our sensitivity as the smallest amount of water consumed that causes a galvanic coupled intrabody signal to amplify beyond the control level after fluid intake. Both the control and the sensitivity test were performed the same day and under the same condition. To measure this, we extended the pre-drink, post drink and the measurements after urinating to 30 min. This is because we observed in experiment I that, while many subjects indicated hydration within twenty minutes, we want to observe, if there was any evidence of hydration occurring after 20 min. The 30 min pre-drink measurement was to serve as a baseline or control test. The sensitivity test followed the process narrated in experiment I, with a variation in the amount of water consumed by the subjects ranging from 100 mL, 250 mL to 300 mL on each day of the experiment. The result is reported in Section 4 for both hydration and dehydration stages.
3.4. Experiment III: Sensitivity Test By Simulation
when all the water consumed is retained within the 20 cm channel length. This will increase the fluid layer thickness to 26 mm, so that for a 100 mL fluid in intake,wtg=0.1 kg. Using the transfer function ofGderived in [15]. We have the sensitivity after consumption of 100 mL of water maximum signal gain occurring when the 100 mL are absorbed within the 20 cm channel length.
4. Results
Table1presents the data from the twenty subjects. Firstly, the weighing scale measurements differed slightly from expected results after 600 mL of fluid intake, i.e.,W1−W06=600 g±(uncertainty
in measurement ) in some cases. However, the change in weight after urinating,W2−W1, corresponded
to the volume of urine produced for most of the subjects. Similarly, urine specific gravity (SPG) measurement decreased from SPG1, measurement after fasting, to SPG2, measurement after fluid intake, as expected. This means that the fluid intake produced rehydration and lowering of the urine density. In a healthy person, the kidney regulates water balance by conserving water or getting rid of excess water relative to the requirement for a healthy water balance [28]. When the amount of water consumed is large enough to reduce the concentration of blood plasma, a urine more dilute than blood plasma is produced; on the other hand, when the available water is too small to dilute the blood plasma concentration, a more concentrated urine than the blood plasma is produced [29]. Higher specific gravity values indicates higher dehydration. These instances are reflected in our result. Therefore, we shall match the changes in the urine specific gravity of the subjects with the differences in weight betweenW2andW0, and the measured attenuation after an intrabody signal is transmitted
galvanically, as explained in the experiment procedure, for our analysis. The average observation on the elapsed time between fluid intake and urination increases with increase in body mass index.
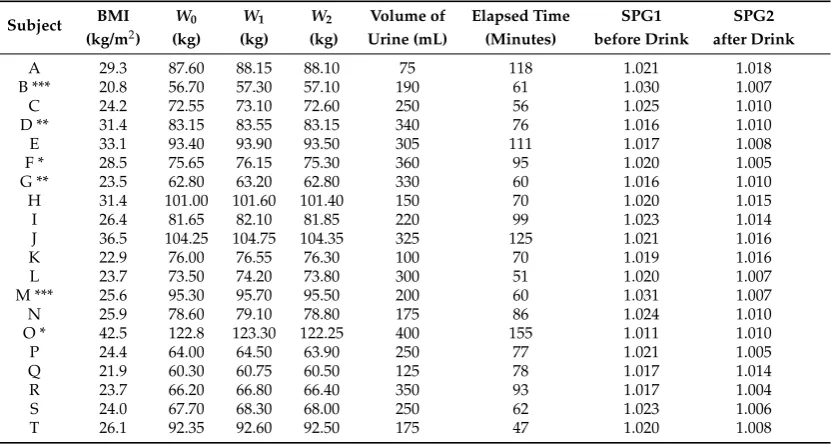
Table 1.Effect of hydration on body weight and urine specific gravity (SPG) on 20 subjects.
Subject BMI W0 W1 W2 Volume of Elapsed Time SPG1 SPG2 (kg/m2) (kg) (kg) (kg) Urine (mL) (Minutes) before Drink after Drink
A 29.3 87.60 88.15 88.10 75 118 1.021 1.018 B *** 20.8 56.70 57.30 57.10 190 61 1.030 1.007 C 24.2 72.55 73.10 72.60 250 56 1.025 1.010 D ** 31.4 83.15 83.55 83.15 340 76 1.016 1.010 E 33.1 93.40 93.90 93.50 305 111 1.017 1.008 F * 28.5 75.65 76.15 75.30 360 95 1.020 1.005 G ** 23.5 62.80 63.20 62.80 330 60 1.016 1.010 H 31.4 101.00 101.60 101.40 150 70 1.020 1.015 I 26.4 81.65 82.10 81.85 220 99 1.023 1.014 J 36.5 104.25 104.75 104.35 325 125 1.021 1.016 K 22.9 76.00 76.55 76.30 100 70 1.019 1.016 L 23.7 73.50 74.20 73.80 300 51 1.020 1.007 M *** 25.6 95.30 95.70 95.50 200 60 1.031 1.007 N 25.9 78.60 79.10 78.80 175 86 1.024 1.010 O * 42.5 122.8 123.30 122.25 400 155 1.011 1.010 P 24.4 64.00 64.50 63.90 250 77 1.021 1.005 Q 21.9 60.30 60.75 60.50 125 78 1.017 1.014 R 23.7 66.20 66.80 66.40 350 93 1.017 1.004 S 24.0 67.70 68.30 68.00 250 62 1.023 1.006 T 26.1 92.35 92.60 92.50 175 47 1.020 1.008
*W2<W0Hyper hydration; **W2=W0Optimal hydration; ***W2>W0Dehydrated.
Subject specific cases were observed based on the assumption that the water consumed was retained or excreted based on the initial body hydration level and the need to maintain homeostasis water balance [28]. In Case 1 Figure3,W2 < W0= Hyper hydration (example, subjects F and O).
Subjects weighed less than the base line weight after urinating and initial specific gravity is low. Subjects produced the largest volume of urine after the specified drink. This suggests excess water in the subjects before the 600mLintake, thusW2<W0. Absorption was observed after subjects had
subjects’ baseline weight was the same as the weight after urinating, and the subjects produced a large amount of urine. The fluid intake after the state of water balance was reached did not cause immediate hydration; therefore, tissue absorption and de-absorption was not continuous and water intake did not cause significant change in signal attenuation. Fluid abstinence before 10.00 a.m. did not make these groups of subjects dehydrate.
Figure 3.Graph of the rate of hydration (A), and dehydration (B), after 600 mL fluid intake on subjects F and O observed at 1.2 MHz,W2<W0. Subjects were hyper hydrated by the protocol.
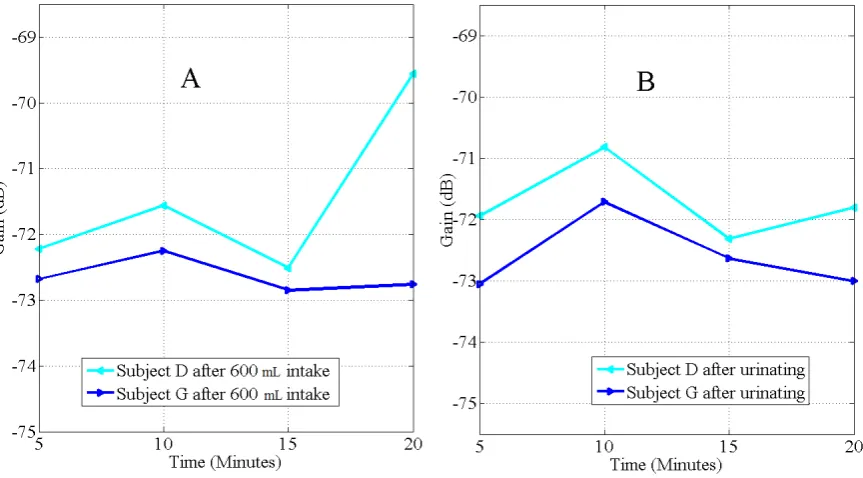
Figure 4. Graph of the rate of hydration (A), and dehydration (B), after 600 mL of fluid intake on subjects D and G at 900 kHz,W2=W0. Subjects were normally hydrated by the protocol.
In Case 3 Figure5,W2>W0= Severe dehydration (example, subjects B and M). Subjects had urine
The rest of the subjects were grouped as Case 4 Figure6,W2>W0, mild dehydration based on the
urine specific gravity reading SPG1 measured before fluid intake. Among this group, the maximum rate of hydration was 0.44 dB/min occurring in subject N, SPG1 = 1.024, while the minimum rate occurred at 0.02 dB/min on subject Q, SPG1 = 1.017. After urination, the maximum rate of dehydration occurred at 0.40 dB/min with subject L, SPG1 = 1.020, while the minimum rate was 0.11 dB/min occurring in subject C, SPG1 = 1.025.
Figure7is the graph of the subject’s BMI against time taken for individual metabolic process to complete and process urine. The figure shows that BMI is related with the time it takes to process urine and is also related with the rate of hydration and dehydration in accordance with our previous findings [15]. Figure8depicts the empirical results of the sensitivity of a galvanic coupled signal to detect hydration due to body fluid intake, while Figure9is the simulation result for a 100 mL maximum fluid absorption with our circuit model.
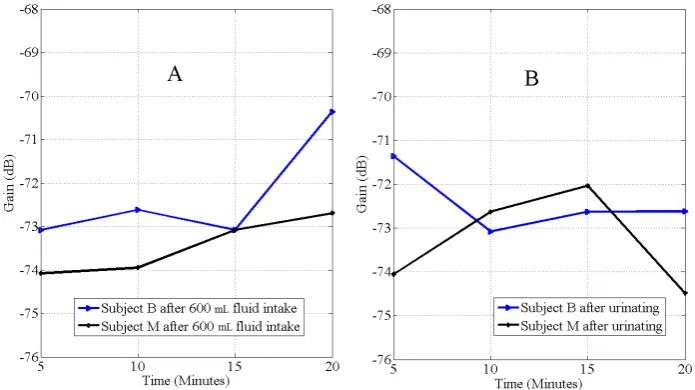
Figure 5. Graph of the rate of hydration (A), and dehydration (B), after 600 mL of fluid intake on subjects B and M observed at 900 kHz,W2 < W0. The protocol produced severe dehydration on
subjects B and M. After urinating, subject B dehydrated and stopped after 10 min, while subject M started dehydration after 15 min. Both showed longer periods of re-absorption.
Figure 6. Graph of the rate of hydration (A), and dehydration (B), after 600 mL of fluid intake on subjects A,C,E,H,I,J,K,L,N,P,Q,R,S and T observed at 900 kHz.W2<W0. The protocol produced mild
Figure 7.Graph of the relation between subject specific body mass index (BMI) and the time it took to urinate after consuming 600 mL of water.
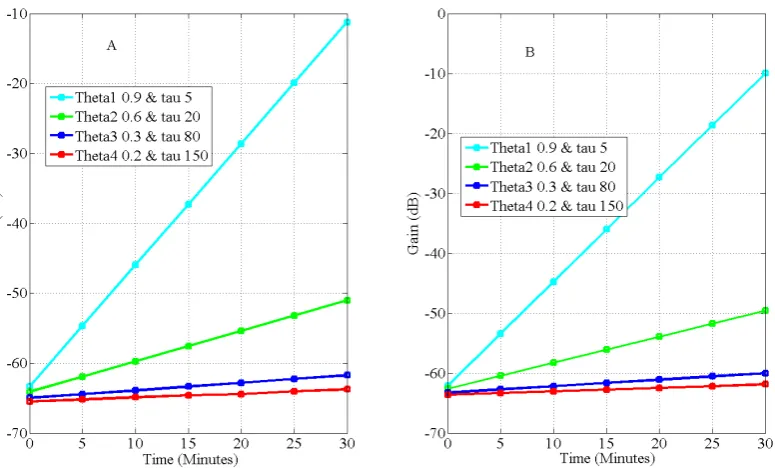
Figure 9.Simulated sensitivity of a galvanic coupled intrabody at 900 kHz at different combinations ofτandθ. (A) is before 100 mL fluid intake and thickness = 23 mm, while (B) is after 100 mL intake, assuming maximum concentration of this amount within 20 cm inter-electrode distance, fluid thickness = 26 mm. Predicted increase in attenuation is 1.5 dB forτ= 20 andθ= 0.6, and 1.70 dB forτ= 80 and θ= 0.3 and 1.91 dB forτ= 150 andθ= 0.2
Subjects D, K, and L, height 166 cm, 182 cm and 176 cm, respectively, participated in the control and sensitivity tests.
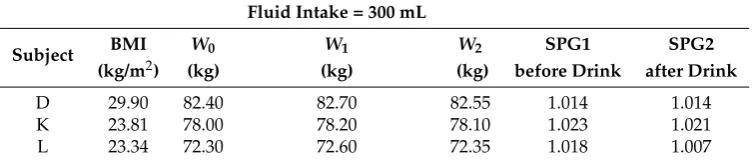
Tables2–4are the control and sensitivity results. The tables show that for the three random days tested, the variation in the subjects’ body mass was below 2 kg, and the change in body weight corresponded to the quantity of water consumed by the subjects on each day of the experiment. The weight also decreased after the subjects had urinated and the urine specific gravity dropped after water was consumed.
Table 2.Control and sensitivity test, Day I.
Fluid Intake = 100 mL
Subject BMI W0 W1 W2 SPG1 SPG2
(kg/m2) (kg) (kg) (kg) before Drink after Drink
D 29.83 82.20 82.30 82.20 1.014 1.014
K 23.58 78.10 78.20 78.20 1.022 1.021
L 23.44 72.60 72.70 72.60 1.023 1.021
Table 3.Control and sensitivity test, Day II.
Fluid Intake = 250 mL
Subject BMI W0 W1 W2 SPG1 SPG2
(kg/m2) (kg) (kg) (kg) before Drink after Drink
D 29.65 81.70 81.90 81.80 1.016 1.012
K 23.81 77.95 78.20 78.10 1.025 1.018
Table 4.Control and sensitivity test, Day III.
Fluid Intake = 300 mL
Subject BMI W0 W1 W2 SPG1 SPG2
(kg/m2) (kg) (kg) (kg) before Drink after Drink
D 29.90 82.40 82.70 82.55 1.014 1.014
K 23.81 78.00 78.20 78.10 1.023 1.021
L 23.34 72.30 72.60 72.35 1.018 1.007
The control and sensitivity tests, Figure8, show the variation between repeated measurements on three subjects on three random days for the first 30 min and the hydration as the subjects consume different amounts of water. The standard deviation between average data points on the reported data for the three subjects who consented to participate and were used for control or baseline values ranged from 0.08 dB–0.18 dB for subject D, 0.47 dB–0.58 dB for subject K and 0.21 dB–0.22 dB for subject L. The deviation from the baseline on the subjects after 100 mL intake are: subject D increased to 1.31 dB, while subjects K and L increased by 2.75 dB and 0.77 dB, respectively, after 250 mL. As the amount of water consumed increased, hydration increased evidenced by the increase in signal gain. For example, subject D increased by 4.4 dB when the amount consumed increased from 100 mL to 250 mL. After consuming 300 mL, the change in signal gain from 250 mL to 300 mL on subjects K and L are 1.57 dB and 0.64 dB, respectively. The measured attenuations after drink and after urination fall within baseline values, which were measured after fluid abstinence and before intake. The variation in the degree of measured attenuation between the three subjects is a result of individual specific body composition, initial hydration state and specific body metabolism.
Our simulation results show that, for maximum absorption of 100 mL within 20 cm channel length, the gain for different combinations ofτandθare:τ= 20 andθ= 0.6, gain is 1.5 dB, and whenτ= 80
andθ= 0.3, gain is 1.71 dB, and forτ= 150 andθ= 0.2, gain is 1.91 dB. The theoretical dependences
of the sensitivity are the individual metabolic functionτ, muscle-fat ratio, an equivalent of body
mass index represented asθand initial fluid level. Empirically, it is susceptible that a contributor
to the sensitivity is height, which was not considered in the simulation. Others are subject specific endogenous processes or metabolism and initial body fluid states.
5. Discussion
5.1. Hydration Measurement Techniques
5.1.1. Urine Colour Indices
5.1.2. Change in Body Weight
The human body mass contains 60%–70% water [27] with dynamic systems of gaining or losing water. Short term changes in body weight are attributed to loss or gain of body water because 1 mL of water has a mass of one gram [16]. Changes in body mass are often used to quantify water gain or loss in a clinical measurement. Consequently, we used the differences in body weight to deduce the amount of water retained in the body and to relate it with the changes in the intrabody signal passing through the body. We note that, as the body hydrates, only a proportion of the amount consumed comes to the arm where we measured. Our sensitivity test investigated the different amount of water required by each subject before it could be detected in the arm. Results show that the signal attenuation decreased as the body weight increased by the fluid consumed and increased as the body weight decreased due to loss of water (Figure8).
5.1.3. Refractometry
With the loss of body water, urine specific gravity increases due to increase in the concentration of urinary waste products [30]. The concentration is determined by the amount of urinary waste per unit volume of urine. Urine specific gravity measures the ratio of the density of urine relative to the density of pure water. A specific gravity greater than 1 means the fluid is denser than water [22]. Urine specific gravity measurements usually range from 1.002 to 1.030. Our results show that subjects with high SPG values usually had high hydration rates with the galvanic coupling method.
5.2. Intrabody Signal Propagation Method
Our proposed intrabody signal propagation method uses time varying changes in galvanic coupled signal amplitude to predict hydration rates. The decrease in attenuation (hydration) or increase (dehydration) during each observation matched the changes in the body weight recorded for all of the 20 subjects as well as the changes in the urine specific gravity and the visual observations on the urine colour.
We observed four distinct cases of human tissue hydration. We definedW2 as Weight after
urination andW0as weight before drink and grouped the cases as following:
Case 1:W2<W0= Hyper hydration;
Case 2:W2=W0= Optimal hydration;
Case 3:W2>W0= Severe dehydrated;
Case 4:W2>W0= Mild dehydration.
by subject D increased from 100 mL to 250 mL, the signal attenuation decreased from−65.5 dB to
−61.9 dB. The attenuation decreased as the amount of water consumed increased. This was reversed in the dehydration cycle measured after urination.
A review of bioimpedance and plasma osmolality methods indicates that intrabody methods, as shown in our experiment, are sensitive to detecting mild body fluid changes. Plasma osmolality measures the amount of osmoles (Osm) of solute per kilogram of solvent (osmol/kg) and is regarded as one of the best methods of estimating the level of dehydration in an individual [31]. The osmolality of blood increases with dehydration and decreases with increasing hydration. A problem with this method, however, is that it does not track body fluid changes quickly when fluid loss is below 3% of body mass [11,21]. This implies that, for a 70 kg adult, plasma osmolality could only detect changes in body fluid level until the water loss causes up to 2.1 kg decrease in body weight. Our technique is sensitive to 100 mL of fluid intake or 0.1 kg change in body weight due to hydration. Similarly, bioimpedance method tracks total body water from estimates of extracellular and intracellular fluid volumes [32]. However, although the bioimpedance method has been validated for estimating total body water [33], in 2007, Armstrong argued that bioelectrical impedance methods may not be accurate when the amount of water loss is less than 800–1000 mL [31]. Our sensitivity test showed that intrabody method could detect changes in body fluid level for as little as 100 mL of fluid intake or water loss as observed in subject D. Our sensitivity test suggests that the sensitivity increases with decrease in height. In addition, the magnitude of the signal attenuation from theoretical simulation changed from−65.98 dB to−63.27 dB forτ= 80 and θ= 0.3, similar to empirical measurements
Figures 8 and 9. Our simulation results, in Figure9, predicted a lowering of signal attenuation by 1.50 dB to as much as 1.91 dB, depending on individual anthropometric ratio and body metabolism, when 100 mL is optimally absorbed in the arm. Our empirical measurements detected 1.31 dB on subject D, BMI 29.83 kg/m2 and height 166 cm. Thus, the empirical measurement is evidenced by simulation results. However, a challenge to the empirical measurements is that the majority of the participants were uncomfortable trying to remain still during the 20 min period in the first experiment, which was required to minimise movement artefacts and external effects. Thus, only three subjects consented to participate in the control and sensitivity test when it was extended to 30 min of measurements. In addition, we argue that the initial hydration state of the subjects with SPG readings should not be the gold standard [31] for assessing human body hydration state.
6. Conclusions
In this paper, we show that galvanic coupled intrabody signal propagation can be used to measure the rate of human body hydration with sensitivity as low as 100 mL of fluid intake or loss, and the system is non-invasive and hygienic. Our studies with 12 male and eight female volunteers show that the rate of hydration depended more on individual metabolic requirements, initial hydration level, and body mass index. Hydration rates are not constant but are affected by the immediate body physiological state and metabolic equilibrium, which, in turn, determines how long it takes to change from one fluid state to another. To use this technique, a baseline amplitude of the signal variations of an individual is required. This capacity makes it potentially applicable for monitoring changes in body fluid level, targeted body fluid disorder and the response of tissues when monitored for targeted fluid level variations. Using galvanic coupled intrabody communication means that the technology can be integrated into existing wearable devices in a cost effective way. In the future, we will further investigate the effects due to anthropometric parameters on the sensitivity.
Acknowledgments:This project is part of a PhD research project by Clement Ogugua Asogwa with no external funding beside the scholarship allowance received by the first author as a PhD candidate.
Conflicts of Interest:The authors declare no conflict of interest.
References
1. Armstrong, L.E.; Pumerantz, A.C.; Fiala, K.A.; Roti, M.W.; Kavouras, S.A.; Casa, D.J.; Maresh, C.M. Human hydration indices: Acute and longitudinal reference values.Int. J. Sport Nutr.2010,20, 145–153.
2. Gandy, J. Water intake: Validity of population assessment and recommendations. Eur. J. Nutri.2015,54, 11–16.
3. Ibrahim, F.; Thio, T.H.G.; Faisal, T.; Neuman, M. The application of biomedical engineering techniques to the diagnosis and management of tropical diseases: A review.Sensors2015,15, 6947–6995.
4. Agostoni, C.V.; Bresson, J.L.; Fairweather-Tait, S. Scientific opinion on dietary reference values for water. EFSA J.2010,8, 1–47.
5. El-Sharkawy, A.M.; Watson, P.; Neal, K.R.; Ljungqvist, O.; Maughan, R.J.; Sahota, O.; Lobo, D.N. Hydration and outcome in older patients admitted to hospital (The HOOP prospective cohort study).Age Ageing2015, 44, 943–947.
6. Schwan, H.P. Electrical properties of tissue and cell suspensions.Adv. Biol. Med. Phys.1957,5, 147–209. 7. Wabel, P.; Chamney, P.; Moissl, U.; Jirka, T. Importance of whole-body bioimpedance spectroscopy for the
management of fluid balance.Blood Purif.2009,27, 75–80.
8. Rothlingshofer, L.; Ulbrich, M.; Hahne, S.; Leonhardt, S. Monitoring change of body fluid during physical exercise using bioimpedance spectroscopy and finite element simulations.J. Electr. Bioimped.2011,2, 79–85. 9. MirHojjat, S.; Kibret, B.; Lai, D.T.H.; Faulkner, M. A survey on intrabody communications for body area
network applications.IEEE Trans. Biomed. Eng.2013,60, 2067–2079.
10. Mentes, J.C.; Wakefield, B.; Culp, K. Use of a Urine Color Chart to Monitor Hydration Status in Nursing Home Residents.Biol. Res. Nurs. 2006,7, 173–203.
11. Francesconi, R.P.; Hubbard, R.W.; Szlyk, P.C.; Schnakenberg, D.; Carlson, D.; Leva, N.; Sils, I.; Hubbard, L.; Pease, V.; Young, J. Urinary and hematologic indexes of hypohydrationJ. Appl. Physiol.1987,62, 1271–1276. 12. Fortes, M.B.; Owen, J.A.; Raymond-Barker, P.; Bishop, C.; Elghenzai, S.; Oliver, S.J.; Walsh, N.P. Is this elderly patient dehydrated? Diagnostic accuracy of hydration assessment using physical signs, urine, and saliva markers.J. Am. Med. Dir. Assoc.2015,16, 221–228.
13. Gao, W.; Emaminejad, S.; Nyein, H.Y.Y.; Challa, S.; Chen, K.; Peck, A.; Fahad, H.M.; Ota, H.; Shiraki, H.; Kiriya, D.; et al. Fully integrated wearable sensor arrays for multiplexed in situ perspiration analysis.Nature
2016,529, 509–514.
14. Kibret, B.; Seyedi, M.; Lai, D.T.H.; Faulkner, M. Investigation of Galvanic Coupled Intrabody Communication using Human Body Circuit Model.IEEE J. Biomed. Health Inform.2014,62, 1196–1206.
15. Asogwa, C.O.; Teshome, A.K.; Lai, D.T.H.; Collins, S.F. A Circuit Model of Real Time Human Body Hydration. IEEE Trans. Biomed. Eng.2016,63, 1239–1247
16. Lentner, C. Geigy scientific tables: Units of measurement, body fluids, composition of the body, nutrition. Basle Ciba-Geigy1981,1.
17. Kavouras, S. Assessing hydration status.Curr. Opin. Clin. Nutr. Metab. Care2002,5, 519–524. 18. Shirreffs, S.M. Markers of hydration status.Eur. J. Clin. Nutr.2003,57, S6–S9.
19. Mifflin, M.D.; St Jeor, S.T.; Hill, L.A.; Scott, B.J.; Daugherty, S.A.; Koh, Y.O. A new predictive equation for resting energy expenditure in healthy individuals.Am. J. Clin. Nutr.1990,51, 241–247.
20. Armstrong, L.E. Hydration assessment techniques.Nutr. Res.2005,63(Suppl. 1), S40–S54.
21. Armstrong, L.E.; Soto, J.A.H.; Hacker, F.T., Jr.; Douglas, J.C.; Kavouras, S.A.; Maresh, C.M. Urinary indices during dehydration, exercise, and rehydration.Int. J. Sport Nutr.1998,8, 345–355.
22. Armstrong, L.E.; Maresh, C.M.; Castellani, J.W.; Bergeron, M.F.; Kenefick, R.W.; LaGasse, K.E.; Riebe, D. Urinary indices of hydration status.Int. J. Sport Nutr.1994,4, 265–279.
24. Peronnet, F.; Mignault, D.; Du Souich, P.; Vergne, S.; Le Bellego, L.; Jimenez, L.; Rabasa-Lhoret, R. Pharmacokinetic analysis of absorption, distribution and disappearance of ingested water labelled with D2O in humans.Eur. J. Appl. Physiol.2012,112, 2213–2222.
25. Wegmueller, M.S. Intra-body communication for biomedical seensor networks. Ph.D. Dissertation, ETH Zurich, Zurich, Switzerland, 2007.
26. Skelton, H. The storage of water by various tissues of the body.Arch. Intern. Med.1927,40, 140–152. 27. Jequier, E.; Constant, F. Water as an essential nutirent: the physiological basis of hydration.Eur. J. Clin. Nutr.
2009,64, 115–123.
28. Bankir, L.; Bouby, N.; Trinh-Trang-Tan, M.M. The role of the kidney in the maintenance of water balance. Baillière Clin. Endoc.1989,3, 249–311.
29. Sands, J.M.; Layton, H.E. The physiology of urinary concentration: An update.Semin. Nephrol.2009,29, 178–195.
30. Oppliger, R.A.; Magnes, S.A.; Popowskim, L.A.; Gisolfi, C.V. Accuracy of urine specific gravity and osmolality as indicators of hydration status.Int. J. Sport Nutr. Exerc. Metab.2005,15, 236–251.
31. Armstrong, L.E. Assessing hydration status: the elusive gold standard.J. Am. Coll. Nutr.2007,26, 575S–584S. 32. Lukaski, H.C. Applications of Bioelectrical Impedance Analysis: A Critical Review. In In Vivo Body
Composition Studies; Springer US: NY, USA, 1990; pp. 365–374.
33. Van Loan, M.D.; Withers, P.; Matthie, J.; Mayclin, P.L. Use of bioimpedance spectroscopy to determine extracellular fluid, intracellular fluid, total body water, and fat-free mass. InHuman Body Composition; Springer US: NY, USA, 1993; pp. 67–70.
c
![Figure 1. Circuit diagram of galvanic coupled intrabody signal with variable impedance componentfrom variable changes in human body fluid [15], Copyright 2016, IEEE.](https://thumb-us.123doks.com/thumbv2/123dok_us/7932774.1317161/3.595.122.471.194.399/circuit-galvanic-intrabody-variable-impedance-componentfrom-variable-copyright.webp)