ISSN(Online): 2319-8753 ISSN (Print): 2347-6710
I
nternational
J
ournal of
I
nnovative
R
esearch in
S
cience,
E
ngineering and
T
echnology
(A High Impact Factor, Monthly, Peer Reviewed Journal) Visit: www.ijirset.com
Vol. 8, Issue 8, August 2019
Customer Churns Prediction in Industry
Sector Using Data Mining
Nasir Kazi, Manish Tiwari
Research Scholar (CS), GITS Udaipur, Rajasthan, India
Assistant Professor, GITS Udaipur, Rajasthan, India
ABSTRACT: Conventional concrete is a mixture of cement, water, and coarse and fine aggregates. Supplementary components such as chemical and mineral admixtures may be added to the basic concrete ingredients to enhance its properties in fresh or hardened state. The development of tools to find the optimized mix proportions has been the subject of research during the last more than four decades. Customer churn is a major problem and one of the most important concerns for large companies. Due to the direct effect on the revenues of the companies, especially in the telecom field, companies are seeking to develop means to predict potential customer to churn. Therefore, finding factors that increase customer churn is important to take necessary actions to reduce this churn. The main contribution of our work is to develop the three kinds of the better classifier for the data prediction. Hence the three kinds of the classifiers like Decision Trees (DT), Naive Bayes Classifier and Rule induction (RI) is developed.
KEYWORDS: Decision Trees (DT), Naive Bayes Classifier and Rule induction (RI),Data mining
I. INTRODUCTION
In the telecommunications industry, the broad definition of churn is the action that a customer’s telecommunications service is canceled. This includes both service-provider initiated churn and customer-initiated churn [2]. An example of service-provider initiated churn is a customer’s account being closed because of payment default. Customer initiated churn is more complicated and the reasons behind vary. Customer initiated churn can be either voluntary or involuntary. Voluntary churn occurs due to a decision by the customer to switch to another company or service provider, involuntary churn occurs due to circumstances such as a customer's relocation to a long-term care facility, death or the relocation to a distant location. In this research, only customer initiated involuntary churns are considered. The reason behind such a decision is due to the fact that these churns typically occur due to factors of the company-customer relationship which companies control as a series of reason codes. Examples of such codes include unacceptable call quality, more favorable competitor’s pricing plan, misinformation given by sales, customer expectation not met, billing problems, moving or change in business due to additional services provided by competitors. The main goals behind customer churn prediction are Detect soon which customers are about to abandon and to know them in depth, answering to questions such as: Who are they? or How do they behave. Know the real value of the potential loss of those customers, with the aim of establishing priorities and distributing business efforts and resources efficiently, optimizing resources and maximizing the value of the current customers’ portfolio
II. RELATED WORK
ISSN(Online): 2319-8753 ISSN (Print): 2347-6710
I
nternational
J
ournal of
I
nnovative
R
esearch in
S
cience,
E
ngineering and
T
echnology
(A High Impact Factor, Monthly, Peer Reviewed Journal) Visit: www.ijirset.com
Vol. 8, Issue 8, August 2019
the key is to keep hold of its trained workforce. Employee churn can be categorized in two types; Voluntary, those who depart for their own reasons, Involuntary, those who are at great from their services by the association Usually company focus on voluntary churn, where an worker would moreover leave for a better opportunity in terms of pay, benefits, work surroundings etc., or due to negative reasons at the present association such as conflict with the supervisors, lack of opportunity for promotion, lack of interesting work and many more. In this study, We apply a wide range of data mining techniques from as simple as Naive Bayes, Decision tree and rule induction We solve this problem following hereunder procedure for the employee data analysis and churn prediction. Analyse the employee dataset that consists of current and past employees’ records Clean the dataset, handle the missing information and derive new features if required Select the features among the employee data that are suitable for the prediction of churn •Try several classifications and report the ones most suitable by comparing the accuracy, precision, recall results on the test data •Build classification model •Further the prediction of churn employees on using the model
•Decision on the strategies of retention exploration is the initial step in data analysis and generally includes summarizing the main characteristics of a data set, including its size, precision, original patterns in the data, cleaning the data and other attributes. Cleaning of data includes removing white spaces, checking if there are any vacant values in the dataset. If white spaces are detected then they are removed, if there are any missing values, then those values are appended by a garbage value, For finding answers to the questions who and why is likely to churn a classification of the customers is needed. Churn prediction deals, therefore, with the identification of customers likely to churn in the near future. The basis for this is historical data, containing information about past churners. A comparison is made between these churners and existing customers. As likely churners are identified customers for which the classification suggests similarity prior churners. Mitchell [7] summarizes different terms used for construction of a classification procedure as pattern recognition, discrimination or supervised learning.
Many of the existing machine learning algorithms, both supervised and unsupervised, depend on the quality of the input characteristics to generate a good model. The amount of these variables is also important, since performance tends to decline as the input dimensionality increases, hence the interest in using feature fusion techniques, able to produce feature sets that are more compact and higher level. A plethora of procedures to fuse original variables for producing new ones has been developed in the past decades.
ISSN(Online): 2319-8753 ISSN (Print): 2347-6710
I
nternational
J
ournal of
I
nnovative
R
esearch in
S
cience,
E
ngineering and
T
echnology
(A High Impact Factor, Monthly, Peer Reviewed Journal) Visit: www.ijirset.com
Vol. 8, Issue 8, August 2019
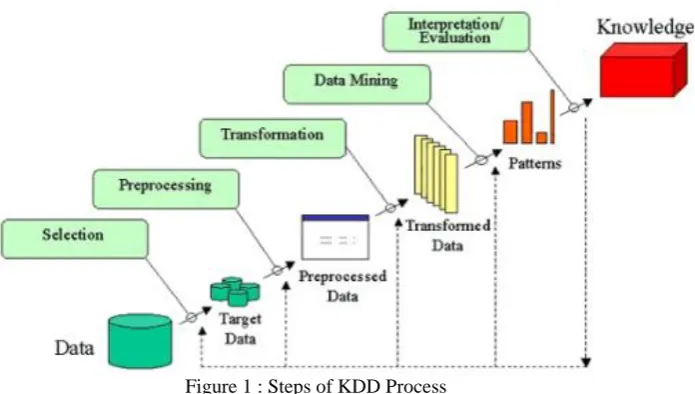
Steps that must be taken to ensure a thorough data analysis. KDD process contains five steps as illustrated in Figure 1. The first step I involves the selection of the right data from numerous heterogeneous data sources to create the target dataset. The right selection of attributes and variables is very important at this step-in order to
produce an accurate analysis. In data pre-processing step, missing values, outliers and inconsistency are removed and/or cleaned. This step is required to enhance the quality of the target dataset as well as the mining results. The transformation step focuses on transforming the variables from one format to another to ease the implementation of the data mining algorithms. The transformation step involves changing variables from one format to another to perform data mining. The application of data mining step has to be aligned with the objective of the entire KDD process, in this case, customer churn prediction. The last step is the interpretation and evaluation of the mined data, this step determines the success level of the purposed model and documents the knowledge discovery for future references [3]. Steps that must be taken to ensure a thorough data analysis. KDD process contains five steps as illustrated in Figure 1. The first step involves the selection of the right data from numerous heterogeneous data sources to create the target dataset. The right selection of attributes and variables is very important at this step-in order to produce an accurate analysis. In data pre-processing step, missing values, outliers and inconsistency are removed and/or cleaned. This step is required to enhance the quality of the target dataset as well as the mining results. The transformation step focuses on transforming the variables from one format to another to ease the implementation of the data mining algorithms. The transformation step involves changing variables from one format to another to perform data mining. The application of data mining step has to be aligned with the objective of the entire KDD process, in this case, customer churn prediction. The last step is the interpretation and evaluation of the mined data, this step determines the success level of the purposed model and documents the knowledge discovery for future references [3].
III. PROPOSED SOLUTION
ISSN(Online): 2319-8753 ISSN (Print): 2347-6710
I
nternational
J
ournal of
I
nnovative
R
esearch in
S
cience,
E
ngineering and
T
echnology
(A High Impact Factor, Monthly, Peer Reviewed Journal) Visit: www.ijirset.com
Vol. 8, Issue 8, August 2019
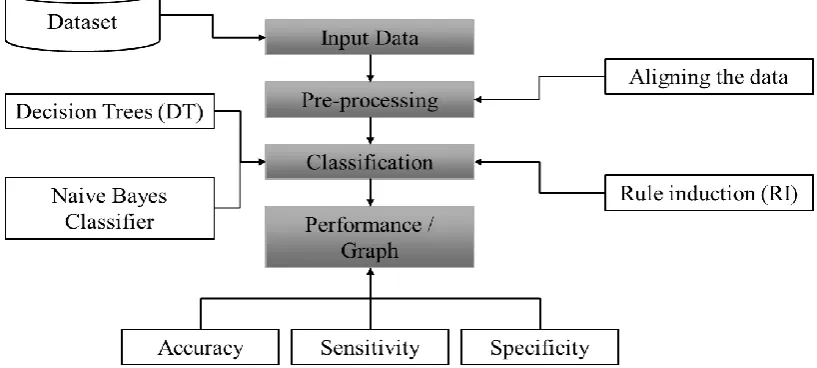
fig.2 block diagram
ISSN(Online): 2319-8753 ISSN (Print): 2347-6710
I
nternational
J
ournal of
I
nnovative
R
esearch in
S
cience,
E
ngineering and
T
echnology
(A High Impact Factor, Monthly, Peer Reviewed Journal) Visit: www.ijirset.com
Vol. 8, Issue 8, August 2019
Although neural networks also perform very well in case of churn prediction it has limitations such as it performs well for large datasets only and takes a lot of time for training even with small datasets. Also, with neural networks it is difficult to analyze the features that lead to churn. Neural networks are interesting tool, but has operative problem for marketers: they are like black boxes; it is very difficult to understand the underlying factors that explain the churn. If we cannot know the factors, we haveno insight to build churning prevention strategy. Hence Decision tress and Naive Bayer, Rule induction is used which help analyze the factors causing churn in an effective and understandable way.
IV. CLASSIFIER
Decision tree learning uses a decision tree (as a predictive model) to go from observations about an item to conclusions about the item’s target value. It is one of the predictive modeling approaches used in statistics, data mining and machine learning. Tree models where the target variable can take a discrete set of values are called classification trees and where the target variable can take continuous values (typically real numbers) are called regression trees.
Regression analysis-Logistic Regression
Decision Trees (Dt)
Naive Bayes
Rule Inductio
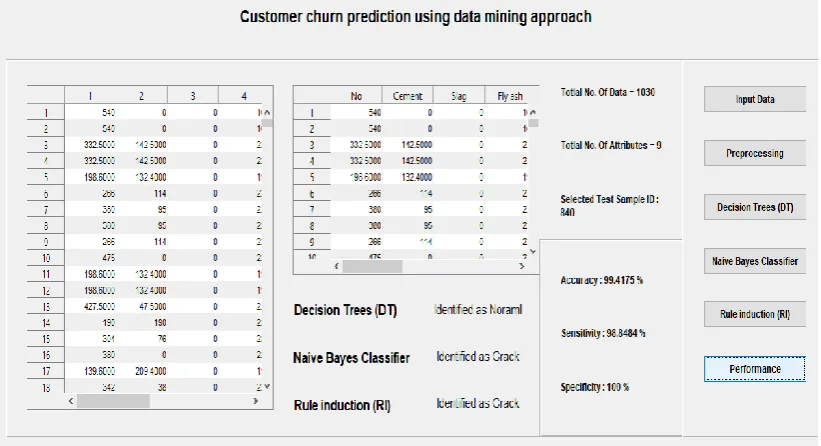
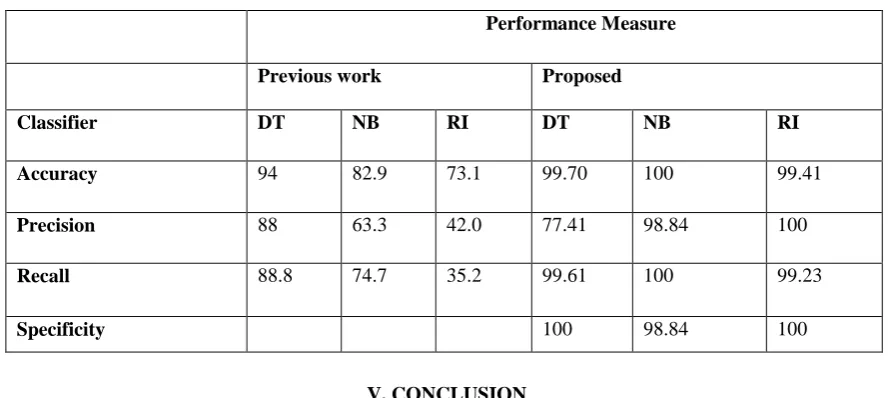
Measure the performance of each model to know which one had the best performance of all. The measures' values were found to be as shown in Table 4.1 to be easily understood and compared. Calculated measures had shown that although the top performing model was (DT) while the other two models have a close performance to each other. (DT) had the accuracy value with 99% while (NB) had 100% and (RI) had 99 % which are considered to be almost the same. Precision calculations showed that (NB) with a value of 98.4, followed by (RI) with 100% and (DT) has the lowest value of 77.41%. The recall had put (DT) at the top as well with 99.64 %, followed by (NB) with 100% - which indicates significant difference – then, (RI) had the lowest value of 99.23% which considered to be in the same zone of (NB). Specificity kept (DT) the top classification model with a value of 100 %, followed by (NB) with 98.84% and the last classifier was (RI) with a value of 100%. Results of confusion matrices had indicated that for prediction of customers to churn (NB) had the closest result to the actual ones. Followed by (RI) and the Final place was taken by (DT). While predicting non-churn customers (DT) took the lead with the closest results to the actual.
ISSN(Online): 2319-8753 ISSN (Print): 2347-6710
I
nternational
J
ournal of
I
nnovative
R
esearch in
S
cience,
E
ngineering and
T
echnology
(A High Impact Factor, Monthly, Peer Reviewed Journal) Visit: www.ijirset.com
Vol. 8, Issue 8, August 2019
Table 1 Result Comparison
V. CONCLUSION
The prediction of compressive strength is important for this application in concrete strength research. The strength is predicted by a number of data samples by both conventional and Artificial Neural Network (ANN) based models. There are a number of meteorological and geographical variables which affect strength prediction, so identification of suitable variables for accurate compressive prediction is an important research area. With this main objective, it can be concluded that ANN model is the most reliable technique for the purpose. ANN may serve as a strong predictive tool, for prediction of both experimental and in situ data and it may provide perfect and valuable explicit formulation for many civil engineering applications, wherein predictive pronouncements are required. There Are Three Classifier used to analysis churn prediction measure and performing model was (DT) while the accuracy value with 99% while (NB) had 100% and (RI) had 99 % which are considered to be almost the same
REFERENCES
1. Weihua Zhang ; Li Zhu Computer Simulation of Electronic Commerce Customer Churn PredictionModel Based on Web Data Mining 2017 International Conference on Smart Grid and Electrical Automation (ICSGEA)Year: 2017 Pages: 660 – 663 Cited by: Papers (1)
2. 2.Reena Pagare ; Akhil Khare Churn prediction by finding most influential nodes in social network 2016 International Conference on Computing, Analytics and Security Trends (CAST) Year: 2016 Pages: 68 – 71 IEEE Conferences\
3. 3.Yao Xiao ; Changzheng He ; Jin Xiao Study on Customer Churn Prediction Methods Based on Multiple Classifiers Combination 2009 Third International Symposium on Intelligent Information Technology Application Year: 2009 Volume: 1 Pages: 597 – 601
4. 4.Utku Yabas ; Hakki Candan Cankaya ; Turker Ince Customer Churn Prediction for Telecom Services 2012 IEEE 36th Annual Computer Software and
Performance Measure
Previous work Proposed
Classifier DT NB RI DT NB RI
Accuracy 94 82.9 73.1 99.70 100 99.41
Precision 88 63.3 42.0 77.41 98.84 100
Recall 88.8 74.7 35.2 99.61 100 99.23