Strategy for Ni-Cd Battery Performance
Improvement under Deep Cycling
J.Vishnupriyan1, R.Suganya2
QC Engineer, Dept. of Telecommunication, Bangalore, Karnataka, India1
Assistant Professor, Dept. of EIE, Sethu Institute of Technology, Kariapatti, Tamilnadu, India2
ABSTRACT: This paper presents the testing and performance improvement analysis of various capacities rating Nickel Cadmium (Ni-Cd) battery banks under deep cycle operation. Analysis of charging and discharging characteristics of Ni-Cd batteries discussed in this paper. The basic parameters measurement such as each cell voltages in battery bank, load current, terminal voltage and working temperature of battery banks are described in this paper. By analyzing thermal and electrical characteristics of various capacity rating battery banks, the best battery bank can be offered for particular emergency run time applications. The experimental result analysis of 48V, Ni-Cd batteries in potential application performances at temperature sensitivity in the range of +21°C to +51°C have been determined. This study presents data on 80% depth of discharge (DOD) is performed on nominal capacities of 300Ah, 550Ah, 577Ah, 660Ah and 682Ah battery banks for the test duration of 33 to 42 hours. The purpose of this study is to validate the discharge characteristics of Ni-Cd batteries and develop basic information on rapid discharge rates and mechanisms. The data from this experiment on 80% DOD is performed on commercial Ni-Cd batteries and this model is used for real time applications.
KEYWORDS:Nickel Cadmium (Ni-Cd) Battery, Battery Bank (BB), Battery Refurbishment, Battery Management System (BMS), Depth of Discharge (DOD)..
I.INTRODUCTION
Ni-Cd batteries have reliability, long life and reduced operating costs are the main considerations. Its energy density was significantly increased and water consumption was reduced allowing maintenance-free operation over its life [13]. These Ni-Cd secondary batteries are the most used batteries in a large number of applications because of their high performance and reducing the need for spares or larger batteries [14].
The objective of this work is to analyse the charging and discharging performance of various capacities Ni-Cd batteries. Industry consumers are often concerned about discharge (backup) performances of various batteries. The BB manufacturer gives more attention to electrical and thermal characteristics. This is because BB capacities and discharge performance of battery is mainly depends on its operating temperature and Nickel-HydroxideNi(OH)2crystals
deposition on the electrodes; thermal characteristics are also to be considered. The presence of quick discharge or death cell in the battery bank, it reduces the ampere-hour(Ah)rating simultaneously total voltage of the BB.According to experiment data, consumption up to 50% of total energy is to maintain battery temperature at particular set point level, cooling system has 25°C by air conditioner. As an electrochemical product, Ni-Cd battery is sensitive to ambient temperature. The life cycle of Ni-Cd battery is reduces when the ambient temperature increases 10°C [3]. The power battery module under high-rate discharge condition that produces phenomena of high temperature aggregation. Due to thermal aggregation during charging and discharging that distributes in battery module inconsistently affects performance of battery and so that life time of BB under goes shorten [4].
The experimental curves of charge and discharge performance of Li-Polymer and Ni-MH battery performance has voltage and current versus time at different temperatures are given for temperatures ranging from -40°C to 80°C [8]. The higher DOD affects the cycle life of Lithium-Metal-Polymer (LMP) batteries. The main impact of cycling at different DOD’s on LMP battery performances of life cycle was investigated [9]. Almost 90% of alternative energy sources store the excess generated energy in battery energy storage systems (BESS) for renewable energy applications [10]. Nickel-Hydroxide crystal formation is an electro-chemical reaction that reduces the concentration of electrolyte and as a consequence cell voltage is also reduced [11]. Whenever a cell or battery is charging and discharging, Nickel-HydroxideNi(OH)2crystals gradually build up on the cell electrodes that are given in Equation (1) and it prevents the battery from effectively delivering current to the load [12]. These crystals lead to suffocate or salty the battery. A battery will be rare to recover, if the active material has been lost from the plates [2].
Energy OH
Cd OH Ni O H Cd OH
NiO( ) 2 2 2 ( )2 ( )2
2 (1)
The outcome of produced Nickel-HydroxideNi(OH)2increases internal resistance and decrease the size of electrode. The process of salt crystals builds up in cell or BB is unavoidable. The performance of BB varies significantly with temperature [2]. Therefore, rapid and precise measurements are absolutely necessary. The battery regenerator (MCS) is used for electrically de-crystallization the Nickel-Hydroxide crystals present in the cell electrodes. The battery management system (BMS) is used to measure voltages of each cells connected in the BB in a fraction of single attempt. This measurement indicates the state of charge (SOC) of each cell that delivers its output voltage at discharge time. Both charging and discharging duration are major criteria for determining the efficiency of cells in BB.
The system description of real time experimental setup and modes of BB charging methods is discussed in section II. The experimental results and discussion of performance analysis of various capacity batteries is discussed in section III.
II.SYSTEM DESCRIPTION
A. Battery Regenerator
The term refurbishment represents that battery regeneration and it is commercially available. It is designed to improve the performance of degraded batteries and to extend the battery lifespan [11]. The regenerator enables high precise control of AC power and creates shark pulse to regenerate the sulphated lead-acid battery or Ni-Cd battery. De-sulfation or de-crystallization (Refurbishment technique) is the process of reversing the De-sulfation of a lead-acid battery. De-sulfation is achieved by high-current pulse cycles (150Hz per cycle) produced between the terminals of the battery bank [1]. This technique is also called as pulse conditioning, breaks down the sulphate crystals that are formed on the battery plates.
Purposes of electronic circuits are used to regulate the pulses of various frequencies of high current pulses. These can also be used to automate the process since it takes a longer period of time to disulphates a battery fully. The battery regenerator is used for measuring lifecycle of battery for 30-70 hours and it also includes the working temperature measurements.
The regenerator enable to discharge a large range of battery capacities up-to someV ~150V, 4000Ah/C10. It removes
lead-sulphate(PbSO4)generated during BB cycling with the refurbishment electric characteristics called shark pulse, which reduces lead-sulphate again to increase the weight of electrolyte, and decreases internal resistance to recycle the battery [1].
B.Battery Measurement System
As the name BMS indicates that monitors each cell voltages levels, total output voltage and identify the deep discharge cell connected in the BB at real time environment. This proposed method of BB refurbishment and BMS are used to identify the quickly discharge or bad cells in a measurement and extending the lifecycle of battery by after regeneration of the particular salty battery. This method of measurement is fast and it does not require large space and also very less load fluctuations.
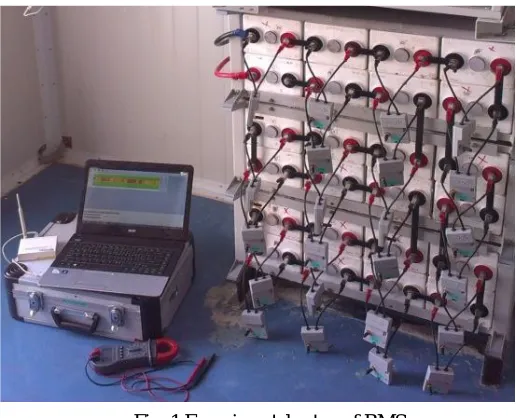
BMS is specifically designed for measuring the each cell voltages connected in the terminals of BB. The measurement is rated for not more than ±5V per cell and it can monitors continuously up to maximum duration of 10 hours [1]. The experimental setup diagram of BMS measurement is shown in Fig. 1.
Fig. 1.Experimental setup of BMS
A BMS provides most accurate data and measurement results of each cell connected in BB. It contributes advanced technology to evaluate the battery capacity(Ah)and to measure cell voltage at any time. It incorporated to minimize
their maintenance costs through battery measurement devices [1].
C.Experimental Setup
The simplified experimental setup block diagram of battery refurbishment is shown in Fig. 2. The integration transceiver receives the data of cell voltages from connected cells in the BB. The regenerator (MCS) also gets information about battery conditions like voltage, current and temperature. The Battery regenerator simultaneously doing both BB reforming according to predefined levels. The MCS and BMS possesses received signal is feedback to the PC/Laptop for the real time monitoring.
Fig. 2.Block diagram of Battery Refurbishment setup
D.Modes of cycling Methods
The limits of charging and discharging voltage levels are very important for safe operation of battery banks [2]. This is especially important for the VRLA/Ni-Cd battery for which the preferred cycling. The nominal values of current and voltage limits for 577Ah, 48V, 24 cells are given in Table I.
TABLE I. RATINGS OF CC AND CV CYCLING
In this tabulation, the number 24 represents number of cells connected in the BB. Similarly, 1.8V represents the lower discharge limit of each cell voltage and 2.7Vrepresents the upper charge limit of each cell voltage connected in the BB
III.RESULTS AND DISCUSSION
Fig. 3. Discharge characteristics before regeneration
This BMS monitor each cell voltages at every 3 minutes or 15 minutes time duration through 2.5GHzzig-bee wireless by Integrated Monitor software through Bluetooth. It can monitor maximum time duration of 10 hours for continuous real time experiment.
The main failure of Ni-Cd battery is Nickel-Hydroxide crystal formation in the completed life cycles BB. To replace the failure battery it requires large amount of cost and huge manpower. Behalf of replacing the old aged/salt or crystal formatted battery by providing the battery refurbishment; it reduces the formation of salt crystal in the battery and improves the battery capacity performance and lifespan [11].
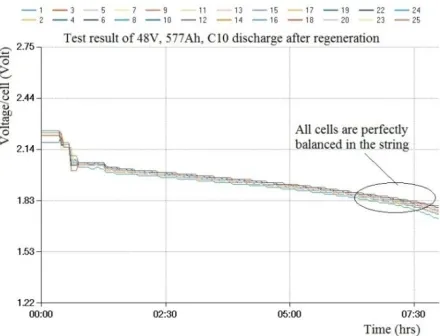
Fig. 4. Discharge characteristics after regeneration
The experimental result obtained from after regeneration of same system is shown in Fig. 4. From the experimental result of after regeneration, the cell numbers #7 and #17 and #18 well recovered and well balanced in the string. It produces extra 2 hours have been improved.
Fig. 5.BB Cycling characteristics curves of 48V, 300Ahbattery bank capacity with 80% DOD
Discharge number 1 – Time duration approximately 5 hours 20 minutes at -308.2Ah.Discharge number 4 – Time duration approximately 8 hours at -461.3Ahfor without replacing the bad cell numbers #7, #17 and #18. Extra 2 hours and 40 minutes backup was obtained by without replacing cell number #7, #17 and #18. This result shows well recovered and well balanced in the string and that the battery bank will reach the maximum capacity when applying a discharge test.The time difference of UPS power supply back up performance comparison is given in below.
UPS backup #1: 30 minutes before regeneration for 57.7Aload current. UPS backup #2: Two hours after regeneration for same 57.7Aload current.
If replacing the cell numbers #14 and #20 and then the UPS backup would be around more than 2 hours is possible. Similar procedure is conducted for various capacity ratings of 300Ah 550Ah, 660Ah, 682Ahwith 48Vbattery banks. The performance improvement analysis comparison tabulation is given in Table II.
TABLE II. PERFORMANCE IMPROVEMENT ANALYSIS COMPARISON
S. No BBcapac ity (Ah) Total experime nt Time (Hrs) Operating temperature ranges (°C)
Before reformation After reformation Performance
Improvement Total power consum ption (kWhr) Capacity (Ah) Backup time (Hrs) Capacity (Ah) Backup time (Hrs) Capacity (Ah) Backup time (Hrs)
1 300 39.00 +28 to +36 -195.60 07.00 -223.40 08.00 -27.80 01.00 3.30
2
550 32.45 +27 to +51 -171.70 03.00 -309.00 05.00 -137.30 02.00 30.00 577 37.15 +22 to +51 -308.20 05.15 -461.30 08.00 -153.10 02.75 28.00
3
660 34.30 +36 to +51 -280.70 04.15 -410.80 06.15 -130.10 02.00 23.50 682 39.00 +33 to +52 -464.00 06.45 -574.90 08.30 -110.90 01.75 22.68
From the experiment data of obtained results shows that, per-unit consumption for performance improvement purely depends on the ampere-hourAhimprovement for before and after regeneration of the battery banks of various capacities. This result is shown in Table III.
TABLE III. UNIT CONSUMPTION ANALYSIS
Case – 1 – 300Ah
S.No Total test hours Improved capacity ) (Ah
Per unit consumption ) (kWhr
1 39:02:47 27.80 0.08
Case – 2 – 550Ah
1 46:31:14 68.80 0.75
2 32:44:48 137.30 0.90
Case – 3 – 682Ah
1 42:24:08 64.60 0.35
2 38:54:17 110.90 0.59
The performance improvement analysis is shown in Chart I. The power consumption (Units) is not depends on the battery bank capacity ratings. It’s purely depends on electrical charging for fully remove the particular crystals formed in the battery bank (i.e) ampere-hourAhbuild up in the battery bank capacity.
CHARTI.PERFORMANCE IMPROVEMENT ANALYSIS
IV.CONCLUSION
The work contributed about the testing and performance improvement analysis of charging, discharging and thermal characteristics of various capacity rating battery banks. By analyzing the performance improvement characteristics suitable battery bank capacity rating can be predicted particular battery refurbishment applications. Enormous amount of power can be saved by after refurbishment of existing aged battery banks and replacing the identified quick discharge cell in the battery string by energy efficient batteries obtained. The obtained experimental results shows that the power consumption, heat emission and fuel consumption of batteries is less when compared to before refurbishment of various capacitates battery banks. The improved ampere-hour rating and backup time level of refurbished battery banks hold best performance when compared to before refurbishment and improved power saving for future.
In future, the proposed work can be further extended to power factor improvement of Miracle Charge System (MCS) machine provides good result in achieving lower power consumption for battery refurbishment.
0.00 0.50 1.00 1.50 2.00 2.50 3.00 3.50
300 550 577 550 660 682 682
Total Experiment Time X 10 (Hrs)
Improved Backup time (Hrs)
REFERENCES
[1] Battery Regenerating Technique and BMS Operating Manual, MarooMCS Inc., Korea, 2010.
[2] David, L., and Thomas, B. R., “Handbook of Batteries”,McGraw-Hill Companies Inc., New York, 2002.
[3] Jian, G., Sen, B., Jian, C., Xianzhang, W., and Haifeng, X., “An Innovative VRLA Battery Solution for Energy Saving & Emission Reduction”, Proc. 34thIEEE International Telecommunications Energy Conference, pp.1-5, 2012.
[4] Jian, W.,Zhengbin, W.,Xianquan, D., Songhua, Q., and Xiaoping, Y., “Temperature Characteristics Improvement of Power Battery Module for Electric Vehicles”, Proc. IEEE International Conference on Vehicle Power and Propulsion Conference, pp.1-4, 2013.
[5] Marongiu, A., Damiano, A., and Heuer, M., “Experimental Analysis of Lithium Iron Phosphate Battery Performances”, Proc. IEEE International Symposium on Industrial Electronics, pp.3420-3424, 2010.
[6] Sen, C., and Kar, N. C., “Analysis of the Battery Performance in Hybrid Electric Vehicle for Different Traction Motors”, Proc. IEEE Conference on Electrical Power and Energy Conference, pp.1-6, 2009.
[7] Mariani, A., Thanapalan, K., Stevenson, P., and Williams, J., “Techniques for Estimating the VRLA Batteries Ageing, Degradation and Failure Modes”, Proc. 19thInternational Conference on Automation and Computing, pp.1-5, 2013.
[8] Meekhun, D.,Boitier, V., and Dilhac, J. M., “Charge and Discharge Performance of Secondary Batteries According to Extreme Environment Temperatures,” Proc. 35thIEEE Annual Conference on Industrial Electronics Conference, pp.266-270, 2009. [9] Guena, T., and Leblanc, P., “How Depth of Discharge Affects the Cycle Life of Lithium-Metal-Polymer Batteries”, Proc.
28thAnnual International Telecommunications Energy Conference, pp.1-8, 2006.
[10]Cedric, C., Adnan, S., Ahmed, A. D., and Muyeen, S. M., “Modeling and Analysis of Battery Performance for Renewable Energy Application”, Proc. 15thEuropean Conference on Power Electronics and Applications, pp.1-10, 2013.
[11]Vishnupriyan, J., Manoharan, P. S., andSeetharaman, V., “Performance Analysis of VRLA Batteries under Continuous Operation”, International Journal of Research in Engineering and Technology,Vol.3, no.19, pp.275-281, 2014.
[12]Dirani, H. C., Semaan, E., and Moubayed, N., “Impact of the current and the temperature variation on the Ni-Cd battery functioning”, Technological Advances in Electrical, Electronics and Computer Engineering,pp. 339- 343, 2013.
[13]Lansburg, S., Dauchier, J., M., Kitch, T., Brunarie, J., and Lippert, M., "Tailoring advanced Ni-CD technology for a high energy, sustainable battery solution for outdoor telecom cabinets", IEEE 30th International Telecommunications Energy Conference, pp.14-18, 2008.
[14]Gonzalez, M., Lopez, J., Lopez., E., and Perez, M.A., "Universal test-bench for charging/discharging of Ni-Cd and Ni-MH batteries", 3rd International Power Electronics Congress, pp.131-137, 1994
BIOGRAPHIY
J. Vishnupriyan received his B.E degree in Electrical and Electronics Engineering from KLN College of Engineering, Madurai, Tamilnadu, India in the year 2010 and M.Tech degree in Control and Instrumentation Engineering at Thiagarajar College of Engineering, Madurai, Tamilnadu, India in the year 2014. Currently he is working as QC Engineer – Electrical at Telecommunication network in India. His research interest includes battery measurement system and energy efficient analysis.