Assessing Ecological Integrity of Ozark Rivers to
Determine Suitability for Protective Status
ANDREA J. RADWELL*
Arkansas Cooperative Fish and Wildlife Research Unit Department of Biological Sciences
University of Arkansas
Fayetteville, Arkansas 72701, USA
THOMAS J. KWAK US Geological Survey
North Carolina Cooperative Fish and Wildlife Research Unit North Carolina State University
Raleigh, North Carolina 27695, USA
ABSTRACT / Preservation of extraordinary natural re-sources, protection of water quality, and restoration of im-paired waters require a strategy to identify and protect least-disturbed streams and rivers. We applied two objective, quantitative methods to determine stream ecological integ-rity of headwater reaches of 10Ozark rivers, 5 with Wild and Scenic River federal protective status. Thirty-four variables representing macroinvertebrate and fish assemblage char-acteristics, in-stream habitat, riparian vegetation, water quality, and watershed attributes were quantified for each
river and analyzed using two multivariate approaches. The first approach, cluster and discriminant analyses, identified two groups of river with only one variable (%forested wa-tershed) reliably distinguishing groups. Our second ap-proach employed ordinal scaling to compare variables for each river to conceptually ideal conditions that were devel-oped as a composite of optimal attributes among the 10 rivers. The composite distance of each river from ideal was then calculated using a unidimensional ranking technique. Two rivers without Wild and Scenic River designation ranked highest relative to ideal (highest ecological integrity), and two others, also without designation, ranked most distant from ideal (lowest ecological integrity). Fish density, number of intolerant fish species, and invertebrate density were influential biotic variables for scaling. Contributing physical variables included riparian forest cover, water nitrate con-centration, water turbidity, percentage of forested wa-tershed, percentage of private land ownership, and road density. These methods provide a framework for refinement and application in other regions to facilitate the process of establishing least-disturbed reference conditions and iden-tifying rivers for protection and restoration.
Cumulative effects of human actions have altered water quality, habitat structure, flow regime, and biotic interactions of a substantial portion of US rivers and streams (Stanford and Ward 1979; National Research Council 1992; Karr 1995). Benke (1990) estimated that less than 2% of the 5,200,000 km of streams in the contiguous 48 states are free-flowing and sufficiently unaltered by human activity to be eligible for federal protective status. Preservation of extraordinary natural resources, protection of water quality, and restoration of impaired waters require a strategy to identify and protect least-disturbed rivers and streams. These water bodies can serve as standards for monitoring aquatic ecosystems managed for water supplies, hydropower, transportation, and other human benefits (National
Research Council 1992; Allan and Flecker 1993; Nai-man and others 1995).
The Wild and Scenic Rivers Act of 1968 (PL 90-542) stated that ‘‘certain selected rivers of the Nation which with their environments, possess outstandingly remarkable scenic, recreational, geologic, fish and wildlife, historic, cultural, or other similar values, shall be preserved in free-flowing condition, and that they and their immediate environments shall be protected for the benefit and enjoyment of present and future generations.’’ A revision of the Act in 1982 added ecological value as an attribute that qualifies a river for consideration. The minimum eligibility requirements are that the river segment be completely free-flowing and possess at least one outstandingly remarkable va-lue. Most suitability studies required for designation have been based on subjective criteria (i.e., scenic, recreation, cultural); few have focused on objective, quantitative measurement of ecological value (Palmer 1993). We assumed that the term ‘‘ecological value’’ is synonymous with ‘‘ecological integrity’’ [i.e., the sum-mation of chemical, physical, and biological integrity as defined by Karr and Dudley (1981)]. Development of
KEY WORDS: Antidegradation; Biotic integrity; Ecological integrity; Reference conditions; River bioassessment; Ozarks; Wild and Scenic Rivers
Published online May 10, 2005
*Author to whom correspondence should be addressed; email:
quantitative, repeatable, and objective standards for measuring ecological integrity would reduce subjectiv-ity and bias in the selection of rivers for protective status.
In addition to facilitating the selection of rivers worthy of protective status, objective evaluation of the physical, chemical, and biological attributes that dis-tinguish least-disturbed rivers is critical to effective aquatic resource management. Such aquatic systems provide important information on historic ecological conditions that is essential for implementing biological assessment and monitoring programs that use the ref-erence condition approach to evaluate aquatic re-sources (Hughes 1995; Reynoldson and others 1997). Comparison between relatively undisturbed reference streams and disturbed reaches within ecoregions has become the recommended method of water quality monitoring (Karr 1991; Rosenberg and Resh 1993; Davis and Simon 1995; Barbour and others 1999). The National Research Council (1992) recommended that relatively undisturbed reference reaches be designated and protected in each ecoregion of the United States to provide standards for water quality monitoring or establishing restoration benchmarks.
Defining reference conditions against which other streams can be compared presents a unique challenge because most aquatic ecosystems have been altered to some extent by changes in physical, chemical, or bio-logical structure (e.g., impoundment, pollution, or introduction of exotic species). Reference conditions should specify the biological potential of a population of streams within a region that is minimally influenced by anthropogenic pollution or disturbance. However, applying this approach is problematic in watersheds that are subjected to multiple disturbances and have no tributaries free of anthropogenic influences. In addition, numeric standards have been developed for physical and chemical parameters, but most states have not established numeric biocriteria (EPA 2002). Quantitative physical, chemical, as well biological standards are needed, against which rivers in a region can be compared to determine the influence of cumulative stressors.
Our research included two interrelated objectives. The first was to develop a protocol for evaluating rivers for protective status that advances the notion that a quantifiable ecological end point is an appropriate criterion for selecting rivers for protection. Second, in the process of protocol development, we sought to address the issue of establishing reference conditions for comparing and prioritizing rivers based on a com-posite of quantitative physical, chemical, and biological attributes. We pursued these two objectives in the study
of 10 Ozark rivers that are eligible for protection under the Wild and Scenic Rivers Act; 5 were conferred pro-tective status based on a suitability study that included qualitative social, political, and cultural considerations (US Forest Service 1991). Our intent was to develop and test an alternative strategy for comparing a group of rivers eligible for protective status based on quanti-tative, repeatable measurements of variables describing ecological integrity. However, we sought to develop a general approach that could be applicable in other regions for selection of relatively undisturbed rivers for protection by any means available [e.g., outstanding national resource waters under federal regulations on antidegradation (40 CFR 131.12) (EPA 1994)].
Methods
Protocol Development Approaches
In this research, we developed a protocol to rank rivers based on ecological integrity. We represented ecological integrity as a composite of macroinverte-brate and fish assemblage characteristics, in-stream habitat, riparian vegetation, water quality, and wa-tershed attributes (Karr and Dudley 1981). Our pro-tocol consisted of four steps: (1) select rivers in a region for comparison; (2) select and measure chem-ical, physchem-ical, and biological attributes that are appli-cable to assessing ecological integrity in the region in representative reaches; selection of variables should be based on regional factors known to influence ecologi-cal integrity because no single suite of variables is applicable among regions at broad spatial scales; (3) rank rivers based on a composite of attributes; and (4) prioritize rivers for protection based on rank. In our study, metrics from bioassessment protocols [e.g., In-dex of Biotic Integrity (IBI); Karr and others 1986; Resh and Jackson 1993] were used to quantify biotic attributes, and metrics served as response variables in two multivariate statistical approaches. Cluster analysis followed by stepwise discriminant analysis was com-pared to a unidimensional ordinal scaling technique (Guttman 1946).
optimal conditions among study sites. This provides a method of determining reference conditions that does not depend on subjective selection of a specific stream or group of streams to represent least-dis-turbed reference conditions. Such an approach might be useful in situations in which all rivers within a basin have been subjected to anthropogenic distur-bance.
Study Rivers and Sampling Sites
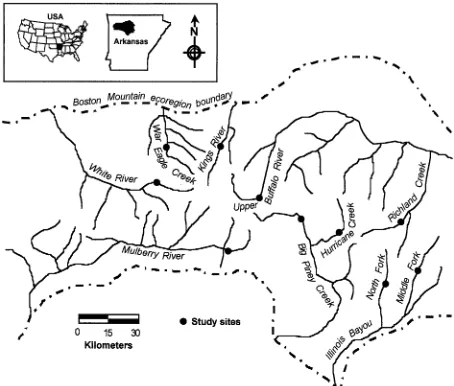
We studied 10 rivers (Figure 1) in the Boston Mountain ecoregion of northwest Arkansas (Omernik 1987) that met eligibility criteria for consideration of protective status under the Wild and Scenic Rivers Act (US National Park Service 1982). The ecoregion in-cludes the southern portion of the Ozark Mountain range, consisting of low mountains of sandstone and shale geology with dense oak/hickory tree cover. For each river, a representative reach consisting of at least one pool-riffle sequence was selected for study. The watershed was defined from that point to the headwa-ters, and drainage areas were limited to 4358–9913 ha to minimize longitudinal differences among sites (Vannote and others 1980). Selected watersheds were contiguous and fully contained within the ecoregion and mountain range (Figure 1) to minimize con-founding effects of differences in geomorphic and geochemical characteristics known to exist among ecoregions and watersheds (Omernik 1987; Hughes 1995). All streams within these watersheds were com-pletely free-flowing (i.e., uninterrupted by dams or impoundments).
Five of the rivers, Big Piney Creek, Hurricane Creek, Mulberry River, Richland Creek, and the Buffalo River, include reaches that were conferred Wild and Scenic status based on a suitability study completed by the US Forest Service (1991). The Buffalo River is a National River managed by the National Park Service with the exception of the headwater area, which has Wild and Scenic River status, and is referred to in this study as the Upper Buffalo River. Two rivers, the Middle and North Forks of Illinois Bayou, were included in the 1991 suitability study but were not recommended for designation. The remaining three study rivers, the Kings, War Eagle, and White rivers, were not included in the suitability study because they are not within National Forest boundaries or surrounded by adequate US Forest Service land to facilitate management. Al-though our selected study rivers meet requirements for consideration of protective status, they vary in water quality and degree of human influences and distur-bance in corresponding stream channels, riparian zones, and watersheds.
Fish and Macroinvertebrate Sampling
Fish were sampled during the summers of 1996 (Rambo 1998) and 1998 (Radwell 2000). A 1500-W, pulsed dc, barge electrofisher was used to collect fish in representative pool-riffle sequences ranging from 22 to 80 m in length. We elected to explicitly estimate pop-ulation sizes of all fish species in the assemblage in shorter reaches rather than sample longer reaches with gears that result in fish samples of various biases (Seber 1982; Williams and others 2002). Fish populations (density and biomass) were estimated using a three-pass removal, maximum-likelihood method (Seber 1982; Bohlin and others 1989; Kwak 1992). Fish were collected with equal effort (sampling time) among passes within a site (35–56 min depending on reach length). Fish from each pass were held separately; those that could be identified streamside were mea-sured for length (total length ± 1 mm) and weight (± 0.01 g) and released. Small or unidentified fish were preserved in 10% buffered formalin, returned to the laboratory where they were rinsed, transferred to 70% ethanol, identified, and measured for length and weight.
Fish density, biomass, and selected metrics based on the IBI (Karr and others 1986) were used to charac-terize fish assemblages, including species richness, numbers of darter (Etheostamatini), sunfish (Centr-archidae), sucker (Catostomidae), and intolerant spe-cies, and proportions of individuals as green sunfish (Lepomis cyanellus), omnivores, insectivorous cyprinids, and piscivores. Feeding groups and categorical tolerance ratings were determined based on informa-tion from Robison and Buchanan (1988).
On a separate occasion, three consecutive riffles in each stream, including the riffle that was sampled for fishes, were sampled for macroinvertebrates using a Hess sampler with a 600-lm mesh net. Samples were preserved in 70%ethanol. Individuals were identified to the genus level (with the exception of Chironomi-dae and Oligochaeta) according to Merritt and Cum-mins (1996) and Poulton and Stewart (1991). Metrics used to characterize macroinvertebrate assemblages included taxa richness, total abundance expressed as density, Ephemeroptera, Plecoptera, Tricoptera (EPT) richness, proportion of individuals as Chironomidae, ratio of EPT number to Chironomidae number, and percent dominant taxa, calculated as the ratio of the number of individuals from the three most abundant taxa to total abundance (Resh and Jackson 1993).
In-stream Habitat and Riparian Vegetation
In-stream habitat surveys were conducted within a 250-m river reach that included our fish and inverte-brate sampling sites (Bain and Stevenson 1999); the majority of these variables are included in current ra-pid bioassessment protocols (Barbour and others 1999). Ten cross-sectional transects were selected per-pendicular to stream flow. Location of the first transect was selected randomly, and all subsequent transects were spaced at 25-m intervals. Within each 25-m sec-tion, the following measurements were made as a percent of the total surface area or stream bank length: macrohabitat type (i.e., pool, riffle, run), eroded bank, shading (between 1100 and 1300 h), and physical cover (including submersed and emersed vegetation, root wads, fine and coarse woody debris, boulders, and rock ledges). Points at 1-m intervals on each transect were measured to characterize depth, velocity, and substrate composition. A Marsh–McBirney Model 2000 flow meter was used to measure mean water column veloc-ity. Substrate composition was based on a modified Wentworth particle size scale (Bovee and Milhous 1978); the two most abundant substrates categories were used to characterize each square meter along the transect. Data were condensed into percent bedrock, boulder, cobble, gravel, and sand and silt, with the most abundant category considered twice as abundant as the second most abundant category. Riparian vege-tation was assessed by measuring the proportion of forest, shrub, pasture, and road within a 50-m lateral buffer at each transect.
Water Quality
Water samples were collected from each sampling reach during summer at base flow in 1998 and during winter at higher flow in 1999. Water temperature
and dissolved oxygen concentration were measured streamside. A 1-L water sample was collected for lab-oratory analyses of alkalinity, hardness, pH, specific conductance, total dissolved solids, turbidity, and sulfate, chloride, nitrate-nitrogen, and total reactive orthophosphate concentrations. An additional water sample was preserved with H2SO4 and was analyzed
for total Kjeldahl nitrogen, ammonia-nitrogen, and total phosphorus concentrations.
Geographic Information Analysis
The Geographical Resource Analysis Support Sys-tem (GRASS) (USACERL 1993), a raster-based geo-graphic information system (GIS), was used to map watersheds of the rivers at each study site. The Digital Elevation Maps (DEMs), based on 7.5-min, 30-m, US Geological Survey quadrangles that encompass the watershed of each river were patched together using the routine, r.patch, to generate watershed DEMs. The watershed basin analysis program, r.watershed 4.0, was then used to delineate the watershed boundary of each river by inputting coordinates of the sampling site as the outlet point at a 30-m resolution. The result was a watershed basin map from sampling site to headwaters. This base map provided the template upon which map layers were then created for analysis of watershed land cover and ownership and road density in the watershed and within a 100-m buffer of the river channel.
Statistical Analyses
We used two multivariate approaches to compare biotic and physical characteristics among rivers. The first method involved clustering rivers on the basis of their similarities, followed by stepwise discriminant analysis and discriminant function analysis. The second method was unidimensional scaling based on paired comparisons (Guttman 1946). For both methods, 34 variables were incorporated representing biota, in-stream habitat, riparian vegetation, water quality, and watershed attributes.
GuttmanÕs scaling is a multivariate method of quantifying paired comparisons and assigning rank order (Guttman 1946). Other scaling methods based on this early approach have followed that of Guttman (1946), which are closely related or equivalent, some of which were developed for specific applications to yield generally similar ranking results (van de Velden 2004). In this analysis, we followed the original algorithm of Guttman (1946), but we emphasize our general quan-titative approach in this protocol, rather than specific analytical procedures, and other equivalent scaling techniques would be acceptable toward the objective of ranking rivers.
To utilize this method, a set of base values was established, against which all observed values were compared. For our study, the base values represent characteristics of a conceptually ideal headwater river reach with theoretically maximum ecological integrity among rivers of the Boston Mountain ecoregion. A similar approach was proposed by Novak and Bode (1992), in which they developed an ideal macroinver-tebrate community from unpolluted stream sites as a comparative reference. The ideal value for each of the 34 variables in our study was set at the upper or lower end of the range (maximum or minimum) or median for the 10 rivers based on theoretical and empirical relationships with ecological integrity developed in other areas of the midwestern United States (e.g., Karr and others 1986) (Table 1). Although validating these relationships is beyond the scope of this study, we note that these relationships have been generally supported in several biological response models (e.g., Leonard and Orth 1986; Simon 1998, 2003; Angermeier and others 2000). For example, because richness of native species is considered to be directly correlated with ecological integrity, the value was set at the maximum found for the 10 rivers. An intermediate value, the median, was used for attributes that are believed to show a curvilinear relationship with anthropogenic disturbance (i.e., in situations where either high or low values are indicative of disturbance). The percentage of eroded bank was high in many of these rivers, but it is unclear whether this is a natural phenomenon associated with regional geomorphology (e.g., eleva-tion gradient or bedrock/boulder substrate) or an artifact of intensive timber harvest in the past. Because there was no clear indication that an eroded bank was indicative of anthropogenic disturbance, a median va-lue was used in the model of an ideal river. For attri-butes considered to be inversely correlated with ecological integrity, the minimum was used. We con-sidered the minimum value for the proportion of sand and silt substrate to be optimal because the sandstone
and shale geology and morphology of the Boston Mountain ecoregion results in headwater reaches with naturally very low proportions of in-stream sand and silt (Davis and Bell 1998).
GuttmanÕs scaling employs a matrix method to compare the value for each variable for each river to the corresponding ideal value. The absolute deviation from the maximum, minimum, or median ideal value was calculated, and relative values obtained were then used to rank the rivers for each variable. The ideal river was always assigned the rank of 1, and no ties were allowed with the ideal river. Finally, ranks were used to compute GuttmanÕs scale, a one-dimensional scale that describes a composite distance between rivers, with the ideal receiving the highest score and the river most distant from the ideal receiving a score of 0.
Results
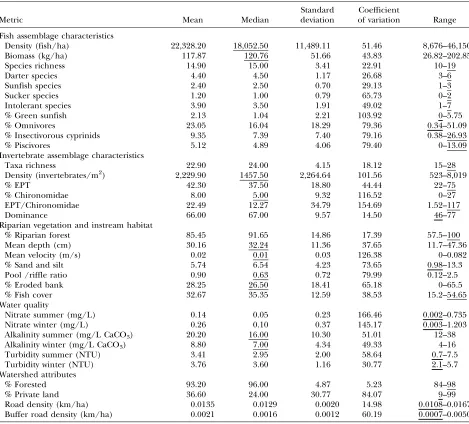
Biotic and physical characteristics varied widely among the 10 study rivers, but they were typical of those found in headwater reaches of the ecoregion (Table 1). The mean coefficient of variation was 64.3 for all 34 variables, 63.6 for the biotic variables, and 65.0 for the physical variables, indicating that the var-iation in data representing animal biota was similar to that for the composite of physical, chemical, and wa-tershed variables.
Fish and Macroinvertebrate Assemblages
Thirty-seven fish species from 9 families were col-lected from the 10 rivers [see Radwell (2000) for population estimates according to river]. No non-na-tive fish species were found. Slender madtom (Noturus exilis) and longear sunfish (Lepomis megalotis) were the only species common to all rivers. Eleven species were unique to only one site. Central stoneroller ( Campos-toma anomalum) and bluntnose minnow (Pimephales notatus) were the primary representatives of the omni-vore category. Juvenile lampreys were collected at one site, but not identified to species. Sites with high fish density were dominated by the central stoneroller and rainbow darter (Etheostoma caeruleum), which accounted for at least 62%of the total fish density within a site.
Cheumato-psychemade up 62%of the sample from one site, with nets of the two caddisfly species capturing a dense mass of other invertebrate taxa.
In-stream Habitat and Riparian Vegetation
We conducted in-stream habitat surveys during the summer of 1998, a year characterized by higher than average temperatures and drought. Dry riffles in small Boston Mountain streams are common in the summer, but their occurrence was more prevalent than usual in 1998. Differences in mean depth were due largely to the presence of deep pools in some rivers. Mean velocity was low in all rivers; in some cases, it was undetectable.
We measured considerable substrate size diversity; the number of substrate categories present ranged from 8 to 13 based on a modified Wentworth particle size scale (Bovee and Milhous 1978). Substrates of two of the rivers were largely gravel and cobble with no bedrock, in contrast to four that were composed of 34– 51% bedrock. The percentage of eroded bank varied greatly. Physical cover for fishes in the rivers included overhanging banks, coarse woody debris, root wads, submersed and emersed vegetation, boulders, and rock ledges.
Riparian vegetation in a 50-m buffer was most dis-turbed at the White River reach with 57.5% forested; the remainder was shrub and pasture. In contrast, the
Table 1. Statistical characteristics of metrics incorporated in cluster analysis and unidimensional scaling
Metric Mean Median
Standard deviation
Coefficient
of variation Range
Fish assemblage characteristics
Density (fish/ha) 22,328.20 18,052.50 11,489.11 51.46 8,676–46,150 Biomass (kg/ha) 117.87 120.76 51.66 43.83 26.82–202.85 Species richness 14.90 15.00 3.41 22.91 10–19 Darter species 4.40 4.50 1.17 26.68 3–6 Sunfish species 2.40 2.50 0.70 29.13 1–3 Sucker species 1.20 1.00 0.79 65.73 0–2 Intolerant species 3.90 3.50 1.91 49.02 1–7 %Green sunfish 2.13 1.04 2.21 103.92 0–5.75 %Omnivores 23.05 16.04 18.29 79.36 0.34–51.09 %Insectivorous cyprinids 9.35 7.39 7.40 79.16 0.38–26.93 %Piscivores 5.12 4.89 4.06 79.40 0–13.09 Invertebrate assemblage characteristics
Taxa richness 22.90 24.00 4.15 18.12 15–28 Density (invertebrates/m2) 2,229.90 1457.50 2,264.64 101.56 523–8,019
%EPT 42.30 37.50 18.80 44.44 22–75
%Chironomidae 8.00 5.00 9.32 116.52 0–27 EPT/Chironomidae 22.49 12.27 34.79 154.69 1.52–117 Dominance 66.00 67.00 9.57 14.50 46–77 Riparian vegetation and instream habitat
%Riparian forest 85.45 91.65 14.86 17.39 57.5–100 Mean depth (cm) 30.16 32.24 11.36 37.65 11.7–47.36 Mean velocity (m/s) 0.02 0.01 0.03 126.38 0–0.082 %Sand and silt 5.74 6.54 4.23 73.65 0.98–13.3 Pool /riffle ratio 0.90 0.63 0.72 79.99 0.12–2.5 %Eroded bank 28.25 26.50 18.41 65.18 0–65.5 %Fish cover 32.67 35.35 12.59 38.53 15.2–54.65 Water quality
Nitrate summer (mg/L) 0.14 0.05 0.23 166.46 0.002–0.735 Nitrate winter (mg/L) 0.26 0.10 0.37 145.17 0.003–1.203 Alkalinity summer (mg/L CaCO3) 20.20 16.00 10.30 51.01 12–38 Alkalinity winter (mg/L CaCO3) 8.80 7.00 4.34 49.33 4–16 Turbidity summer (NTU) 3.41 2.95 2.00 58.64 0.7–7.5 Turbidity winter (NTU) 3.76 3.60 1.16 30.77 2.1–5.7 Watershed attributes
%Forested 93.20 96.00 4.87 5.23 84–98 %Private land 36.60 24.00 30.77 84.07 9–99 Road density (km/ha) 0.0135 0.0129 0.0020 14.98 0.0108–0.0167 Buffer road density (km/ha) 0.0021 0.0016 0.0012 60.19 0.0007–0.0050
Upper Buffalo River reach, located on the edge of the Upper Buffalo Wilderness Area, was 100% forested. However, the sampling site on the Upper Buffalo River was sparsely shaded because of a wide gravel and cob-ble floodplain producing a mean bank full width exceeding 30 m. In contrast, the Kings River site was densely vegetated along the land–water interface and was nearly completely shaded.
Water Quality
Physiochemical properties of river water varied among sites and between seasons (summer and winter; Table 1). The geology of the Boston Mountain ecore-gion is primarily sandstone and shale, resulting in streams with relatively low alkalinity (usually less than 18 mg/L). Only Hurricane Creek, Kings River, and War Eagle Creek had higher alkalinity (38, 26, and 38 mg/L, respectively, measured at summer flow). This was reflected in higher specific conductance for these three rivers as well. Phosphate concentrations were low in all rivers. The highest nitrate concentrations were measured in the Kings River, War Eagle Creek, and the White River, but concentrations of ions and nutrients in all rivers were low, relative to other regions.
Watershed Attributes
All watersheds were primarily forested (Table 1). The remainder of land cover consisted of pasture or clear-cut forest, which could not be differentiated with the data available for this GIS analysis. Private land ownership varied greatly, from 9% in the North Fork Illinois Bayou watershed to 99% in War Eagle Creek watershed. Land not in private ownership was held by the US Forest Service, with 20% of Hurricane Creek watershed designated Wilderness. The highest wa-tershed and riparian road densities were found in War Eagle Creek and White River watersheds.
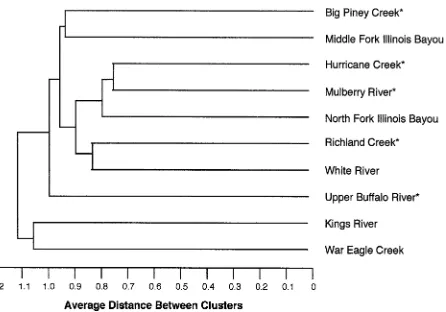
Cluster and Discriminant Analyses
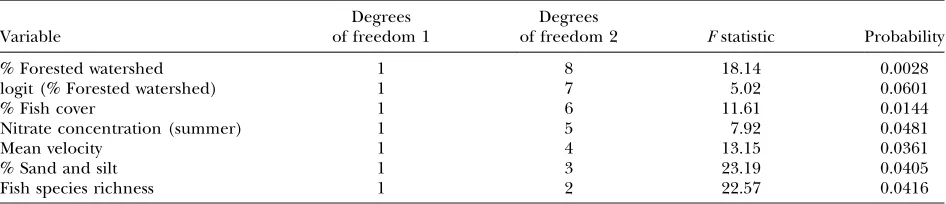
Kings River and War Eagle Creek, neither of which has Wild and Scenic River designation, were distin-guished from the remaining eight rivers at an average distance of 1.12 using cluster analysis (Figure 2). At a significance level (a) of 0.05, the percentage of for-ested watershed was the only variable identified that could distinguish between the groups using stepwise discriminant analysis. However, a grouping based only on this variable yielded one of the 10 rivers classified incorrectly (i.e., the White River was incorrectly in-cluded in the group of two rivers with the lowest per-centage of forested watershed). At an alevel of 0.10, seven variables were significant (Table 2), and incor-porating all seven into discriminant analysis yielded
correct classification. In an effort to develop a more parsimonious classification function, percentage of forested watershed was tested with each of the other six significant variables individually to find if using only percentage of forested watershed and one other vari-able would yield a correct classification. Using the percentage of forested watershed and the logit of the percentage of forested watershed gave an error rate of zero and a cross-validation error rate of zero. None of the other five variables when paired with percentage of forested watershed produced zero error rates. Thus, the final discriminant function contained the per-centage of forested watershed and its logit.
Because the number of canonical variables that can be identified is limited to one less than the number of rivers in the smallest group, only the first canonical variable could be examined, resulting in the following linear discriminant functions.
For membership in Group 1 (Kings River and War Eagle Creek),
G1¼158:95ðpercentage forested watershedÞ 800:53 ðlogit percentage forested watershedÞ 6083:
For membership in Group 2 (eight remaining rivers), G2¼164:92ðpercentage forested watershedÞ 826:33
ðlogit percentage forested watershedÞ 6558:
The equation that generates the higher value (G1 or G2) determines group membership.
only biotic variables (fish and macroinvertebrate assemblage characteristics) to determine if any of these variables could distinguish among rivers. No clear groupings were generated by this analysis.
Unidimensional River Ranking
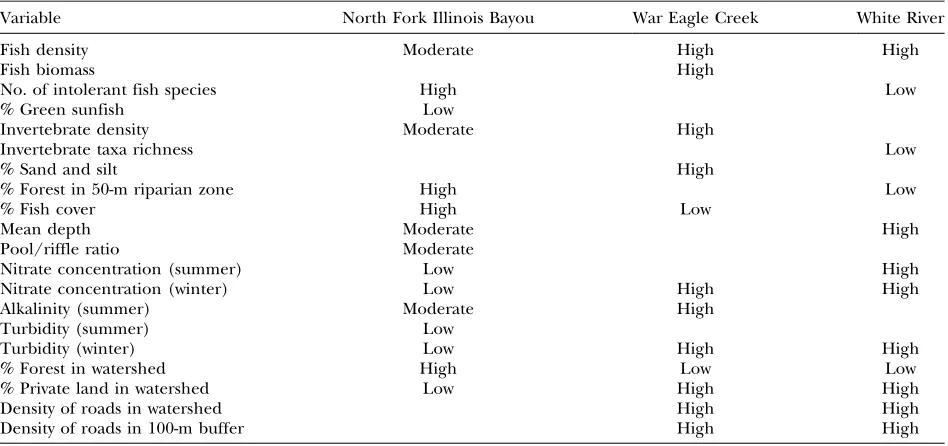
The ranking of these 10 rivers relative to concep-tually ideal conditions is presented in Figure 3. North Fork Illinois Bayou was closest to ideal followed by Middle Fork Illinois Bayou. Neither of these rivers has Wild and Scenic River designation, although both were included in a recent suitability study (US Forest Service 1991). These two rivers were followed in ranking by the five Wild and Scenic rivers and the Kings River, which as a group were similar in their relative relationship to ideal. The White River and War Eagle Creek ranked most distant from ideal and shared similar rankings for a number of variables. Trends among 20 variables ex-plained much of the contrast between North Fork Illinois Bayou (most proximate to ideal) and both the White River and War Eagle Creek (most distant from ideal) (Table 3). Fish density, number of intolerant fish species, and invertebrate density were important biotic variables responsible for the rankings. Contrib-uting physical variables included riparian forest cover, nitrate concentration, turbidity, percentage of forested watershed, percentage of private land ownership, and road density both in the watershed and in a 100-m buffer.
Discussion
Our research revealed several insightful findings applicable to river ecology and management. First, we found that physical characteristics were more influen-tial in ranking rivers in terms of ecological integrity, relative to biotic attributes. Among physical attributes, those at the watershed level, including land use, own-ership, and road density, were the most influential components, playing a major role in discriminating among rivers. However, fish density, biomass, and
occurrence of intolerant fishes were influential biotic factors, as well as invertebrate density and taxa rich-ness. In-stream physical habitat variables were of lim-ited value in describing differences in ecological integrity among rivers. Finally, we found unidimen-sional scaling more effective than cluster analysis in providing a quantitative basis for prioritizing rivers for protection based on ecological integrity.
Cluster analysis followed by stepwise discriminant analysis grouped rivers based on their similarities and then identified the attributes that best discriminated between groups. This approach is based on the pre-mise that rivers in a specific ecoregion naturally share many common characteristics (Rohm and others 1987) and that certain biological, chemical, or physical attri-butes change as a result of human activity. To ade-quately assess ecological integrity, this approach requires a large number of variables relative to the number of observations (rivers assessed). However, the number of discriminating variables that can be identi-fied by stepwise discriminant analysis is limited to two
Table 2. Significant variables (P< 0.10) that distinguished between river groupings based on stepwise discriminant analysis
Variable
Degrees of freedom 1
Degrees
of freedom 2 Fstatistic Probability
%Forested watershed 1 8 18.14 0.0028
logit (%Forested watershed) 1 7 5.02 0.0601
%Fish cover 1 6 11.61 0.0144
Nitrate concentration (summer) 1 5 7.92 0.0481
Mean velocity 1 4 13.15 0.0361
%Sand and silt 1 3 23.19 0.0405
Fish species richness 1 2 22.57 0.0416
less than the number of rivers. In this case, 34 variables were quantified, but the number of discriminating variables that could be identified was limited to eight. Also, because in stepwise analyses, each variable se-lected is dependent on the presence and relationships of all variables selected ahead of it; stepwise discrimi-nant analysis stops when a variable is detected that does not meet the set significance level (a). In this proce-dure on our data, a higher a was ecologically infor-mative in identifying additional influential variables. Finally, only the first canonical variable can be exam-ined if there are only two members in a group, as was the case in our study.
Regardless of these constraints, cluster analysis dis-tinguished among rivers on the basis of a watershed-level variable, percentage of forest, rather than any biotic variable. No clear grouping resulted when biotic variables alone were considered, suggesting that chan-ges in land cover might not have been clearly reflected in the biota at this scale. It could be concluded in this case that although watershed land cover differed, headwater reaches of the rivers were not strongly af-fected by these differences. However, because these watersheds were primarily forested in cover (84–98%), this conclusion cannot be extrapolated to other sys-tems or ecoregions that might be more disturbed. Al-though the utility of cluster and discriminant function analyses yielded a result with limited application in our analysis, the approach is technically sound and could
provide insightful results when applied to a dataset in which some of the rivers have sustained a greater de-gree of disturbance than that encountered in our study.
Our application of unidimensional scaling involved modification of an approach that is frequently used in bioassessment protocols, employing comparison to reference conditions (Hughes 1995; Reynoldson and others 1997). Because at least some of the rivers in our study are recognized as minimally disturbed, estab-lishing ideal conditions as a composite of the best conditions among the 10 rivers was justified. This ap-proach might prove useful in suitability assessments because all rivers in these studies must meet eligibility requirements, but in studies involving more disturbed rivers, this approach might require modification of conceptually ideal metric values using historical infor-mation on biota. Optimal or ideal conditions are obviously rigorous to implement, but might be useful as a set of reference standards, rather than realistic goals. Reference standards could be set at any quanti-tative value that is considered a management goal. This approach avoids the dilemma of selecting specific reaches to represent least-disturbed conditions in watersheds where all reaches are influenced by anthropogenic activities to some degree.
To identify attributes that distinguished among riv-ers, we compared the river with the highest ecological integrity (North Fork Illinois Bayou) to two rivers with
Table 3. Variables and the corresponding trend relative to conceptually ideal conditions
Variable North Fork Illinois Bayou War Eagle Creek White River
Fish density Moderate High High
Fish biomass High
No. of intolerant fish species High Low %Green sunfish Low
Invertebrate density Moderate High
Invertebrate taxa richness Low
%Sand and silt High
%Forest in 50-m riparian zone High Low
%Fish cover High Low
Mean depth Moderate High
Pool/riffle ratio Moderate
Nitrate concentration (summer) Low High Nitrate concentration (winter) Low High High Alkalinity (summer) Moderate High
Turbidity (summer) Low
Turbidity (winter) Low High High
%Forest in watershed High Low Low
%Private land in watershed Low High High Density of roads in watershed High High Density of roads in 100-m buffer High High
the equivalently lowest ecological integrity (War Eagle Creek and the White River) relative to conceptually ideal conditions (Table 3). Physical factors in our analysis, including many watershed-level variables, played a greater role than biotic factors in ranking rivers relative to ideal conditions. Reduced biotic integrity was found in other studies of midwestern United States lotic systems, with 36–84% of their watersheds in agricultural use (Roth and others 1996; Wang and others 1997). The watersheds in our study were much less disturbed, with forest cover ranging from 84%to 98%. The level of watershed disturbance in some of our upper headwater reaches might not be sufficient to reflect changes in biota.
However, we detected indications that changes in land use might have influenced the biota of two rivers that we studied, War Eagle Creek and the White River. Relative to the other rivers, these two had low per-centages of forested watershed and high private land ownership, road densities, nitrate concentrations, and fish densities. In addition, War Eagle Creek had very high fish biomass and invertebrate density, and the White River had the lowest invertebrate taxa richness and number of intolerant fish species. Our results confirm that Boston Mountain ecoregion streams are nutrient-poor, and total fish density, biomass, and production estimates from these streams have been shown to be low compared to other areas (Rambo 1998). Other investigators found that fish abundances increased in moderately degraded and nutrient-en-riched streams (Steedman 1988; Yoder and Smith 1999). High fish and invertebrate productivity, changes in fish assemblage structure, and lower invertebrate taxa richness in War Eagle Creek and the White River might reflect the influence of nutrient enrichment associated with land conversion from forest to pasture in these watersheds.
Some metrics proved more useful than others in determining the relative ranking of rivers in the Boston Mountain ecoregion. Fish density and biomass esti-mates (not conventionally used in fish IBI assess-ments), number of intolerant fish species, invertebrate density, and invertebrate taxa richness were all impor-tant biotic variables. The percentage of fish as omni-vores proved somewhat problematic because of a linkage with the distribution of the central stoneroller, the species that contributed most to this category. This species is very abundant at sites without shade or can-opy cover, which was the case at the Upper Buffalo River site. On the other hand, it was not collected at the Kings River site that was densely shaded, but it was observed to be present during habitat assessment on a longer stream reach. Central stonerollers have been
proposed as an indicator of disturbance in Ozark Pla-teau streams (Petersen 1998); however, we found no evidence that variation in estimates of this species was related to disturbance. Estimates of central stoneroller populations influenced not only the percentage of fishes as omnivores but also total fish density and bio-mass estimates, and they might be closely confounded with shading within a particular stream reach.
In-stream habitat variables, including width, depth, velocity, pool/riffle ratio, and bank condition, were of limited value in determining ecological integrity of our study streams. There is a known relationship between pool/riffle ratios and stream bank full width in gravel bed streams (Leopold and others 1964), but gravel was not the predominant substrate in any of these streams. Thus, those relationships are less applicable.
Watershed-level attributes, including land use, ownership, and road density, were the most influential component in this study, playing a major role in dis-criminating among rivers with ecological integrity closest to ideal conditions versus those more distant from ideal. Under the Wild and Scenic Rivers Act, river segments are assigned wild, scenic, or recreational status based on accessibility by road, and management plans are based on assigned status. Hence, information on road density is useful in the ecological and political assessment process, as well as for future management, should protection be conferred. Furthermore, these findings compel management at broad spatial scales.
causal mechanisms. Although our study addressed assessment of ecological integrity of rivers in a specific ecoregion, this approach, with appropriate refinement, could be applied to other areas to facilitate the process of establishing least-disturbed reference conditions and identifying rivers for protection or restoration.
Acknowledgments
We thank the many colleagues and students who assisted with field data collection for this research, especially D. A. Lichtenberg and C. M. Pevey. R. K. Heth assisted with invertebrate identification, C. M. Pevey identified fishes, M. D. Williamson and A. Gisiger guided GIS analyses, and P. Vendrell facilitated water quality analyses. We are especially grateful to J. E. Dunn and L. K. Duncan for advice and assistance with sta-tistical analyses. Research design and this manuscript were improved by the insight and suggestions of A. V. Brown and P. Vendrell and by constructive interchange with C. Mebane and two anonymous reviewers.
Funding was provided by the Arkansas Cooperative Fish and Wildlife Research Unit, which is jointly sup-ported by the Arkansas Game and Fish Commission, University of Arkansas, US Geological Survey, and Wildlife Management Institute. The North Carolina Cooperative Fish and Wildlife Research Unit is jointly supported by North Carolina State University, the North Carolina Wildlife Resources Commission, U.S Geological Survey, and Wildlife Management Institute.
Literature Cited
Allan, J. D., and A. S. Flecker. 1993. Biodiversity conservation in running waters.BioScience43:32–43.
Angermeier, P. L., R. A. Smogor, and J. R. Stauffer. 2000. Regional frameworks and candidate metrics for assessing biotic integrity in mid-Atlantic highland streams. Transac-tions of the American Fisheries Society129:962–981.
Bain, M. B., and N. J. Stevenson (eds.). 1999. Aquatic habitat assessment: common methods. American Fisheries Society, Bethesda, Maryland.
Barbour, M. T., J. Gerritsen, B. D. Snyder, and J. B. Stribling. 1999. Rapid bioassessment protocols for use in streams and wadeable rivers: periphyton, benthic macroinvertebrates, and fish, 2nd ed. EPA 841-B-99-002. US Environmental Protection Agency, Office of Water, Washington, DC. Benke, A. C. 1990. A perspective on AmericaÕs vanishing
streams. Journal of the North American Benthological Society
9:77–88.
Bohlin, T., S. Hamrin, T. G. Heggberget, G. Rasmussen, and S. J. Saltveit. 1989. Electrofishing: Theory and practice with special emphasis on salmonids.Hydrobiologia173:9–43.
Bovee, K. D., and R. Milhous. 1978. Hydraulic simulation in instream flow studies: Theory and technique. FWS/OBD-7/63. US Fish and Wildlife Service, Fort Collins, Colorado, 124 pp.
Davis, J. V., and R. W. Bell. 1998. Water-quality assessment of the Ozark plateaus study unit, Arkansas, Kansas, Missouri, and Oklahoma: Nutrients, bacteria, organic carbon, and suspended sediment in surface water, 1993–1995. Resources Investigations Report 98-4164. National Water-Quality Assessment Program, US Department of the Inte-rior, US Geological Survey, Little Rock, Arkansas, 56 pp. Davis, W. S., and T. P. Simon (eds.). 1995. Biological
assess-ment and criteria: tools for water resource planning and decision making. CRC Press, Boca Raton, Florida. EPA (US Environmental Protection Agency). 1994. Water
quality standards handbook. EPA-823-B-94-005a. US Envi-ronmental Protection Agency, Washington, DC.
EPA (US Environmental Protection Agency). 2002. Summary of biological assessment programs and biocriteria devel-opment for states, tribes, territories, and interstate com-missions: streams and wadeable rivers. EPA-822-R-02-048. US Environmental Protection Agency, Washington, DC. Guttman, L. 1946. An approach for quantifying paired
com-parisons and rank order. Annals of Mathematical Statistics
17:144–163.
Hughes, R. M. 1995. Defining acceptable biological status by comparing with reference conditions. Pages 31–48inW. S. Davis, T. P. Simon (eds.), Biological assessment and crite-ria: Tools for water resource planning and decision mak-ing. CRC Press, Boca Raton, Florida.
Karr, J. R. 1991. Biological integrity: a long neglected aspect of water resource management.Ecological Applications1:66–84. Karr, J. R. 1995. Protecting aquatic ecosystems: clean water is not enough. Pages 7–14inW. S. Davis, T. P. Simon (eds.), Biological assessment and criteria: tools for water resource planning and decision making. CRC Press, Boca Raton, Florida.
Karr, J. R., and D. R. Dudley. 1981. Ecological perspective on water quality goals.Environmental Management5:55–68. Karr, J. R., K. D. Fausch, P. L. Angermeier, P. R. Yant, and I. J.
Schlosser. 1986. Assessing biological integrity in running water: a method and its rationale. Illinois Natural History Survey, Special Publication 5, Champaign, Illinois, 28 pp. Kwak, T. J. 1992. Modular microcomputer software to
esti-mate fish population parameters, production rates and associated variance.Ecology of Freshwater Fish1:73–75. Leonard, P. M., and D. J. Orth. 1986. Application and testing
of an index of biotic integrity in small, coolwater streams.
Transactions of the American Fisheries Society115:401–414. Leopold, L. B., M. G. Wolman, and J. P. Miller. 1964. Fluvial
processes in geomorphology. W. H. Freeman, San Fran-cisco, California.
Merritt, R. W., and K. W. Cummins. 1996. An introduction to the aquatic insects of North America, 3rd ed. Kendall/ Hunt Publishing, Dubuque, Iowa.
National Research Council. 1992. Restoration of aquatic ecosystems: science, technology, and public policy. Na-tional Academy Press, Washington, DC.
Novak, M. A., and R. W. Bode. 1992. Percent model affinity: a new measure of macroinvertebrate community composi-tion.Journal of the North American Benthological Society11:80– 85.
Omernik, J. M. 1987. Ecoregions of the conterminous United States. Annals of the Association of American Geographers
77:118–125.
Palmer, T. 1993. The Wild and Scenic Rivers of America. Is-land Press, Washington, DC.
Petersen, J. C. 1998. Water-quality assessment of the Ozark plateaus study area, Arkansas, Kansas, Missouri, and Okla-homa: Fish communities in streams in the Ozark plateaus and their relations to selected environmental factors. Water-Resources Investigations Report 98-4155. National Water-Quality Assessment Program, US Department of the Interior, U.S. Geological Survey, Little Rock, Arkansas, 33 pp.
Poulton, B. C., and K. W. Stewart. 1991. The stoneflies of the Ozark and Ouachita mountains (Plecoptera).Memoirs of the American Entomological Society38:1–116.
Radwell, A. 2000. Ecological integrity assessment of Ozark rivers to determine suitability for protective status. MS thesis, University of Arkansas, Fayetteville, Arkansas, 107 pp.
Rambo, R. D. 1998. Ozark stream fish assemblages and black bass population dynamics associated with watersheds of varying land use. MS thesis, University of Arkansas, Fay-etteville, Arkansas, 98 pp.
Resh, V. H., and J. K. Jackson. 1993. Rapid assessment ap-proaches to biomonitoring using benthic macroinverte-brates. Pages 195–233inD. M. Rosenberg. and V. H. Resh (eds.), Freshwater biomonitoring and benthic macroin-vertebrates. Chapman & Hall, New York.
Reynoldson, T. B., R. H. Norris, V. H. Resh, K. E. Day, and D. M. Rosenberg. 1997. The reference condition: a compari-son of multimetric and multivariate approaches to assess water-quality impairment using benthic macroinverte-brates. Journal of the North American Benthological Society
16:833–852.
Robison, H. W., and T. M. Buchanan. 1988. Fishes of Arkansas. University of Arkansas Press, Fayetteville, Ark-sansas.
Rohm, C., J. W. Giese, and C. C. Bennett. 1987. Evaluation of an aquatic ecoregion classification of streams in Arkansas.
Journal of Freshwater Ecology4:127–140.
Rosenberg, D. M., and V. H. Resh (eds.). 1993. Freshwater biomonitoring and benthic macroinvertebrates. Chapman & Hall, New York.
Roth, N. E., J. D. Allan, and D. L. Erickson. 1996. Landscape influences on stream biotic integrity assessed at multiple spatial scales.Landscape Ecology11:141–156.
SAS. 1990. SAS/STAT userÕs guide, version 6, 4th ed. Volumes 1 and 2. SAS Institute Inc., Cary, North Carolina.
Seber, G. A. F. 1982. The estimation of animal abundance and related parameters. 2nd ed. Charles Griffin, London. T. P. Simon (ed.). 1998. Assessing the sustainability and bio-logical integrity of water resources using fish communities. CRC Press, Boca Raton, Florida.
T. P. Simon (ed.). 2003. Biological response signatures: indicator patterns using aquatic communities. CRC Press, Boca Raton, Florida.
Stanford, J. A., and J. V. Ward. 1979. Stream regulation in North America. Pages 215–236 in J. V. Ward and J. A. Stanford (eds.), The ecology of regulated streams. Plenum, New York.
Steedman, R. J. 1988. Modification and assessment of an in-dex of biotic integrity to quantify stream quality in south-ern Ontario.Canadian Journal of Fisheries and Aquatic Sciences
45:492–501.
USACERL (US Army Corps of Engineers Construction Engineering Research Laboratories). 1993. GRASS (Geo-graphical Resources Analysis Support System) 4.1 userÕs reference manual. US Army Corps of Engineers Construc-tion Engineering Research Laboratories, Champaign, Illi-nois.
US Forest Service. 1991. Wild and Scenic River study report and final environmental impact statement on thirteen riv-ers in the Ozark National Forest. US Forest Service Southern Region, Ozark National Forest. Management Bulletin R8-MB55, Russellville, Arkansas.
US National Park Service. 1982. Nationwide rivers inventory. US Government Printing Office, Washington, DC. van de Velden, M. 2004. Optimal scaling of paired
compari-son data.Journal of Classification21:89–109.
Vannote, R. L., G. W. Minshall, K. W. Cummins, J. R. Sedell, and C. E. Cushing. 1980. The river continuum concept.
Canadian Journal of Fisheries and Aquatic Sciences37:130–137. Wang, L., J. Lyons, P. Kanehl, and R. Gatti. 1997. Influences of watershed land use on habitat quality and biotic integrity of Wisconsin streams.Fisheries22(6):6–12.
Williams, B. K., J. D. Nichols, and M. J. Conroy. 2002. Analysis and management of animal populations. Academic Press, San Diego, California.