ABSTRACT
HU, ZUSHOU. Atomic Simulation of Nanoparticles and Polyethylene-Nanodiamond Composites. (Under the direction of Donald W. Brenner).
We examine the size and surface orientation/principal axis dependent stability of
nanodiamonds and nanorods. We find that the nanodiamonds and nanorods are thermally stable at nanoscale; however, the (001) surface will tend to form dimers, and the (111)
Atomic Simulation of Nanoparticles and Polyethylene-Nanodiamond
Composites
by Zushou Hu
A dissertation submitted to the Graduate Faculty of North Carolina State University
in partial fulfillment of the requirements for the degree of
Doctor of Philosophy
Materials Science and Engineering
Raleigh, North Carolina 2009
APPROVED BY:
_______________________________ ______________________________ Prof. Donald W. Brenner Prof. Maurice Balik
DEDICATION
献给我的父母
和我的夫人杨海鸥
To my parents,
BIOGRAPHY
Zushou Hu was born in an honest farmer family having traditional rattan weaving on May 2nd, 1975 in Shichuan, a small village in Yongkang County, Zhejiang province, east of China. He was the naughtiest one in his family and spent almost all his childhood in the farm fields except the school time. After a family visit at his 8th grade, he began to study hard and developed his interest in science and mathematics. He entered Yongkang 1st High School in 1990, where he built solid background in mathematics and other science subjects. In 1993, he graduated for the second best from high school and was enrolled in the Department of Chemical Engineering at Tsinghua University for some reasons though he had the strong desire to study Electrical Engineering or Computer Science because he likes math, logic and reasoning. However, he kept to teach himself the subjects on psychology, mathematics, control theory and computer science besides his major. After graduation, he continued his study on systems engineering in the Department of Automation, obtaining his master degree in 2002 under the direction of professor Dazhong, Zheng. In the same year, he joined the Department of Chemical Engineering at the University of Tennessee at Knoxville and later transferred to North Carolina State University in 2003. He will get a Ph.D degree in Computational Materials Science with a minor in Mathematics at May 2009 and continue his post-doctoral research on Life Cycle Study at the Department of Chemical and Biomolecular Engineering at Georgia Institute of Technology.
Mr. Hu met his wife Haiou Yang at Tsinghua University and got married after they
both graduated from their Master programs. They have two children, Yang Forest Hu (胡杨)
ACKNOWLEDGMENTS
I would like to express my gratitude to those who positively affected my life with
their support, wisdom, love, and care.
I would like to thank my advisor Prof. Donald W. Brenner for his guidance, support
and inspiration. His passion for the science and technology has fostered and fortified mine,
which will be lasting for the rest of my life. I would like to thank my committee members,
Prof. Ronald O. Scattergood, Prof. C. Maurice Balik and Prof Zhilin Li for their guidance
and suggestion.
I would like to thank the members of the Computational Materials Science group
members for their kindness, friendship, generous help, invaluable discussion, and the happy
collaborative working environment they provided. Special thanks go to Olga Shenderova,
Yanhong Hu, Douglas L. Irving and Cliff Padgett for their help in conducting some of the
experiments included in this project. In addition, I wish to thank J. Wesley Crill to help me
review my dissertation and Ms. Edna Deas for her help in administrative matters.
Finally, I would like to give my deep thanks to my close family members, my parents,
my brothers and sisters, and my wife for their endless support, care, and unconditional love.
A little special thank-you note should be given to my lovely sons, Yang Forest Hu and Hairui
TABLE OF CONTENTS
LIST OF TABLES ... vii
LIST OF FIGURES ... ix
CHAPTER 1. INTRODUCTION ... 1
1.1 NANODIAMONDS AND NANORODS ... 1
1.2 NANOCOMPOSITES ... 4
1.3 REFERENCES ... 11
CHAPTER 2. COMPUTATIONAL METHODS ... 17
2.1 REACTIVE EMPIRICAL BOND-ORDER (REBO) POTENTIAL ... 17
2.2 MOLECULAR DYNAMICS ... 20
2.3 LOCAL STRESS ANALYSIS ... 26
2.4 REFERENCES ... 28
CHAPTER 3. STABILITY OF NANODIAMONDS ... 30
3.1 INTRODUCTION ... 30
3.1.1 NANODIAMOND APPLICATION ... 31
3.1.2 CHARACTERIZATION AND STRUCTURE OF NANODIAMONDS ... 31
3.2 STABILITY OF NANODIAMONDS ... 32
3.3 SUMMARY ... 39
3.4 REFERENCES ... 40
CHAPTER 4. STABILITY OF NANORODS ... 48
4.1 INTRODUCTION ... 48
4.2 STABILITY OF NANORODS ... 50
4.3 SUMMARY ... 52
4.4 REFERENCES ... 53
CHAPTER 5. GLASS TRANSITION OF POLYETHYLENE-NANODIAMOND COMPOSITES ……… ... 57
5.1 INTRODUCTION ... 57
5.1.1 SURVEY OF GLASS TRANSITION THEORY AND COMPUTAIONAL APPROACHES ... 58
5.1.2 MEASUREMENT OF FREE VOLUME ... 62
5.2 SIMULATION DETAILS AND SAMPLE PREPARATION ... 64
5.2.1 POTENTIALS ... 64
5.2.2 SAMPLE PREPARATION ... 68
5.2.3 SIMULATION DETAILS ... 71
5.3 RESULTS AND DISCUSSIONS ... 73
5.4 SUMMARY ... 82
5.5 REFERENCES ... 83
6.2 SIMULATION DETAILS AND SAMPLE PREPARATION ... 118
6.2.1 POTENTIALS ... 118
6.2.2 SAMPLE PREPARATION ... 121
6.2.3 SIMULATION DETAILS ... 122
6.3 LINEAR ELASTIC STRESS-STRAIN RELATION ... 124
6.4 RESULTS AND DISCUSSIONS ... 128
6.5 SUMMARY ... 131
6.6 REFERENCES ... 132
LIST OF TABLES
Table 5.1 Samples used in our studies ... 112
Table 5.2 Parameters obtained from fitting the specific volume vs T (see Figure 5.6) for the NPT ensemble cooling data at 1 bar. ... 112
Table 5.3 Parameters obtained from fitting the specific volume υ vs T (see Figure 5.7) for the
NPT ensemble cooling data at 100 bar. ... 112
Table 5.4 Parameters obtained from fitting the specific volume υ vs T (see Figure 5.8) for the
NPT ensemble cooling data at 100 bar. ... 113
Table 5.5 Parameters obtained from fitting the specific volume υ vs T (see Figure 5.9) for the
NPT ensemble cooling data at 1bar. ... 113
Table 5.6 Parameters obtained from fitting the specific volume υ vs T (see Figure 5.10) for
the NPT ensemble cooling data at 1bar. ... 113
Table 5.7 Parameters obtained from fitting the specific volume υ vs T (see Figure 5.11) for
the NPT ensemble cooling data at 1bar. ... 114
Table 5.8 The effect of nanodiamond on the diffusion coefficient of long/short chain polymer at 600 K (unit: ) ... 114
Table 6.1 Functional form and parameters for force field model of polyethylene and nano-diamond... 142
Table 6.2 Characteristics of polyethylene chains in various nanocomposites and neat systems ... 143
Table 6.3 The Young's modulus (GPa) for the sample group containing 14 NDs and 97x40 polyethylene (SG-I). ... 143
Table 6.4 The Young's modulus (GPa) for the sample group containing 14 NDs and 97x200 polyethylene (SG-II). ... 143
Table 6.6 The Young's modulus (GPa) for the sample group containing 14 NDs and 40x200 polyethylene (SG-IV)... 143
Table 6.7 Bulk densities of polyethylene in neat PE and in nanocomposites (g/cm3)... 143
LIST OF FIGURES
Figure 2.1 In the full expression the bonds are counted to the extent they cross the area of
interest. Dark segments of bonds contribute; dotted segments do not. ... 27
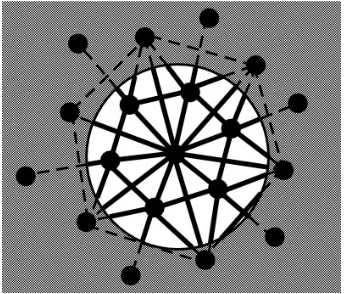
Figure 3.1 The Surface transformation of cubooctahedra to fullerence like structure ... 42
Figure 3.2 Representative structures from the set of ND morphologies simulated. ... 42
Figure 3.3 Schematic diagram of dimers – top view and side view. ... 42
Figure 3.4 Number of under-coordinated surface atoms of different types for a spherical particle as a function of the number of atoms along the diameter. ... 43
Figure 3.5 Histograms of atomic energies of carbon atoms for three octahedral particles (top) (C10H16 (N=2), C35H36 (N=3), C1330H400 (N=10)) and two cubo-octahedral particles (bottom) (C436H208 (N=8), C1550H432 (N=12)). Arrows from the bottoms of the pictures mark energies of carbon atoms in bulk diamond (-7.37eV) and at the (111) hydrogenated (-7.8 eV) and (100) 2x1 reconstructed (-7.5 for C2+1H, -7eV for C4-2d row and -6.9eV for the C4-3drow) macroscopic surfaces. ... 44
Figure 3.6 Cohesive energy from simulations with the bond-order potential (open symbols) and predicted analytically (solid symbols). ... 45
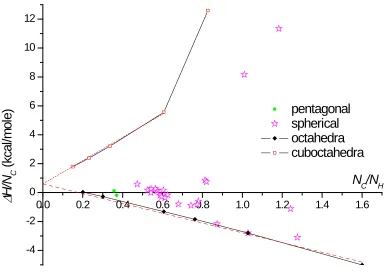
Figure 3.7 Heats of formation for hydrogenated octahedra and cuboctahedra. ... 46
Figure 3.8 Heats of formation for hydrogenated octahedra, (001)2x1 reconstructed cubo-octahedra, spherical clusters and pentagonal clusters. ... 47
Figure 4.1 Representative structures from the set of DNR morphologies simulated. The top structures correspond to orientation along the DNR axis; the bottom structures correspond to orientations. Surface orientations for the top structures, left to right: (011), (011), and (001), (001). Surface orientation for the bottom structures, left to right (011) and (001), (001) and (111), (111). ... 55
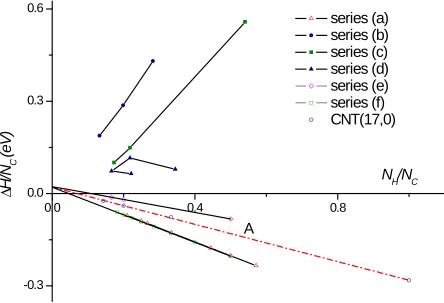
Figure 4.2 Atomic enthalpy of formation versus the hydrogen-to-carbon ratio for DNRs of infinite length (via a periodic boundary) corresponding to the different morphologies represented in Figure 4.1... 56
Figure 5.1 Individual chain model. The spherical “segment” simulates a CH2 or CH3 unit. A harmonic force constrains the bond length around the equilibrium length . The bond angle is likewise constrained around the tetrahedral angle. The torsional
l l0
angle , given by the angle between the plane containing segments , and and that contains segments , , and , is subject to a threefold potential having trans and gauche minima. Segments separated by more than three bonds along the chain (for example and ), as well as segments which belong to different chains, interact according to a truncated Lennard-Jones potential. ... 85
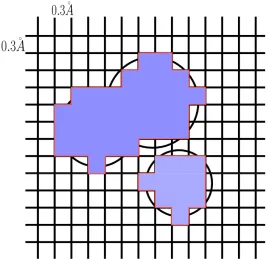
Figure 5.2 Two dimensional illustration of a free volume calculation. ... 85
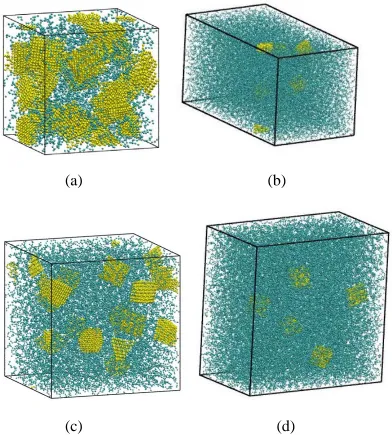
Figure 5.3 Composite samples at 1 bar and 600 K used in our studies (a) 12 NDs and 97x40 polyethylenes, (b) 6 NDs and 720x80 polyethylenes, (c) 12 NDs and 97x200
polyethylenes, and (d) 5 NDs 1440x40 polyethylenes. ... 86
Figure 5.4 Radial distribution function g(r) for (a) system with 12 NDs and 97x200
polyethylene and (b) system with 12 NDs and 97x40 polyethylene. ... 87
Figure 5.5 Temperature tracking for cooling procedure – polyethylene-NDs systems without linkages between polyethylene and NDs. ... 88
Figure 5.6 Average unit cell volume versus dynamics temperature for isobaric cooling at atmospheric pressure (1 bar) for the sample with 12 NDs and 97x200 polyethylenes. The symbols represent the simulation data, the solid lines represent the best linear fits (see Table 5.2) and the long red lines are extrapolations of the high temperature solid lines to below the glass transition. The black lines indicate for each system. ... 89
Figure 5.7 Average unit cell volume versus dynamics temperature for isobaric cooling at 100 bar for sample with 12 NDs and 97x200 polyethylenes. The symbols represent the simulation data, the solid lines represent the best linear fits (seeTable 5.3) and the long red lines are extrapolations of the high temperature solid lines to below the glass transition. The black lines indicate for each system. ... 90
Figure 5.8 Average unit cell volume versus dynamics temperature for isobaric cooling at 1 bar for the sample with 5 NDs and 720x80 polyethylenes. The symbols represent the simulation data, the solid lines represent the best linear fits (see Table 5.4) and the long red lines are extrapolations of the high temperature solid lines to below the glass transition. The black lines indicate for each system. ... 91
Figure 5.9 Average unit cell volume versus dynamics temperature for isobaric cooling at 1 bar for the sample with 5 NDs and 1440x40 polyethylenes. The symbols represent the simulation data, the solid lines represent the best linear fits (see Table 5.5) and the long red lines are extrapolations of the high temperature solid lines to below the glass transition. The black lines indicate for each system. ... 92
φ i−2 i−1 i
1
i− i i+1
3
i− i+1
Figure 5.10 Average unit cell volume versus dynamics temperature for isobaric cooling at 100 bar for the sample with 6 NDs and 1440x40 polyethylenes. The symbols represent the simulation data, the solid lines represent the best linear fits (see Table 5.6) and the long red lines are extrapolations of the high temperature solid lines to below the glass transition. The black lines indicate for each system. ... 93
Figure 5.11 Average unit cell volume versus dynamics temperature for isobaric cooling at 1 bar for sample with 12 NDs and 97x40 polyethylenes. The symbols represent the simulation data, the solid lines represent the best linear fits (see Table 5.7) and the long red lines are extrapolations of the high temperature solid lines to below the glass transition. The black lines indicate for each system. ... 94
Figure 5.12 The relative size of nanodiamond and polymer chain ... 94
Figure 5.13 Pristine unit cell volume versus dynamics time ... 95
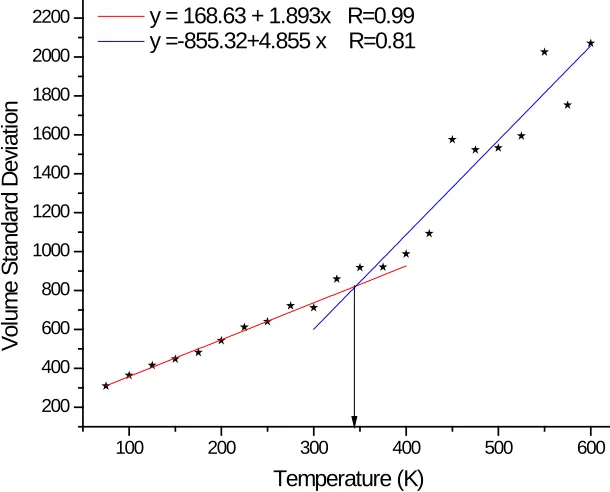
Figure 5.14 Standard deviation of the unit cell volume versus dynamics temperature for pure polyethylene ... 99
Figure 5.15 Standard deviation of the unit cell volume versus dynamics temperature for composites without crosslinks ... 100
Figure 5.16 Standard deviation of the unit cell volume versus dynamics temperature for composites with crosslinks ... 101
Figure 5.17 Compressibility versus temperature for pure sample with short/long chain ... 101
Figure 5.18 End-end distance versus dynamics temperature for the sample group with 12 NDs and 97x200 polyethylenes ... 102
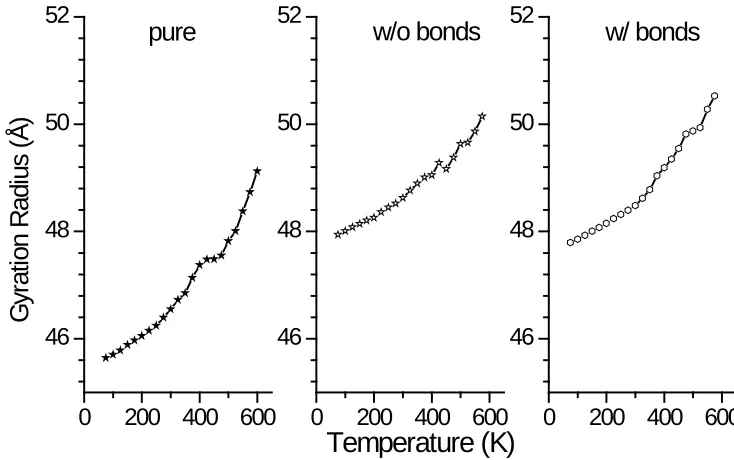
Figure 5.19 Gyration radius for the sample group with 12 NDs and 97x200 polyethylenes 102
Figure 5.20 Plots of some energy components versus temperature for pure polyethylene: (a) bond energy; (b) angle energy; (c) torsion energy; (d) non-bond energy ... 103
Figure 5.21 Plots of some energy components versus temperature for composites without bonds: (a) bond energy; (b) angle energy; (c) torsion energy; (d) non-bond energy 104
Figure 5.22 Plots of some energy components versus temperature for composites with bonds: (a) bond energy; (b) angle energy; (c) torsion energy; (d) non-bond energy ... 105
Figure 5.23 The illustration of the transition state and the conformational state. Minimum of the energy curve is the , , and conformational state. The shaded domains are the transition state areas. ... 106
Figure 5.24 The occurrences of transition versus temperature ... 106
Figure 5.25 Activation energy of torsional rotation... 107
Figure 5.26 Available free volume in three samples at 1 bar. ... 108
Figure 5.27 Difference hole volume as a function of the temperature. ... 109
Figure 5.28 Number of cavities versus volume for composites w/o bonds at 100 bar and 600 K; (a) pure; (b) composites w/o bonds; (c) composite with bonds. ... 109
Figure 5.29 Snapshot of 1 nm slice of composites without bonds at 6 different temperatures. ... 110
Figure 5.30 Radial distribution function of CH2 units in a composite without crosslinks. .. 111
Figure 5.31Mean square displacement versus temperature ... 111
Figure 6.1 Individual chain model. The spherical “segment” simulates a CH2 or CH3 unit. A harmonic force constrains the bond length around the equilibrium length . The bond angle is likewise constrained around the tetrahedral angle. The torsional angle , given by the angle between the plane containing segments , and and that containing segments , , and , is subject to a threefold potential having trans and gauche minima. Segments separated by more than three bonds along the chain (for example and ), as well as segments which belong to different chains, interact according to a truncated Lennard-Jones potential. ... 135
Figure 6.2 Periodic box of different neat and nanocomposite models (see Table 6.2) used in the simulations. Note the size of the box obtained after complete equilibration. (a) neat polyethylene; (b) composites w/o chemical bonds; (b) composites w/ chemical bonds. ... 136
Figure 6.3 Schematic diagram of deformed (dashed line) and un-deformed (solid line) shape of the unit showing unidirectional tension (NST approach). ... 137
Figure 6.4 In the full expression, the bonds are counted to the extent that they cross the area of interest. Dark segments of bonds contribute; dotted segments do not. ... 137
Figure 6.5 Measured tension (- ) as a function of percentage extension for tension applied at 1 bar/ps under 100 K for the sample group containing 14 NDs and 97x40 polyethylene. ... 138
free V
∆
l l0
θ
φ i−2 i−1 i
1
i− i i+1
3
Figure 6.6 Measured tension (- ) as a function of percentage extension for tension applied at 1 bar/ps under 100 K for the sample group containing 14 NDs and 97x200 polyethylene. ... 138
Figure 6.7 Measured tension (- ) as a function of percentage extension for tension applied at 1 bar/ps under 300 K for the sample group containing 14 NDs and 97x200 polyethylene. ... 139
Figure 6.8 Free volume vs. external pressure for (a) SG-I and (b) SG-II at 300 K. ... 139
Figure 6.9 Radial density distribution of various for (a) SG-I and (b) SG-III at 300 K and atmospheric pressure. ... 140
Figure 6.10 PE-C radial distribution function (RDF) of (a) SG-I and (b) SG-III at 300 K and atmospheric pressure. ... 140
CHAPTER 1.
INTRODUCTION
1.1 NANODIAMONDS AND NANORODS
Nanoscale diamonds are widely existed in interstellar dusts and meteorites[1-4]. On
earth, nanodiamonds can be produced by detonation[5]. These nanodiamonds are often called
‘Ultra Dispersed Diamond’ (UDD) because of their very narrow size distribution peaked, e.g.
around ~4 nm. Recently nanodiamonds were synthesized by Chemical Vapor Deposition
(CVD) techniques[6]. The characterization of nanodiamonds produced by detonation and
CVD has revealed interesting, common features, nanodimensions (~4 nm), chemical stability
of their core and activity of their peripheral shell.
The shape of ND particles is often assumed to be spherical based on transmission
electron microscopy (TEM) pictures obtained without high enough magnification or without
isolation of the nanoparticles from one another from the amorphous matrix. More
comprehensive studies of HRTEM images reveled that ND particles rarely have a spherical
shape[7]. The high-resolution transmission electron microscopy (HRTEM) images[7] also
showed that the ND clusters consisted typically of regularly shaped cubo-octahedral and
twinned crystals.
Each ND particle is coated by a shell of differently sp hybridized carbon atoms[8, 9]
with a narrow size distribution in the region of ~ 4 nm, which was reported more once. The
out a thermodynamically stable form of nano-carbon. This hypothesis was confirmed by ab
initio modeling of the stable form of nanocrystalline diamond morphologies[10, 11].
However, as the size of diamond is reduced to about 3 nm, it is energetically favorable for
this particle to have bare, reconstructed surface, such as the transformation to fullerence like
structures. These suggested that the phase stability of carbon particle is size dependent.
Because of its extreme hardness, outstanding wear resistance, wide optical
transparency, and other unique properties, nanodiamond has been used widely in many
fields. The remarkable mechanical properties of NDs suggest immediately their application
in abrasive materials or components of coatings[12-14]. The rich surface chemistry of NDs,
the absence of toxic impurities and their small size make nanodiamonds very convenient for
biomedical applications. By creating specific sites on NDs for selective molecular
attachment, nanodiamond can be used for example in nanofabrication, self assembly,
nanosensors, bioprobes, drug delivery, and pigments[15]. The typical diameter of NDs is
about 5 nm, and about 10% of carbon atoms are at the surface. NDs can have significant
bonding which gives rise to unique electronic and magnetic features due to the lower energy
gap of transitions relative to transitions. The investigation of field electrons
from ND-based structures [16-18] has shown their potential for electrochemical electrodes
and field emission structure, where high conductivities are required[17].
Diamond nanorod (DNR) is yet another one-dimensional carbon nanostructure. DNRs
have been fabricated by several methods, including top-down approaches in which diamond
without spatial confinement[23, 24]. The range of diameters of both polycrystalline and
single-crystal DNRs span several tens of nanometers[25]. Their energetic stability compared
to CNTs has been confirmed by both molecular modeling and first principle methods[26, 27].
Compared to the vast majority of research on another one-dimensional carbon
nanostructure – nanotubes (CNTs), DNRs, which also hold promise for several important
applications, are less studied. Aggregated DNRs have superior wear resistance[28], which is
up to 300% in comparison with commercially available polycrystalline diamonds (PCDS).
The relatively inert chemistry, the high mechanical strength and the high thermal
conductivity of bulk diamond suggest that DNRs may find important applications as fillers in
nanocomposites for structural and thermal management applications. DNRs may also be
insulating, semi-metallic, or semiconducting depending on doping status, diameter, surface
morphology and the degree of hydrogenation, suggesting that DNRs may have unique niche
applications in nanoeletronics[29].
Though it is confirmed that the nanodiamonds and nanorods are energetically and
mechanically viable structures at diameters about 4 nm, the studies by Barnard et al[10]
showed that the stability was also dependent on both the surface morphology and the
crystallographic direction of the principal axis of the nanowire. These studies have
motivated a number of researchers to re-examine the phase stability of diamond at the
nanometer scale. In our studies, we will expand the research on the stability of
nanodiamonds and nanorods on the surface morphology and the crystallographic direction of
1.2 NANOCOMPOSITES
Over the past few decades, polymers have replaced many of the conventional
metals/materials in various applications due to the advantages polymers offer over
conventional materials, such as the ease of processing, productivity, and cost reduction.
However, polymers have lower moduli and strengths compared to metals and ceramics. One
way to improve their mechanical and thermal properties is to modify them using fillers, such
as fibers, whiskers, platelets, or particles, to form polymer composites to get desirable
materials properties not achieved by either phase alone or to reduce cost further. Actually, the
idea of using filler as reinforcement is nothing new: straw has been to used in China reinforce
mud bricks since about 4000 BC.
In conventional polymer composites, many inorganic types of filler with dimensions
in the micrometer range, e.g. calcium carbonate, glass beads, clay and naturals fibers, have
been extensively used to enhance the mechanical properties of polymers[30, 31]. Such
properties can be achieved by changing the volume fraction, shape and size of filler particle
[3-5]. The success in the application of the Nylon6-clay hybrid developed by the research
group in the Toyota Central Research and Development Laboratories, Inc., Japan in 1986
revealed the possibility of achieving remarkable improvements in thermal and mechanical
properties of polymeric composites by incorporating a very low loading of nano clay
filler[32]. This achievement attracted further investigations and revelations in polymer
systems that contain dispersed nanoparticles, such as layered silicates, nano-CaCO3 and
properties generally not obtainable in conventional polymer composites [4-7]. A big
improvement, even at relatively low filler content, of the mechanical properties is achieved
by using filler materials with a larger aspect ratio such as short glass fibers[4-6]. It is logical
to anticipate that with a dispersion of fillers of nanometer-level dimensions, having larger
aspect ratio and stiffness in a polymer matrix could lead to even higher mechanical
performances. This leads to the pervasiveness of carbon nanotubes (CNTs), including
single-wall and multi-single-wall nanotubes, in most areas of science and engineering due to their
remarkable physical and mechanical properties[33-40].
Even though it has been shown that the CNTs have the potential to have excellent
mechanical properties, the relatively high costs of development and manufacturing of
nanotube/polymer composites has been prohibitive. An alternative way is the use of
nanoparticles. Nanoparticles, sized between 1 and 100 nanometers, usually have a smaller
aspect ratio than CNTs; they are also promising reinforcing and/or toughening materials for
polymers. In the past few years, polymeric composites reinforced with nanoparticles,
including Calcium carbonate (CaCO3) and silica, have generated considerable attention
among materials scientists and engineers due to their potential for superior physical,
chemical, and mechanical properties in composite structures[12-14, 41-44]. These
improvements, which are difficult to predict with current micromechanics theories, depend
on a set of factors that include nanoparticle size, shape, volume fraction, degree of
dispersion, nanofiller chemistry, characteristics of the polymer matrix, and interactions
contributions to the overall nanocomposite properties: surface-to-volume ratio of the fillers
and excluded volume interactions. They are the heart of the ‘nano’ effect on mechanical
properties in nanocomposites. The surface-to-volume ratio of the filler is the primary reason
to develop nanocomposites because high interface region means high efficient transfer of
stress across the composite components. The excluded volume interactions determine the
dispersing of fillers in the polymer matrix. High-aspect ratio objects, such ad long cylinders,
are increasingly difficult to disperse isotropically as the aspect ratio, , increases. One way
to maximize the probability of isotropic dispersion is to modify the surface of the nanosale
filler to increase favorable interactions with polymer matrix and minimize inter-filler
interactions, which also plays an important role in the efficiency of stress across the
nanofiller/polymer interface.
Detonation nanodiamonds (NDs) were first synthesized by Russian scientists through
the process of explosion-induced decomposition of highly explosive mixtures with a negative
oxygen balance in a nonoxidizing atmosphere[12]. Research on the synthesis and
applications of diamond nanoparticles has continued to the present. Nanodiamonds combine
nano-dimensions (4-6 nm), chemical stability of their core and potential for chemical
reactivity of their peripheral shell. The extremely hard core makes them an attractive additive
to toughen polymers, and the chemical reactivity of the peripheral shell promotes the
formation of cross-links to polymer chains during nanocomposite curing[12, 13, 42, 46].
These superior intrinsic properties make NDs particularly attractive for the fabrication of
structural polymers results in an increase in mechanical strength, wear-resistance, and
head-aging resistance [12-14, 41, 42]. Highly effective coatings based on the incorporation of NDs
in fluoroelastomers and polysiloxanes have been developed, and the elastic modulus and
strength of rubbers based on poly-isoprene, butadiene-styrene, butadiene-nitrile, as well as
natural rubbers, have been considerably improved[12, 13, 42]. Though remarkable efforts
have been paid to polymer nanocomposites, and nanodiamonds are widely used in many
fields, the research on diamond-filled polymer composites is still very limited [12, 13, 41, 42,
47].
Experimentally, it is challenging to make good samples of nanoparticles and polymer
composites because of the chemical activity of nano-scale particles. A variety of methods[43,
48-52] have been tried to prepare nano-scale particles and to make polymer matrix
nanocomposites. These include inert gas condensation, chemical vapor deposition, ball
milling, sol-gel, and flame spraying. No universal technique for making polymer
nanocomposites is available because of the physical and chemical differences between
systems and equipment available to researchers. Each polymer system needs a special set of
processing conditions, which are usually demanding and expensive, based on desired
properties. In addition, current theories usually cannot correlate the experimental results with
thermal and mechanics properties of nanocomposite systems. To this end, computer
simulation, which allows for parametric studies of the influence of filler on material
properties, has become a powerful tool to facilitate the development of nanocomposites. In
methods[35], and coarse graining models[55] have been applied successfully to study
nanostructures. Especially for large systems with hundreds of atoms to millions of atoms or
more, molecular dynamics is a powerful tool to understand the properties of
polymer-nanoparticle composites at the atomic level, which greatly enhances the understanding
realized from experiments.
In several earlier works, ab-initio[10], density-functional theory (DFT)[11, 27, 56],
and Monte Carlo methods[57] have been successfully applied to predict the thermal stability
of nanodiamonds (NDs), such as nanowires, bucky-diamonds, carbon-onions, and
fullerences, in various size regimes. This work has been further extended in our study to
include four classes of nanodiamonds with different surface orientations and the size
dependent thermal stability of cuboctahedral ND with a second-generation reactive empirical
bond order (REBO) potential. The glass transition and strain-stress properties of
nanocomposites containing polyethylene and the stable nanodiamonds were further studied.
Glass transition phenomena in composites have been of paramount interest to polymer
scientists[58-65]. However, no simulations have been performed to date on the composites
containing polyhedral nanoparticles. Furthermore, the effects of polyhedral surfaces on the
distribution of free volume and the behavior of nanoparticles during the glass transition have
not been explored in previous simulation studies. In our study, we performed a series of
molecular dynamics (MD) simulations in which samples with different polymer chain
lengths and nanoparticle densities were cooled through under atmospheric pressure to
volume and particle movement. Mechanical properties are another interesting aspect of the
new materials to polymer scientists[39, 44, 55, 66-70]. We computed stress-strain curves for
a series of nanocomposites with different polymer chain lengths and nanoparticle densities
conical (NPT) ensembles.
The remainder of this dissertation is organized as follows: In Chapter 2, we give a
discussion of the second generation Reactive Empirical Bond Order (REBO) potential,
molecular dynamics (MD) simulation, a description of algorithms used in our computation,
and a description of free volume and local stress calculations. This background will be
helpful to understand the following chapters. In Chapter 3, the heats of formation for
octahedral, cuboctahedral and their sub-series with partially or fully restricted surfacse are
investigated using second-generation REBO potentials[71]. In addition to cuboctahedral and
octahedral clusters, the relative thermal stability of spherical particles and pentaparticles is
also explored. To extend our studies on diamond clusters, the heats of formation for six
different morphologies of diamond nanorods were examined. These simulations revealed the
size dependent thermal stability of the carbon clusters. In Chapter 4, the heats of formation
for nanorods with different principle axes and surface orientations are investigated using the
second-generation REBO potential[71]. These simulations explored the size dependent
thermal stability of six series of nanorods. In Chapter 5, glass transitions of polyethylene and
corresponding nanocomposites containing cuboctahedral nanodiamonds with or without
crosslinks at the interface are investigated. We also explore the distribution of free volume,
cooling the samples through the glass transition temperature under isobaric conditions.
Four groups of samples with different chain lengths and ND densities are examined. These
simulations showe the effect of nanoparticle, chain length and crosslinks on glass transition
temperatures. In Chapter 6, NPT ensembles were used to investigate the stress-strain
behavior of four groups of samples with different ND densities and polyethylene chain
lengths within an NPT ensemble at 100 K and 300 K, respectively. Local stress and strain
distributions were also calculated during the molecular dynamics under an applied
uni-directional tensile strain. These simulations showed the effect of nanodiamond and the
1.3 REFERENCES
1. Lewis, R.S., E. Anders, and B.T. Draine, PROPERTIES, DETECTABILITY AND ORIGIN OF INTERSTELLAR DIAMONDS IN METEORITES. Nature, 1989.
339(6220): p. 117-121.
2. Lewis, R.S., et al., INTERSTELLAR DIAMONDS IN METEORITES. Nature, 1987.
326(6109): p. 160-162.
3. Daulton, T.L., et al., Genesis of presolar diamonds: Comparative high-resolution transmission electron microscopy study of meteoritic and terrestrial nano-diamonds. Geochimica Et Cosmochimica Acta, 1996. 60(23): p. 4853-4872.
4. Hill, H.G.M., A.P. Jones, and L.B. d'Hendecourt, Diamonds in carbon-rich proto-planetary nebulae. Astronomy & Astrophysics, 1998. 336(3): p. L41-L44.
5. Volkov, K.V., V.V. Danilenko, and V.I. Elin, SYNTHESIS OF DIAMOND FROM THE CARBON IN THE DETONATION PRODUCTS OF EXPLOSIVES. Combustion Explosion and Shock Waves, 1990. 26(3): p. 366-368.
6. Jiao, S., et al., Microstructure of ultrananocrystalline diamond films grown by microwave Ar-CH4 plasma chemical vapor deposition with or without added H-2. Journal of Applied Physics, 2001. 90(1): p. 118-122.
7. Kuznetsov, V.L., et al., Theoretical study of the formation of closed curved graphite-like structures during annealing of diamond surface. Journal of Applied Physics, 1999. 86(2): p. 863-870.
8. Baidakova, M.V., V.I. Siklitsky, and A.Y. Vul, Ultradisperse-diamond nanoclusters. Fractal structure and diamond-graphite phase transition. Chaos Solitons & Fractals, 1999. 10(12): p. 2153-2163.
9. Baidakova, M.V., et al., Fractal structure of ultradisperse-diamond clusters. Physics of the Solid State, 1998. 40(4): p. 715-718.
10. Barnard, A.S., S.P. Russo, and I.K. Snook, Ab initio modelling of the stability of nanocrystalline diamond morphologies. Philosophical Magazine Letters, 2003. 83(1): p. 39-45.
11. Barnard, A.S., S.P. Russo, and I.K. Snook, First Principles Investigations of
12. Dolmatov, V.Y., Polymer-diamond composites from detonation-derived nanodiamonds. Part 1. Sverkhtverdye Materialy, 2007. 1: p. 15.
13. Dolmatov, V.Y., Polymer-diamond composites based on detonation nanodiamonds. Part 2. Sverkhtverdye Materialy, 2007. 2: p. 15.
14. Zhang, Q., et al., Polyimide/Diamond nanocomposites: Microstructure and indentation Behavior. Macromolecular Rapid Communications, 2007. 28(21): p. 2069-2073.
15. Roy, R.R., Biomedical applications of diamond-like carbon coatings: a review. Journal of biomedical materials research. Part B, Applied biomaterials, 2007. 83B(1): p. 72.
16. Okotrub, A.V., et al., Field emission from products of nanodiamond annealing. Carbon, 2004. 42(5-6): p. 1099-1102.
17. Williams, O.A., Ultrananocrystalline diamond for electronic applications. Semiconductor Science and Technology, 2006. 21(8): p. R49-R56.
18. Lee, Y.C., et al., Synthesis and electron field emission properties of nanodiamond films. Diamond and Related Materials, 2004. 13(11-12): p. 2100-2104.
19. Baik, E.S., Y.J. Baik, and D. Jeon, Aligned diamond nanowhiskers. Journal of Materials Research, 2000. 15(4): p. 923-926.
20. Zhang, W.J., et al., Structuring nanodiamond cone arrays for improved field emission. Applied Physics Letters, 2003. 83(16): p. 3365-3367.
21. Yanagishita, T., et al., Synthesis of diamond cylinders with triangular and square cross sections using anodic porous alumina templates. Chemistry Letters, 2002(10): p. 976-977.
22. Masuda, H., et al., Synthesis of well-aligned diamond nanocylinders. Advanced Materials, 2001. 13(4): p. 247-+.
23. Kobashi, K., et al., Fibrous structures on diamond and carbon surfaces formed by hydrogen plasma under direct current bias and field electron-emission properties. Journal of Materials Research, 2003. 18(2): p. 305-326.
24. Chih, Y.K., et al., Formation of nano-scale tubular structure of single crystal diamond. Diamond and Related Materials, 2004. 13(9): p. 1614-1617.
26. Shenderova, O.A., V.V. Zhirnov, and D.W. Brenner, Carbon nanostructures. Critical Reviews in Solid State and Materials Sciences, 2002. 27(3-4): p. 227-356.
27. Barnard, A.S., Structural properties of diamond nanowires: Theoretical predictions and experimental progress. Reviews on Advanced Materials Science, 2004. 6(2): p. 94-119.
28. Dubrovinskaia, N., S. Dub, and L. Dubrovinsky, Superior wear resistance of aggregated diamond nanorods. Nano Letters, 2006. 6(4): p. 824-826.
29. Shenderova, O.A., D.M. Gruen, and Knovel. Ultrananocrystalline diamond synthesis, properties, and applications. 2006.
30. Powell, C.E. and G.W. Beall, Physical properties of polymer/clay nanocomposites. Current Opinion in Solid State & Materials Science, 2006. 10(2): p. 73-80.
31. Schneider, J.P., et al., BIOFIBRES AS REINFORCING FILLERS IN
THERMOPLASTIC COMPOSITES. Engineering Plastics, 1995. 8(3): p. 207-222.
32. Kawasumi, M., The discovery of polymer-clay hybrids. Journal of Polymer Science Part a-Polymer Chemistry, 2004. 42(4): p. 819-824.
33. Andrews, R. and M.C. Weisenberger, Carbon nanotube polymer composites. Current Opinion in Solid State & Materials Science, 2004. 8(1): p. 31-37.
34. Dondero, W.E. and R.E. Gorga, Morphological and mechanical properties of carbon nanotube/polymer composites via melt compounding. Journal of Polymer Science Part B-Polymer Physics, 2006. 44(5): p. 864-878.
35. Frankland, S.J.V., et al., The stress-strain behavior of polymer-nanotube composites from molecular dynamics simulation. Composites Science and Technology, 2003.
63(11): p. 1655-1661.
36. Haggenmueller, R., et al., Aligned single-wall carbon nanotubes in composites by melt processing methods. Chemical Physics Letters, 2000. 330(3-4): p. 219-225.
37. Shenderova, O., D. Brenner, and R.S. Ruoff, Would diamond nanorods be stronger than fullerene nanotubes? Nano Letters, 2003. 3(6): p. 805-809.
38. Wei, C.Y., D. Srivastava, and K.J. Cho, Thermal expansion and diffusion coefficients of carbon nanotube-polymer composites. Nano Letters, 2002. 2(6): p. 647-650.
40. Yu, M.F., et al., Strength and breaking mechanism of multiwalled carbon nanotubes under tensile load. Science, 2000. 287(5453): p. 637-640.
41. Shenderova, O., et al., Nanodiamond and onion-like carbon polymer nanocomposites. Diamond and Related Materials, 2007. 16(4-7): p. 1213-1217.
42. Dolmatov, V.Y., Polymer-diamond composites based on detonation nanodiamonds. Report 3. Sverkhtverdye Materialy, 2007. 4: p. 10.
43. Chan, C.M., et al., Polypropylene/calcium carbonate nanocomposites. Polymer, 2002.
43(10): p. 2981-2992.
44. Yang, K., et al., Morphology and mechanical properties of polypropylene/calcium carbonate nanocomposites. Materials Letters, 2006. 60(6): p. 805-809.
45. Jordan, J., et al., Experimental trends in polymer nanocomposites - a review.
Materials Science and Engineering a-Structural Materials Properties Microstructure and Processing, 2005. 393(1-2): p. 1-11.
46. Hu, Y.H., et al., Carbon nanostructures for advanced composites. Reports on Progress in Physics, 2006. 69(6): p. 1847-1895.
47. d'Almeida, J.R.M., et al., Diamond-epoxy composites. Journal of Reinforced Plastics and Composites, 2007. 26(3): p. 321-330.
48. Vollenberg, P.H.T. and D. Heikens, PARTICLE-SIZE DEPENDENCE OF THE YOUNG MODULUS OF FILLED POLYMERS .1. PRELIMINARY EXPERIMENTS. Polymer, 1989. 30(9): p. 1656-1662.
49. Petrovic, Z.S., et al., Structure and properties of polyurethane-silica nanocomposites. Journal of applied polymer science, 2000. 76(2): p. 133-151.
50. Rong, M.Z., et al., Structure-property relationships of irradiation grafted nano-inorganic particle filled polypropylene composites. Polymer, 2001. 42(1): p. 167-183.
51. Yang, F., Y.C. Ou, and Z.Z. Yu, Polyamide 6 silica nanocomposites prepared by in situ polymerization. Journal of applied polymer science, 1998. 69(2): p. 355-361.
52. Ou, Y., F. Yang, and Z. Yu, A New Conception on the Toughness of Nylon 6/Silica Nanocomposite Prepared via In Situ Polymerization. Journal of Polymer Science Part B-Polymer Physics, 1998. 36: p. 7.
53. Robertson, D.H., D.W. Brenner, and J.W. Mintmire, ENERGETICS OF
12592-54. Hernandez, E., et al., Elastic properties of C and BxCyNz composite nanotubes. Physical Review Letters, 1998. 80(20): p. 4502-4505.
55. Oberdisse, J., et al., Mechanical properties of end-crosslinked entangled polymer networks using sliplink Brownian dynamics simulations. Rheologica Acta, 2006.
46(1): p. 95-109.
56. Barnard, A.S., S.P. Russo, and I.K. Snook, Size dependent phase stability of carbon nanoparticles: Nanodiamond versus fullerenes. Journal of Chemical Physics, 2003.
118(11): p. 5094-5097.
57. Barnard, A.S., et al., A Monte Carlo Study of Surface Reconstruction in (100) and (111) Diamond Surfaces and Nanodiamond. Molecular Simulation, 2004. 30(1): p. 1-8.
58. Ash, B.J., L.S. Schadler, and R.W. Siegel, Glass transition behavior of
alumina/polymethylmethacrylate nanocomposites. Materials Letters, 2002. 55(1-2): p. 83-87.
59. Colucci, D.M., et al., Isochoric and isobaric glass formation: Similarities and differences. Journal of Polymer Science Part B-Polymer Physics, 1997. 35(10): p. 1561-1573.
60. Fried, J.R. and P. Ren, Molecular simulation of the glass transition of
polyphosphazenes. Computational and Theoretical Polymer Science, 1999. 9(2): p. 111-116.
61. Liang, T.N., et al., Conformational transition behavior around glass transition temperature. Journal of Chemical Physics, 2000. 112(4): p. 2016-2020.
62. Rigby, D. and R.J. Roe, MOLECULAR-DYNAMICS SIMULATION OF POLYMER
LIQUID AND GLASS .1. GLASS-TRANSITION. Journal of Chemical Physics, 1987.
87(12): p. 7285-7292.
63. Soldera, A., Comparison between the glass transition temperatures of the two PMMA tacticities: A molecular dynamics simulation point of view. Macromolecular
Symposia, 1998. 133: p. 21-32.
64. Sun, Y.Y., et al., Glass transition and relaxation behavior of epoxy nanocomposites. Journal of Polymer Science Part B-Polymer Physics, 2004. 42(21): p. 3849-3858.
66. Akovali, G. and M.A. Akman, Mechanical properties of plasma surface-modified calcium carbonate-polypropylene composites. Polymer International, 1997. 42(2): p. 195-202.
67. Crosby, A.J. and J.Y. Lee, Polymer nanocomposites: The "nano" effect on mechanical properties. Polymer Reviews, 2007. 47(2): p. 217-229.
68. Demczyk, B.G., et al., Direct mechanical measurement of the tensile strength and elastic modulus of multiwalled carbon nanotubes. Materials Science and Engineering a-Structural Materials Properties Microstructure and Processing, 2002. 334(1-2): p. 173-178.
69. Unal, H., A. Mimaroglu, and M. Alkan, Mechanical properties and morphology of nylon-6 hybrid composites. Polymer International, 2004. 53(1): p. 56-60.
70. Williams, M.L., R.F. Landel, and J.D. Ferry, MECHANICAL PROPERTIES OF SUBSTANCES OF HIGH MOLECULAR WEIGHT .19. THE TEMPERATURE DEPENDENCE OF RELAXATION MECHANISMS IN AMORPHOUS POLYMERS AND OTHER GLASS-FORMING LIQUIDS. Journal of the American Chemical Society, 1955. 77(14): p. 3701-3707.
CHAPTER 2.
COMPUTATIONAL METHODS
2.1 REACTIVE EMPIRICAL BOND-ORDER (REBO) POTENTIAL
Abell[1] firstly introduced the general analytic bond-order potential energy formalism,
which states that the chemical binding energy can be simply expressed as a sum over
nearest neighbors:
(2.1.1)
The function and are pair-additive terms that describe the interatomic
repulsions and attractions, respectively. The term is bond-order term between atoms and
. A practical implementation of Abell’s bond-order formalism was first developed by
Tersoff for group IV elements[2, 3]. By introducing analytic parameterized forms for the
bond order term, the Tersoff potential can accurately treat silicon, germanium and their alloys,
but is less reliable for carbon[4, 5].
Carbon is unique in that it forms a variety of different types of C-C bonds with
different bond lengths and energies, which results in a large variety of polymorphic forms,
such as graphite, nanotubes, fullerenes, diamond and various amorphous phases[6]. The
Tersoff potential cannot deal properly with the processes involving a change of bonding
characteristics, such as surface reconstruction and chemical reactions, because it doesn’t
Brenner[7], under the name reactive empirical bond-order (REBO) potential, to describe
solid-state carbon and hydrocarbon molecules. In this potential, non-local terms, which
properly account for the chemical bonding changes according to the local environments, are
added to the Tersoff potential. Consequently, the REBO potential allows for bond formation
and breaking with appropriate changes in atomic hybridization, which is extremely important
for the realistic treatment of such processes as chemical reactions. However, in the first
generation REBO potential, the terms describing the pair interaction in Eqn (2.1.1)
effectively describe equilibrium distances, bond energies, and force constants simultaneously.
Therefore, the second-generation REBO potential, using improved analytic function and
fitting more experimental/first principle data, was developed[8]. The forces associated with
rotation about dihedral angles for carbon-carbon double bonds, as well as angular
interactions associated with hydrogen centers, have also been included. In our study, the
second generation REBO potential[8] is used.
The analytic terms describing the pair interactions in (2.1.1) in the second-generation
REBO potential are written as
(2.1.2)
(2.1.3)
The repulsive term (Eqn (2.1.2)) goes to infinity as the interatomic distance approaches
simultaneously. The variables , , , , and are parameters fit to experimental or ab
initio data for both hydrocarbon molecules and solid-state carbon with a standard fitting
routine. The function limits the range of the covalent interactions, for example, the
value of for carbon-carbon interactions will be one for nearest neighbors and zero for
all other interatomic distances.
In the second-generation REBO potential, the bond-order term is written as
(2.1.4)
where the values of and depend on the local coordination and bond angle between
atoms and , and the values of is evaluated using the formula
(2.1.5)
where the value of the first term depends on whether a bond between atoms and has
radical character and is part of a conjugated system, and the value of the second term
depends on the dihedral angle for carbon-carbon double bonds.
This revised second-generation REBO potential accurately reflects the bond energies, bond
length and force constant for carbon-carbon bonds with a single expression (Eqn (2.1.1)). It
also improves the fit to radical energies, conjugated bonding properties, and diamond
surface properties and gives a reasonable description of diamond, graphite, and hybrid
Lennard-Jones (LJ) 6-12 potential is introduced into Eqn (2.1.1). Thus the combined
expression to evaluate the binding energy of the whole system is
(2.1.6)
where is the contribution from the van der Waals interactions, which are expressed as
(2.1.7)
where and are Lennard-Jones parameters [10].
2.2 MOLECULAR DYNAMICS
Molecular dynamics simulations consist of the numerical, step by step solution of the
classical equations of motion governed by the Newton’s second law, which states that in
order to make a body of mass undergo an acceleration , a force is required that is
equal to the product of the mass times the acceleration:
(2.2.1)
This equation can also be expressed in term of the position of the body as
(2.2.2)
This is the basis of molecular dynamics (MD). Knowing the force, , on each body based
on the Eqn (2.2.2), we can then study the trajectory of each body in space and investigate the
time-dependent properties. The key point is to calculate the force acting on each body,
according to the conservation of energy, which states that the sum of the kinetic energy
( ) and the potential energy ( ) is constant ( ) for certain system, this is
(2.2.3)
By differentiating both sides of Eqn (2.2.3) with respect to time, we can get
(2.2.4)
Comparing the Eqn (2.2.4) with the Newton’s second law (Eqn (2.2.1)). It is easy to know
the force can be calculated from the potential energy
(2.2.5)
The potential energy can be calculated using an empirical potential, a semi-empirical
potential or first-principle approaches.
The potential energy in the molecular dynamics can be calculated using empirical
potentials derived from experimental data or first-principle approaches. The calculations of
potential energy and force are the most time consuming part in the MD simulation. Once the
forces are obtained, Eqn (2.2.2) can be integrated to follow the time evolution of the atoms
In practice, the equations of motions for all the atoms should be solved numerically
since there is no analytical solution available. There are several numerical methods to
integrate Newton’s equations, including the Verlet algorithm, the Verlet Leapfrog (LF)
algorithm, and the predictor-corrector algorithm[11]. In our MD simulation, the Verlet
Leapfrog integration algorithm, which is time reversible, simple and generates trajectories in
the microcanomical (NVE) ensemble having conserved total energy, is applied. The LF
algorithm requires values of position and force as the time, while the velocities are half a
timestep behind. The first step is to advance the velocities by integration of the force:
(2.2.6)
where is the mass of an atom and is the timestep.
The positions are then advanced using the new velocities:
(2.2.7)
Molecular dynamics normally requires properties that depend on position and velocity at the
same time (such as the sum of potential and kinetic energy). In the LF algorithm the velocity
at time is obtained from the average of the velocities half a timestep either side of time :
(2.2.8)
least two reasons for this. One is due to the high frequency motion of the atoms (for example,
the time scale of atomic vibration is typically ~ s). In order to capture atomic motion as
accurately as MD simulations desire to do, the timestep must be much smaller than the
time-scale of the atomic motions. The second reason is that, from the integration point of view, a
small is necessary to achieve the predictions calculated in LF algorithm as accurately as
possible. Usually, a timestep on the order of a femtosecond ( s) is used. Unfortunately,
such short a timestep precludes the modeling of processes that occur on time-scale larger
than a few nanoseconds with present-day computational power.
The instantaneous kinetic temperature in the molecular dynamics simulations can be
calculated from the atomic velocities if the system has no net momentum:
(2.2.9)
where is Boltzmann’s constant and is the number of degrees of freedom in the system.
It is impossible to track the kinetic temperature of a system to the set temperature exactly in
molecular dynamics. Various types of thermostat methods, such as Berendsen[12],
Langevin[13] and Nose-Hoover[14-16], have been introduced to control the atomic motions.
The Langevin thermostats[13] follow the Langevin equation of motion instead of Newton's
equation of motion. In the Langevin equation of motion, a frictional force added to the
conservative force is proportional to the velocity, and it adjusts the kinetic energy of the
particle so that the temperature matches the set temperature. Nosé-Hoover thermostat[14-16]
into the Hamiltonian of a system. The Berendsen thermostat[12] was used in the simulations
discussed below. The Berendsen thermostat[12] maintains the simulation temperature close
to the set temperature, , by re-scaling the velocities of the atoms at each step:
(2.2.10)
where is the thermostat relaxation time. LF algorithm implements this thermostat as
follows.
(2.2.11)
Tracking the system pressure to the set pressure or stress is even harder in molecular
dynamics. The pressure tensor can be calculated using Clausius virial theorem as
(2.2.12)
with the box volume , the kinetic energy and the inner virial tensor
(2.2.13)
Correcting the pressure in a simulation can be achieved through a change in the inner virial
by scaling the inter-particle distances. This correction usually takes several iterations to
first barostat was developed by Andersen[17] to adjust the pressure in a simulation of
interacting particles. Parinello and Rahman[18] later extended Anderson’s method to allow
the simulation box to change in shape. This method was further developed by Hoover, which
is known as a Hoover barostat. Another approach is the Berendsen barostat, which is used in
our studies. In the Berendsen method[12], the system is weakly coupled to an external bath
using the principle of least local perturbation. Simular to the temperature coupling, an extra
term is added to the equations of motions that effects a pressure change
(2.2.14)
where is the time constant for the coupling. A simple proportional coordinate scaling,
concomitant with volume scaling, minimizes local disturbances. For anisotropic cell variation,
a tensor is defined by
(2.2.15)
where is a specified constant. In our simulation, it is taken to be the isothermal
compressibility of liquid water. The new position for each atom is given by
2.3 LOCAL STRESS ANALYSIS
The local stress analysis was introduced to obtain the stress information associated
with each atom. The local stress calculation during the molecular dynamics in our study is
based on the unpublished paper by Falk[19]. The derivation of the stress tensor was based on
the microscopic momentum field. The final expression in most treatments of the stress tensor
for the purpose of MD is
(2.3.1)
where the term is an integration constant which must defined to insure that the
expression is translationally and rotationally invariant, represents the point of interested,
, and are the momentum, position and mass of the atom , and
denote the distance and force vector between atoms and .
To evaluate the average local stress over a region, we need to sum the local stress (Eqn
(2.3.1)) of atoms and coarse-grain it over the region. According to the Hardy[20] rules, the
kinetic contribution (first term in Eqn (2.3.1)) of local stress over a uniform symmetrical
region of radius can be expressed as
where represents the total mass in spatial region of radius . By applying
the same rules, the potential contribution (second term in Eqn (2.3.1)) of local stress can be
expressed as
(2.3.3)
(2.3.4)
(2.3.5)
where is the envelope function, is the heavy-side step function and is the
volume inside of radius . In our study, we consider the uniform envelope function
which has a value equal to a weighted contribution proportional to the fraction of the bond
that falls inside the area (dark portion of each bond in Figure 2.1).
2.4 REFERENCES
1. Abell, G.C., EMPIRICAL CHEMICAL PSEUDOPOTENTIAL THEORY OF
MOLECULAR AND METALLIC BONDING. Physical Review B, 1985. 31(10): p. 6184-6196.
2. Tersoff, J., EMPIRICAL INTERATOMIC POTENTIAL FOR SILICON WITH IMPROVED ELASTIC PROPERTIES. Physical Review B, 1988. 38(14): p. 9902-9905.
3. Tersoff, J., EMPIRICAL INTERATOMIC POTENTIAL FOR CARBON, WITH
APPLICATIONS TO AMORPHOUS-CARBON. Physical Review Letters, 1988.
61(25): p. 2879-2882.
4. Petukhov, A.V. and A. Fasolino, Reconstructions of diamond (100) and (111) surfaces: Accuracy of the Brenner potential. Physica Status Solidi a-Applied Research, 2000. 181(1): p. 109-114.
5. Petukhov, A.V., et al., (Meta)stable reconstructions of the diamond (111) surface: Interplay between diamond and graphitelike bonding. Physical Review B, 2000.
61(16): p. 10590-10593.
6. Shenderova, O.A., D.M. Gruen, and Knovel. Ultrananocrystalline diamond synthesis, properties, and applications. 2006.
7. Brenner, D.W., ATOMISTIC COMPUTER-SIMULATIONS OF THE REACTIVE
DYNAMICS OF DIAMOND SURFACES. Carbon, 1990. 28(6): p. 769-770.
8. Brenner, D.W., et al., A second-generation reactive empirical bond order (REBO) potential energy expression for hydrocarbons. Journal of Physics-Condensed Matter, 2002. 14(4): p. 783-802.
9. Brenner, D.W., et al., Atomic modeling of carbon-based nanostructures as a tool for developing new materials and technologies. Cmes-Computer Modeling in
Engineering & Sciences, 2002. 3(5): p. 643-673.
10. Allen, M.P. and D.J. Tildesley, Computer simulation of liquids. 1987, Oxford [England]; New York: Clarendon Press ; Oxford University Press.
12. Berendsen, H.J.C., et al., MOLECULAR-DYNAMICS WITH COUPLING TO AN EXTERNAL BATH. Journal of Chemical Physics, 1984. 81(8): p. 3684-3690.
13. Adelman, S.A. and J.D. Doll, GENERALIZED LANGEVIN EQUATION APPROACH FOR ATOM-SOLID-SURFACE SCATTERING - GENERAL FORMULATION FOR CLASSICAL SCATTERING OFF HARMONIC SOLIDS. Journal of Chemical Physics, 1976. 64(6): p. 2375-2388.
14. Nose, S., A MOLECULAR-DYNAMICS METHOD FOR SIMULATIONS IN THE
CANONICAL ENSEMBLE. Molecular Physics, 1984. 52(2): p. 255-268.
15. Nose, S., A UNIFIED FORMULATION OF THE CONSTANT TEMPERATURE
MOLECULAR-DYNAMICS METHODS. Journal of Chemical Physics, 1984. 81(1): p. 511-519.
16. Hoover, W.G., CANONICAL DYNAMICS - EQUILIBRIUM PHASE-SPACE
DISTRIBUTIONS. Physical Review A, 1985. 31(3): p. 1695-1697.
17. Andersen, H.C., MOLECULAR-DYNAMICS SIMULATIONS AT CONSTANT
PRESSURE AND-OR TEMPERATURE. Journal of Chemical Physics, 1980. 72(4): p. 2384-2393.
18. Parrinello, M. and A. Rahman, CRYSTAL-STRUCTURE AND PAIR POTENTIALS - A MOLECULAR-DYNAMICS STUDY. Physical Review Letters, 1980. 45(14): p. 1196-1199.
19. Falk, M., Local stress calculations in molecular dynamics. 1999, Harvard University: Cambridge. p. 8.
20. Hardy, R.J., FORMULAS FOR DETERMINING LOCAL PROPERTIES IN
CHAPTER 3.
STABILITY OF NANODIAMONDS
3.1 INTRODUCTION
For decades, it has been known that graphite is the most stable form in the carbon
family at atmospheric pressure, and that diamond, while harder, denser, and more durable,
was merely metastable. With the discovery of fullerenes, nanotubes, nanorods, and
nanocrystalline diamond by means of detonation synthesis, the door was opened for a new
era in carbon science. Many studies were carried out to understand the formation of carbon
clusters, and the dynamic phase changes and stability between graphite and nanocrystalline
diamond (nanodiamond (ND)) clusters. Barnard[1, 2] explored the relative stability of
nanocrystalline diamonds, fullerenes, onions and graphite at the nanoscale and defined size
regions and found that the most stable carbon form at the nanoscale progresses from fullerene
→ onions → bucky diamond → nanodiamond → graphite as the system size for all
carbon-carbon structures is increased. Fugaciu et al[3] simulated the transition of nanocrystalline
diamond to carbon onions using density-functional-theory (DFT) based tight-binding (TB)
methods. This transformation of nanodiamond to carbon-onions has also been observed
experimentally[3, 4] with a transformation temperature that is dependent on the size of the
particle. Barnard et al[1] showed that the stability, characterized by the variation in these
structural properties from that of bulk diamond, was dependent on both the surface
studies have motivated a number of researchers to re-examine the phase stability of diamond
at the nanometer scale.
In our studies, atomistic simulations were performed using the REBO potential[4] to
calculate formation energies and preferred morphologies of hydrogenated nanodiamonds.
3.1.1 NANODIAMOND APPLICATION
Because of its extreme hardness, outstanding wear resistance, wide optical
transparency, and other unique properties, nanodiamond has been used widely in many fields.
The remarkable mechanical properties of NDs suggest immediately their application in
abrasive materials or components of coatings[5-7]. The rich surface chemistry of NDs, the
absence of toxic impurities and their small size make nanodiamonds very convenient for
biomedical applications. By creating specific sites on NDs for selective molecular attachment,
nanodiamond can be used for example in nanofabrication, self assembly, nanosensors,
bioprobes, drug delivery, and pigments[8]. The typical diameter of NDs is about 5 nm, and
about 10% of carbon atoms are at the surface. NDs can have significant bonding which
gives rise to unique electronic and magnetic features due to the lower energy gap of
transitions relative to transitions. The investigation of field electrons from ND-based
structures [9-11] has shown their potential for electrochemical electrodes and field emission
structure, where high conductivities are required[10].
3.1.2 CHARACTERIZATION AND STRUCTURE OF NANODIAMONDS
meteorites, crystalline grains in polycrystalline diamond films and nanodiamond powders
and suspensions prepared by detonation synthesis. Nanodiamonds usually are produced by
chemical treatment of diamond-containing mixtures, which are synthesized at high pressure
and high temperature with a shock wave during detonation of carbon-containing explosives
with a negative oxygen balance. More details on the synthesis and processing of ND can be
found in [12]. The NDs produced by means of detonation are complex materials that have at
least a three-layer structure[5]:
- A diamond core with a characteristic size of about 5 nm[13-15];
- An intermediate carbon shell around the core, which is comprised of an
amorphous carbon structure with a thickness of 0.4 – 1.0 nm containing 10-30%
carbon atoms;
- A surface layer which contains, in addition to carbon atoms, other heteroatoms (N,
H, O) forming a great variety of functional groups.
3.2 STABILITY OF NANODIAMONDS
Until recently, most of the experimental work described the shape of detonation
nanodiamond as being spherical based on the transmission electron microscopy (TEM)
images. Part of the reason is that the surface of nanodiamond is usually graphitic because of
its high surface energy associated with unterminated sp3 bonds as demonstrated in Figure 3.1.
the cuboctahedral morphology C66 (left structure in Figure 3.1) using a semi-empirical
potential PM3. However, high-resolution TEM (HRTEM) studies revealed that ND particles
rarely have a spherical shape[16, 17]. The controlled annealing of ND at temperatures of
1150-2140 K with simultaneous imaging by HRTEM also showed the transformation of the
surface of NDs from carbon sp2/sp3 nanocomposites, onion-like carbon (OLC) to hollow
graphite polyhedrons[18]. HRTEM micrographs of original ND particles of different sizes
and shapes can also be found in [17]. These clusters consisted typically of regularly shaped
cubooctahedral and twinned crystals.
The size distribution of nanodiamond is 4-6 nm which was reported more than
once[13-15]. The reason for this lies in that nanodiamond and not graphite is the most
thermodynamically stable form of nanocarbon cluster. This view is also supported by the
results from computer simulation of the stability of carbon clusters[1, 13, 19]. In this study,
this work was extended to include three hydrogenated morphologies of nanodiamond clusters.
The calculation of formation energies and preferred morphologies was performed using
atomic simulations with the second-generation REBO potential interaction for
hydrocarbons[4].
The three hydrogenated morphologies of nanodiamond clusters considered in our
studies are octahedral, cuboctahedral and spherical as shown in Figure 3.2. However, the sp2
on the (100) surface of nanodiamond usually forms single/double bonded dimers, as
illustrated in Figure 3.3, via surface reconstruction[20]. Therefore, a (001)2x1 reconstructed
For the analysis of particle energies, surface reconstructions, and interactions with
specific functional groups, it is good to know the dependence of the number of
under-coordinated surface atoms on particle size. After examining the structure of octahedral
nanodiamond, a ‘nanodiamond formula’ for octahedral particles was derived:
(3.2.1)
where is the number of atoms along an octahedral edge, and and are the number
of 2- and 3-coordinated atoms, respectively. By truncating the six vertices of octahedral
nanodiamond, a cubo-octahedral nanodiamond is formed. However, the formulas are
different for odd and even.
(3.2.2)
where is the number of atoms along the edge of a corresponding octahedral structure.
Unfortunately, there is no such formula for spherical NDs. Statistics on under-coordinated
atoms for a series of spherical nanodiamond, obtained from atomistic modeling, are
illustrated in Figure 3.4.
In NDs with diameters less than 5 nm, close to 20% of the total number of atoms are