ABSTRACT
WOOD, ELIZABETH RACHEL. Clonal Variation of Stem Taper in Loblolly Pine (Pinus taeda L.). (Under the direction of Dr. Bronson P. Bullock.)
As volume is the primary measure of value in loblolly pine (Pinus taeda L.) stands, knowledge about the stem taper of commonly deployed clones may help breeders better describe genetic gains made by clonal selection and can provide more accurate volume estimates. This study assessed the genetic variation of stem taper among clones propagated by somatic embryogenesis (SE) and compared growth traits of SE clones and seedlings from the same full-sibling families.
SE clones from fifteen full-sibling families were measured in the eighth growing season across three test sites in coastal Georgia and South Carolina. Variance components and genetic parameters for taper and growth traits were estimated using restricted maximum likelihood (REML) techniques. Ten form quotients were used to analyze stem taper
differences among clones and to assess taper impacts on total stem volume. Significant clonal and family variation was found among clones and families for form quotients, indicating that differences exist in stem taper among different genotypes.
Variation among clones accounted for 3.4% to 26% of the total phenotypic variance for taper and growth traits. Clone mean heritability estimates for form quotients and growth traits were moderate to very high (0.60 to 0.94), indicative of substantial genetic variability for these stem form characteristics.
While considerable genetic variation exists for stem taper among clones, the impacts of taper differences in the lower portion of the stem (below 12.5 feet) on total volume were small after accounting for total height and diameter at breast height. As long as volume remains the primary measure of value in loblolly pine, additional measures of taper beyond height and diameter at breast height are not necessary to describe differences in total volume among these particular SE clones.
Though seedlings outperformed clones overall and within most families based on means, selection of the top performing clone was effective in achieving gains for growth traits in some families. Superior SE varieties demonstrated higher clone means for total height and total volume compared to the full-sib family mean of their seedling counterparts. In other families, however, seedlings outperformed the best clone mean within the respective family.
Clonal Variation of Stem Taper in Loblolly Pine (Pinus taeda L.)
by
Elizabeth Rachel Wood
A thesis submitted to the Graduate Faculty of North Carolina State University
in partial fulfillment of the requirements for the Degree of
Master of Science
Forestry
Raleigh, NC 2009 APPROVED BY:
BIOGRAPHY
ACKNOWLEDGEMENTS
I would like to thank my committee members - Drs. Bronson Bullock, Fikret Isik, and Steve McKeand - for their countless hours of guidance, expertise, and support during this process. I would also like to acknowledge Plum Creek and CellFor, and in particular Paul Belonger and Keith Palmer, who were a tremendous help in organizing the sampling and data collection stage of this research. Additionally, I wish to thank Dr. Robert Weir for his advice and expertise.
I am very grateful to Matt Cuneo, Evan Keto, Jin Xiong, Cristin Conner, Aaron Chamblee, and Jeff Boothby for aiding with the data collection portion of this research.
TABLE OF CONTENTS
LIST OF TABLES ... v
LIST OF FIGURES ... viii
1. GENERAL INTRODUCTION ... 1
Clonal Forestry and Somatic Embryogenesis ... 1
Stem Form and Taper in Clonal Forestry ... 2
Genotype by Environment Interaction ... 4
Propagation Effects in SE Clones ... 5
Objectives ... 8
2. CLONAL VARIATION OF STEM TAPER AND GROWTH TRAITS IN LOBLOLLY PINE ... 9
ABSTRACT ... 9
INTRODUCTION ... 12
MATERIALS AND METHODS ... 13
Study Sites ... 13
Genetic Material ... 14
Data and Measurements ... 15
Statistical Analysis ... 20
RESULTS ... 29
Summary Statistics ... 29
Taper effects on volume among clones ... 32
Variation Among Clones For Taper and Growth Traits ... 35
Genotype x Environment Interaction ... 40
DISCUSSION ... 41
CONCLUSIONS... 48
3. COMPARISON OF TAPER AND GROWTH TRAITS BETWEEN LOBLOLLY PINE SEEDLINGS AND TREES PROPAGATED BY SOMATIC EMBRYOGENESIS. ... 75
ABSTRACT ... 75
INTRODUCTION ... 77
MATERIALS AND METHODS ... 81
Statistical Analysis ... 82
RESULTS ... 84
DISCUSSION ... 88
CONCLUSIONS... 92
REFERENCES ... 109
LIST OF TABLES
Table 1. Summary information on the study sites. ... 51
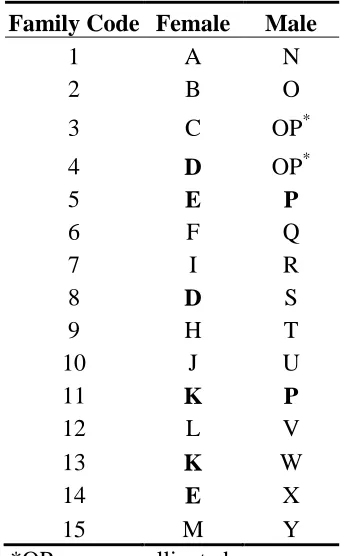
Table 2. Family codes and pedigree information for the clonal trials. Bold text indicates multiple crosses from the same parent. ... 52
Table 3. Frequencies of clones and seedlings measured for taper and growth traits. ... 53
Table 4. Descriptions and abbreviations for traits measured on individual stems... 54
Table 5. Form quotients used to describe stem taper among SE clones. ... 55
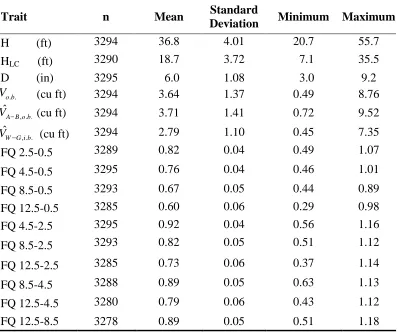
Table 6. Descriptive statistics for the data used in this research. Statistics for traits of total height, height to live crown, diameter at breast height, three measures of volume, and ten form quotients are shown for the overall dataset including SE clones, full-sib seedlings, and OP seedlings. ... 56
Table 7. Measured and estimated outside-bark volumes for the top two performing clones in each full-sib family. ... 57
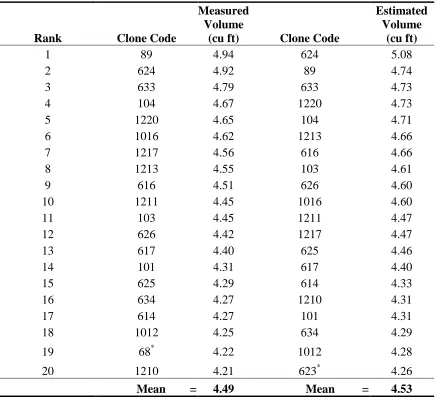
Table 8. Measured and estimated total outside-bark volumes for the twenty top performing clones overall, regardless of family structure. ... 58
Table 9. Percent total phenotypic variance explained by random effects in taper and growth traits (Equation 12). ... 59
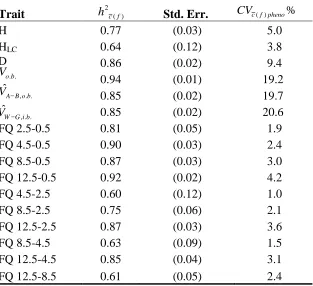
Table 10. Clone mean heritabilities, standard errors, and coefficients of variation for taper and growth traits of SE clones. ... 60
Table 11a. Genetic correlations (upper diagonal) and phenotypic correlations (lower diagonal) between form quotients calculated from upper-stem diameter measurements and lower-stem form quotients. Standard errors of genetic correlations are given in correlations in parentheses. Phenotypic correlations were obtained from clone means with corresponding p-values given in parentheses. ... 61
Table 11c. Genetic correlations (upper diagonal) and phenotypic correlations (lower
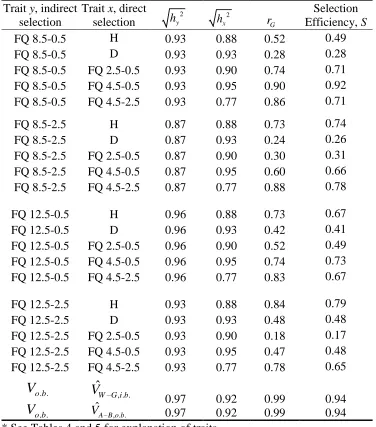
diagonal) between total measured outside-bark volume and predicted volume. Standard errors of genetic correlations are given in correlations in parentheses. Phenotypic correlations were obtained from clone means with corresponding p-values given in parentheses. ... 63 Table 12. Selection efficiencies calculated between selected form quotients and lower-stem
form traits. Selection efficiencies were also calculated for measured total outside-bark volume and predicted inside- and outside-bark volume. ... 64 Table 13. Family ranking for total measured outside-bark volume and form quotient (FQ
12.5-0.5) across the three test sites – Oliver RxR (ORxR), Oliver Orchard (OO), and Holly Hill (HH). Changes in family rank indicate evidence of genotype by environment interaction for these traits... 65 Table 14. Family codes and pedigree information for SE trees and zygotic seedlings
analyzed for propagation effects. Bold type indicates a common parent within the pedigree. ... 94 Table 15. Frequencies of clones propagated via somatic embryogenesis (SE) and full-sibling,
zygotic (Z) seedlings used in the analysis of propagation effects. ... 95 Table 16. Analysis of variance results for growth traits and form quotients used to examine
differences between propagule types, SE trees and zygotic full-sib seedlings (Equation 22). ... 96 Table 17. Family mean values and summary statistics for growth traits by propagule type.
Overall means by propagule type is also shown. Propagule Type: Z = zygotic full-sib seedlings, SE = clones propagated via somatic embryogenesis. ... 99 Table 18. Family mean values and summary statistics for form quotients by propagule type.
Overall means by propagule type is also shown. Propagule Type Z = zygotic full-sib seedlings, SE = clones propagated via somatic embryogenesis. ... 101 Table 19. Genetic gain calculated from selection of the top-performing clone within each
full-sib family for total height and total measured outside-bark volume (Equation 23). ... 103 Table 20. Comparison of the coefficients of variation for taper and growth traits between
propagule types of SE trees and zygotic seedlings (Equation 24). SE = clones
Table 21. ANOVA results from fixed effects models (Equations 9 through 11) testing for clonal differences in residual volume (measured volume - predicted volume). ... 114 Table 22. Restricted maximum likelihood estimates of variance components for random
effects (Equation 12) were used to partition genetic and environmental component in various stem taper and growth traits. ... 116 Table 23. Restricted maximum likelihood estimates of variance components and percent
phenotypic variance of random effects from Equation 13. ... 119 Table 24. Clone means for total height, diameter at breast height, total measured
LIST OF FIGURES
Figure 1. Mean form quotients calculated between 0.5 feet and 12.5 feet from ground and the corresponding 95% confidence intervals for the bottom and top five performing clones based on total outside-bark volume for clone means. Clone mean form quotients are arranged by increasing volume. ... 66 Figure 2. Relationship between clone mean form quotient and clone mean total height. ... 67 Figure 3. Relationship between clone mean form quotient and clone mean diameter at breast height... 68 Figure 4. Stem profiles of outside-bark diameters at corresponding heights up the stem for
family means. Families 2, 3, 4, 5, 14, and 15 are not shown due to a low number of clones and ramets within those families. ... 69 Figure 5. Measured and estimated total volumes for family means. Families are arranged by
increasing measured volume. Family ranking was stable using either measured or predicted total volume. Families 2, 3, 4, 5, 14, and 15 are not shown due to a low number of clones and ramets within those families. ... 70 Figure 6. Residual volume, calculated as the difference between measured outside-bark
volume and predicted outside-bark volume, is shown versus predicted volume (Amateis and Burkhart 1987) for each of the 157 genetic varieties based on clone means. ... 71 Figure 7. Residual volume, calculated as the difference between measured outside-bark
volume and predicted outside-bark volume, is shown versus predicted volume (Amateis and Burkhart 1987) for individual stems. ... 72 Figure 8. Relationship between total measured outside-bark volume and D2H. The
prediction line (Equation 18) shown was fit to the individual stems over the entire dataset. ... 73 Figure 9. Prediction line for measured total outside-bark volume of the SE clone means
compared with prediction lines of estimated outside-bark volume (Amateis and
Burkhart, 1987) and estimated inside-bark volume (Warner and Goebel, 1963). ... 74 Figure 10. Performance of SE trees and zygotic seedlings for growth traits of H, D, total
Figure 11. Comparison of a top performing clone, Clone 624, and the corresponding full-sib family (Family 6) performance for traits of total height, diameter at breast height, total measured outside-bark volume, and form quotient. Family and clone means were based upon 66 and 20 observations, respectively. ... 106 Figure 12. Comparison of a top performing clone, Clone 1217, and the corresponding
full-sib family (Family 12) performance for traits of total height, diameter at breast height, total measured outside-bark volume, and form quotient. Family and clone means were based upon 72 and 18 observations, respectively. ... 107 Figure 13. Comparison of one-inch diameter classes of full-sib seedlings from Family 6 and
ramets of a high-performing genetic variety from Family 6, Clone 624. Sample sizes for Clone 624 and seedlings from Family 6 were n = 20 and n = 66, respectively. ... 108 Figure 14. An illustration of the methods used to determine total measured outside-bark
volume. The formula for the volume of a cylinder, Smalian’s formula, and the formula for the volume of a cone were used to calculate sectional volumes. Total volume was then computed as the sum of the six sectional volumes. ... 126 Figure 15. An example of the proximity of SE clones and seedlings from the same
full-sibling family, Family 12, in one block of the clonal trials. ... 127 Figure 16. Empirical distribution of total height and fitted Normal distribution for SE clones and full-sibling seedlings. ... 128 Figure 17. Empirical distribution of diameter at breast height and fitted Normal distribution
for SE clones and full-sibling seedlings... 129 Figure 18. Empirical distribution of total measured outside-bark volume and fitted Normal
distribution for SE clones and full-sibling seedlings. ... 130 Figure 19. Empirical distribution of form quotient between 0.5 and 12.5 feet and fitted
1. GENERAL INTRODUCTION Clonal Forestry and Somatic Embryogenesis
Loblolly pine (Pinus taeda L.) is the single most important species to the southern U.S. timber industry, with almost 1.0 billion trees planted annually (McKeand et al. 2008). Tree improvement programs have been breeding and deploying genetically improved loblolly pine stock for over 50 years, producing the high quality and high yielding stands necessary to meet the increasing demand for wood and wood products. Productivity of pine plantations can be significantly improved by employing clonal forestry to multiply desired genotypes for use in breeding programs (Zobel and Talbert 2003).
Clonal forestry has become an integral part of effective tree improvement programs, making significant genetic gains for economically and biologically desired traits such as volume, stem form, reproductive fitness, and disease resistance. In recent years,
improvement in the efficiency of breeding strategies has made significant genetic gains possible in tree improvement programs. Studies have shown gains in plantation value of greater than 60% in stands of well-tested loblolly clones over unimproved seed (McKeand et al. 2006). Consequently, increasing numbers of single family or clonal blocks are being deployed in operational plantations in order to maximize genetic gains in desired stem form characteristics such as straightness, height, and volume.
Well-tested SE clones provide an increasingly cost-effective option for clonal deployment in plantations; however, producing clones through somatic embryogenesis is presently still more expensive than seedling production (Isik et al. 2005). Recent strides in the technology have been made to automate the science of somatic embryogenesis, making possible the large-scale production of genetically identical seedlings without the operational limitations of rooted cutting methods. SE clones are a particularly attractive option since the reproductive competence of the tissue culture can be preserved indefinitely through cryopreservation, allowing time for results from field trials to be obtained (MacKay et al. 2006).
Stem Form and Taper in Clonal Forestry
The SE clones used in this research are the progeny of well tested, high-performance families, though it is not known what differences, if any, exist in taper among clones and among families. If significant clonal variation exists for stem taper, tree improvers could potentially select varieties with low taper using a simple form quotient as a measure of taper, in addition to traditional total height and diameter at breast height measurements.
Research has shown varying results as to the degree to which growth traits and taper are under genetic control. Foster (1988) used a form quotient of diameter at breast height (D) and 15 centimeters above groundline to describe taper in 3-year-old rooted cuttings and seedlings from 5 full-sibling families. In the genetic analysis of rooted cuttings, no significant difference was found among clones within families for stem taper, though a significant family variance was reported. Foster (1988) concluded that phenotypic variation in stem taper is under strong additive control and can thereby be utilized effectively by tree improvers. Isik et al. (2005) found that growth traits in loblolly pine such as bole
In addition to taper, diameter, and height measurements, adding variables such as those that describe crown dimensions can improve volume models by accounting for additional variation. Inclusion of factors such as crown ratio, upper-stem diameter
measurements, and site variables in models have been shown to more accurately depict stem profiles and thus more accurately predict volume. Leites and Robinson (2004) used crown dimensions in a mixed-effects model to describe variation in stem form and to account for the autocorrelation of within-tree measurements. The authors found the inclusion of random effects parameters and crown variable parameters to improve the fit of their taper model (Leites and Robinson 2004).
Genotype by Environment Interaction
Propagation Effects in SE Clones
While the potential advantages of clonal forestry are well-documented (Zobel 1992, McKeand and Frampton 1984, Carson 1986, Libby 1974 and others), there is some evidence that propagation effects may impact the field performance of clones compared with that of zygotic seedlings. As vegetative propagation methods such as somatic embryogenesis or rooted cuttings are increasingly employed in clonal forestry, it is important that clones deployed commercially are well-tested and that growth characteristics are well understood, particularly if the traits exhibited by clonally propagated trees are different from that of seedlings.
Propagation effects on the taper and growth traits of rooted cuttings have been the topic of research for decades, though results are conflicting and often confounded upon other factors such as maturation effects or initial plant condition and size. Foster (1988) found that rooted cuttings had slightly less taper than seedlings; however, the author hypothesizes that differences in taper between seedlings and rooted cuttings were most likely due more to maturation effects than propagule type. In an earlier study by Fielding (1970), rooted cuttings exhibited less taper than seedlings in radiata pine (Pinus radiata) in several
The potential propagation effects of clones produced by means of tissue culture has also been studied extensively. McKeand and Allen (1984) found that while greenhouse-grown seedlings grew taller than their plantlet (clone produced via tissue culture methods) counterparts, there was no difference between the relative growth rates of the propagule types, though plantlets had significantly lower nutrient uptake than seedlings. Similar results were found by McKeand and Frampton (1984), where seedlings were larger than plantlets in terms of height, diameter, and volume, but the propagule types had similar growth rates in field trials for year 1 and year 2 measurements. In another greenhouse study of tissue culture plantlets from ten open-pollinated families, McKeand (1985) reported larger height,
diameter, and volume for seedlings in comparison to tissue culture plantlets. However, the author also found no significant differences between percent height, diameter, and volume growth of seedlings and tissue culture plantlets at year two measurements, indicating that the relative growth rates of the propagule types were comparable. McKeand (1985) also showed that plantlets had a slightly higher form quotient than seedlings.
measurements, but the authors note that seedlings were also taller at establishment and that relative height growth was approximately the same between propagule types.
Due to the relatively recent development of somatic embryogenic technology, there are few studies comparing stem taper and growth traits of SE trees and seedlings in loblolly pine. Few progeny trials of SE clones exist across the Southeast, and the literature is limited in information about the field performance of loblolly pine clones propagated by somatic embryogenesis. As SE clones become an increasingly attractive option for landowners and forest plantations, it is important to know how these clones perform in field trials in
Objectives
As volume is the primary measure of value in loblolly pine stands, knowledge about the stem taper of commonly deployed clones can better describe genetic gains made by each clonal variety and can provide more accurate volume estimates. The objectives of this research were to:
i. determine the genetic variation of stem taper and growth traits among clones from different full-sibling or open-pollinated families propagated by somatic embryogenesis, and
ii. examine propagation effects by comparing taper and form characteristics of SE clones to that of the experimental control, full-sibling seedlings of the same families.
2. CLONAL VARIATION OF STEM TAPER AND GROWTH TRAITS IN LOBLOLLY PINE
ABSTRACT
Accurate measures of taper and growth traits are vital in clonal selection and in capturing potential volume gains made by intensive selection. Clonal varieties with
combined low taper and fast growth can potentially offer great gains in uniformity, quality, and volume when deployed operationally. Clones propagated via somatic embryogenesis (SE) from fifteen full-sibling families were measured in the eighth growing season across three test sites in coastal Georgia and South Carolina. Variance components and genetic parameters for taper and growth traits were estimated using restricted maximum likelihood (REML) techniques. Ten form quotients were used to analyze stem taper differences among clones and to assess taper impacts on total stem volume. Significant clonal and family variation was found for form quotients, indicating that genetic differences exist in stem taper among different clones and families. Taper impacts on total volume were minimal after accounting for diameter at breast height and total height, with the overall mean residual volume (the difference between total measured volume and volume predicted by the Amateis and Burkhart (1987) combined variable model) being approximately -0.06 cubic feet, or 2.0% of the grand clone mean volume.
characteristics. Form quotients that included upper-stem diameter measurements were found to have moderately high genetic correlations (0.78 to 0.88) and selection efficiencies (0.65 to 078) with a form quotient derived from lower stem measurement. Since upper-stem
diameters can be difficult and time-consuming to measure, a more easily obtainable diameter measurement taken at 0.5, 2.5, or 4.5 feet may aid in the selection of clones with low rates of taper by the calculation of a lower-stem form quotient.
Total stem outside-bark volume was calculated from the taper data and compared to volumes estimated by two combined-variable (D2H) models, the Amateis and Burkhart (1987) and Warner-Goebel (1963) equations, to determine if these existing models could be used for clonal volume estimation. Total measured stem volume was found to be accurately predicted by the Amateis and Burkhart (1987) model, as indicated by the high genetic correlation (0.99) between measured and predicted volume and high selection efficiency (0.94) for indirect selection of total measured volume. A simple linear regression combined variable D2H model fit to measured volume of the dataset had slope and intercept coefficients that were statistically similar to those of the Amateis and Burkhart (1987) model, suggesting that development of separate volume models for these SE clones is not necessary. Clone and family ranking for predicted and measured total volume was fairly stable, indicating that a combined variable D2H model sufficiently captures volume differences among these clones and families.
INTRODUCTION
Loblolly pine is arguably the most important timber species in the southeast U.S., planted annually with an estimate of nearly 1 billion trees (McKeand et al. 2008). The implementation of clonal forestry has been shown to achieve significant gains in
economically and biologically desired traits (Isik et al. 2005, Zobel 1992, Li et al. 1999, and others). One of the most recent methods of vegetative propagation is somatic embryogenesis (SE), a technique used to propagate clonal embryos asexually through tissue culture (Cairney et al. 1999). Implementation of clonal forestry has made possible the large-scale production of genetically identical seedlings and has become an efficient method to propagate varieties of elite genotypes for deployment across pine plantations. SE clones are a particularly attractive option in comparison to rooted cuttings since the reproductive competence of the tissue culture can be preserved indefinitely through cryopreservation, allowing time for results from field trials to be obtained (MacKay et al. 2006).
The degree to which taper and growth traits are under genetic control has been studied extensively. Isik et al. (2005) found significant family and clone-within-family variances for growth traits of total height, diameter at breast height, and bole straightness at year four measurements of ramets established in Florida. In their study, selection of the eight best clones was found to increase volume gains by approximately 52% over unimproved seedlings (Isik et al. 2005). In a rooted cuttings study, Foster (1988) found the variance among clones within families to be significant for growth traits (e.g., total height, D, and crown width) but was not significant for taper, while family variance was significant for only taper and total height at age 3. In a similar study, Foster et al. (1987) found no difference among families for stem taper of rooted cuttings and seedlings at age four, but found significant family variance for taper at year 6 measurements.
As volume is the primary measure of value in loblolly pine stands, knowledge about the stem taper of commonly deployed clones can better describe genetic gains made by each clonal variety and can provide more accurate volume estimates. The objective of this research was to determine the genetic variation of taper and growth traits among clones from different full-sibling or open-pollinated families propagated by somatic embryogenesis.
MATERIALS AND METHODS
Study Sites
full-sibling and open-pollinated families. Of the seven sites, three were selected for sampling based on location and Year 5 descriptive data. The experimental design of the clonal trials was an alpha-lattice, incomplete block with ramets planted in single tree plots. Blocks contained roughly the same total number of ramets, though every genotype was not represented in each block. Two sites had eight blocks while one site contained only four blocks (Table 1). Trees were planted on a 6 x10 ft spacing (726 trees per acre), with six feet between trees and 10 feet between beds. Two rows of buffer trees (mixed open-pollinated planting stock) lined the outside edges of the study in order to minimize edge effects. Site preparation included application of chemical herbicide and mowing prior to plantingin 2001.
The three study sites were located across varying edaphic conditions and productivity classes in the coastal plain of South Carolina and Georgia (details in Table 1). Two sites were located in Screven County, GA but were deemed sufficiently different based on soil class and previously measured summary data. The clonal trials are located on soil groups B and E, varying from very poorly drained to moderately well-drained sandy loam soil, as designated by the Cooperative Research in Forest Fertilization (CRIFF) program at the University of Florida (Jokela and Long 1999).
Genetic Material
In efforts to fully capture site differences, only clones represented by a total of at least 3 ramets (one ramet at each site) were measured and included in this research. Of the
2001, 157 SE clones from 15 families were used in this study. From each cross of female and male parents, clones were produced via somatic embryogenesis. Seedlings from 12 full-sibling families and 2 open-pollinated families were included in the trials to serve as a control. Family number 14 was the only family not represented by a zygotic seedling control in this study.
Though the majority of crosses were single-pair matings, several families were related by a common male or female parent. Multiple crosses from the same parent are indicated by bold type in Table 2. Additionally, female D is the daughter of female F and male Y is the offspring of male V. The parental information of the families used in this study is described in Table 2.
Data and Measurements
A total of 3,295 loblolly pine trees were measured in the eighth growing season during July and August of 2008. Trees with stems forking below 12.5 feet were not measured. Additionally, trees with extremely suppressed crowns, broken tops, or severe fusiform rust damage (caused by the fungus Cronartium quercuum (Berk) Miyabe ex Shirai f.sp. fusiforme) were excluded from this study (Isik et al. 2005). Table 3 summarizes the number of SE clones, full-sibling seedlings, and OP seedlings measured and used in this analysis.
2.5, and 4.5 feet above groundline. An average of two caliper measurements, offset by 90 degrees, wasused to determine the average diameter, measured with a precision of 0.1 inches. Two measurements of upper stem diameters were taken at 8.5 and 12.5 feet using a diameter tape, a height pole, and a climbing ladder. Upper-stem diameters measured with a diameter tape were measured to a precision of 0.05 inches. If a branch whorl or stem abnormality occurred at one of the five specific height intervals, the diameter measurement was taken slightly above or below the abnormality. Linear interpolation was then used to estimate the diameter at the height of interest.
Total height and height to live crown were measured with a precision of 0.1 feet using a Haglof Vertex IV hypsometer. The hypsometer was calibrated each morning before data collection and was recalibrated several times throughout the day in order to maintain
accuracy in the measurements. The presence of forking was recorded with a code of 0, 1, or 2 to denote no forking, forking below 12.5 feet, or forking above 12.5 feet, respectively. Table 4 summarizes the traits measured for each stem and the abbreviations used to reference each trait.
Using various combinations of diameter measurements, ten form quotients were calculated in order to describe stem taper between different sections of the bole. Form quotients were calculated as the ratio of the outside-bark diameter at an upper stem height divided by the outside-bark diameter at a lower height:
upper lower
D FQ
Where:
FQ = form quotient
upper
D = outside-bark diameter at a specific upper-stem height
lower
D = outside-bark diameter at a specific lower-stem height The ten form quotients used in this analysis are defined in Table 5.
Smalian’s formula (Avery and Burkhart 2002) was used to calculate the outside-bark cubic foot volume of each section of the stem between successive diameter measurements:
2 smalian
B b
V L (2)
Where:
smalian
V = sectional volume, cu ft
B= cross-sectional area of the bolt’s large end, sq ft b= cross-sectional area of the bolt’s small end, sq ft L= length of the bolt, ft
The shape of a cylinder was assumed for the stump section of the stem from 0.5 feet to groundline. The outside-bark diameter at 0.5 ft was used in the equation for volume of a cylinder to calculate outside-bark volume for the stump section.
( ) cyl
V B L (3)
cyl
V = sectional volume between groundline and 0.5 feet, cu ft
The equation for the volume of a cone was used to calculate the volume in cubic feet from 12.5 feet to total height (Avery and Burkhart 2002):
3 cone
B
V L (4)
Where:
cone
V = sectional volume between 12.5 feet and total height, cu ft
Sectional volumes for each tree were summed to compute the total outside-bark volume per tree in cubic feet.
4
. .
1
o b cyl smalian cone
i
V V V V (5)
Where:
Vo b. .= total outside-bark volume per tree, cu ft
4
1
smalian i
V = summation of sectional volumes computed from Smalian’s, cu ft, where i = 1, …, 4
Figure 14 of the Appendix illustrates the methods used to calculate measured total outside-bark volume, Vo b. ..
Outside-bark volume was also predicted for each stem using an equation derived by Amateis and Burkhart (1987) that is commonly used to estimate loblolly pine total stem volume. Their equation predicts total stem outside-bark volume (cu ft) in cutover, site-prepared loblolly pine plantations:
2 , . .
ˆ 0.18658 0.00250
A B o b
V D H (6)
Where:
, . .
ˆ A B o b
V = predicted total stem outside-bark volume from the Amateis and Burkhart (1987) equation, cu ft
To examine differences between the actual outside-bark volume estimates derived from the summation of log sectional volumes versus volume estimated from the Amateis and Burkhart model, a residual volume variable was created.
. . ˆ , . .
resid o b A B o b
V V V (7)
Where:
resid
V = residual volume difference per tree, cu ft
2
. .
, 0.03371 0.0196128
10 i b W G D H V (8) Where: . . ,i b W G
V = predicted total stem inside-bark volume from the Warner and Goebel (1963) equation, cu ft
Statistical Analysis
Taper and Volume Differences Among Clones
Residual volume was calculated as the difference between measured outside-bark volume and outside-bark volume predicted by the Amateis and Burkhart (1987) equation, which uses a combined D2H variable as a regressor (Equations 5, 6, and 7). A fixed-effects model was used to test for differences among SE clones for residual volume.
( )
( )
ijk l i j i k ijkl
y s b s c (9)
Where:
yijk l= residual volume of the lth ramet of the kth clone in the jth block within the
ith site, cu ft = overall mean
si= fixed effect of the ith site (i = 1,…3)
b s( )j i( )= fixed effect of the jth block within site i (j = 1,…8) cl k( )= fixed effect of the kth clone (k = 1,…157)
ijk l= residual error associated with the lth ramet of the kth clone in the jth block in
A fixed effects model was deemed appropriate for use in Equation 9 since inference about population variances of the effects was not of interest; rather, Equation 9 was used simply to identify if differences exist for residual volume between the 157 clonal varieties.
Several traits of interest - total height, diameter at breast height, and form quotients (FQ 12.5-0.5, FQ 12.5-2.5, FQ 4.5-0.5, FQ 4.5-2.5, and FQ 2.5-0.5) - were added separately to Equation 9 as covariates in order to determine the effect of these variables on clonal differences in residual volume:
( )
i jkl i i k ijkl ijkl
y u s b s c X (10)
Where:
= parameter to be estimated
Xijkl= trait of interest (H, D, or form quotient) of the lth ramet of the kth clone in the jth block within the ith site
Total height, diameter at breast height, and a form quotient (FQ 12.5-2.5) were also added together as covariates to determine the effect of all three variables on differences between clones for residual volume:
1 2 3
( )
i jkl i i k ijkl ijkl ijkl ijkl
y u s b s c H D FQ (11)
Where:
1, 2, 3= parameters to be estimated
Hijkl= total height of the lth ramet of the kth clone in the jth block within the ith site, ft
FQijkl= form quotient of the lth ramet of the kth clone in the jth block within the ith site, calculated from outside-bark diameter measurements at 12.5 and 2.5 feet
Genetic Analysis
A mixed-effects model (Schabenberger and Pierce 2002) was used to partition phenotypic variance of traits into genetic and environmental components. Using variance components, several functions of variances were calculated, including phenotypic variances of clone means, coefficients of variation for clone means, and clone-mean heritability. A pedigree file containing information about relatedness among clones was used in
computations of variance components. The full mixed model used to analyze traits was:
( ) ( ) ( )
( )
ijkl m i j i k ki l k l k i ijkl m
y s b s f fs c cs (12)
Where:
yijkl m= individual observation of trait of interest for mth ramet of the lth clone in
the kth family in the jth block within the ith site = the grand mean
si= fixed effect of the ith site (i = 1,…3)
( )
( )j i
b s = fixed effect of the jth block within the ith site (j = 1,…8) fk= random effect of the kth family (k = 1,…15)
fski= random effect of the interaction of the kth family by the ith site cl k( )= random effect of the lth clone within the kth family (k = 1,…157)
i jkl m= residual error associated with the mth ramet of the lth clone within the kth family in the jth block in the ith site
In order to determine the effect of stem size (D2H) on clonal variation in taper, predicted total outside-bark volume was added to Equation 12 as a covariate:
( ) ( ) ( ) ˆ. .,
( )
ijklm
ijkl m i j i k ki l k l k i o b A B ijkl m
y s b s f fs c cs V (13)
Where:
yijkl m= form quotient calculated from outside-bark diameters at 12.5 and 0.5 feet up the stem
= parameter to be estimated ˆ. .,
ijklm
o b A B
V = predicted total stem outside-bark volume from the Amateis and Burkhart (1987) equation
Based on conventional mixed-model assumptions, the random effects of family, family by site interaction, clone, clone by site interaction, and the residual error where assumed to be Normal and independently distributed with mean zero and variance equal to
2
f, 2fs, 2c, 2cs, and 2, respectively.
Restricted expected maximum likelihood (REML) was used to calculate variance components. Since copies of clones (ramets of a clone) are genetically identical, residual error was assumed to be due to environmental variation among ramets within a clone. If clone by site interaction or family by site interaction variance components were found to be zero, the terms were taken out of the model. All genetic analyses were carried out using the computer program ASReml (Gilmour et al. 2006). ASReml is capable of accounting for relatedness among clones using pedigree structures in its estimations of variance components and standard errors.
The following equation was used to calculate the phenotypic variance of clone means for all traits using estimated variance components:
2 2
( )
2 2
( )pheno ( )
c f s
c f c f
s sr (14)
Where:
2 ( )pheno
c f = phenotypic variance of clone means for the trait of interest
c f2( )= clone-mean variance
c f s2( ) = clone by site interaction variance
2
= residual variance s= number of test sites
In clonal forestry, clone-mean heritability is an important genetic parameter that describes the repeatability of clone means. The ratio of genetic and phenotypic variance is indicative of how well a phenotypic observation represents the average effect of the parents’ genes in progeny (Falconer and Mackay 1996). The following equation was used to
calculate the clone-mean heritability (h2c f( )) for each form quotient and growth trait:
2 ( ) 2
( ) 2 2
( ) 2
( )
c f c f
c f s c f
h
s sr
(15)
Clone-mean heritability ranges between 0 and 1. A value closer to 1 indicates that variation observed for a trait of interest among clone means is due to genetics and will be repeatable. A coefficient of variation for clone means was calculated to describe the variability among clones as a percentage of the overall mean for growth traits.
2 2
( ) 2
( )
( )pheno
c f s c f c f s sr CV X (16) Where: ( ) pheno c f
CV = coefficient of variation for clone means
2 2
( ) 2
( )
c f s c f
Statistics such as a coefficient of variation remove the scale effect of variances and can therefore be used to compare different traits.
Genetic correlation is the ratio of genetic covariance and the product of the genetic standard deviations of two traits and can be thought of as the correlation of the breeding values (Falconer and Mackay 1996). In tree improvement, genetic correlations are important in describing the extent to which one trait can indirectly be improved by selecting for another trait (Zobel and Talbert 2003). As stem taper is a difficult trait to assess in progeny trials, it may be advantageous to select clones for stem form based on simple measurements that are highly correlated with taper. By examining the relationship between form quotients and growth traits, taper could be indirectly selected for instead of being directly measured, which can be time-consuming and costly in terms of data collection. A bivariate linear mixed model was fit to the clonal data to calculate genetic covariances and variances in order to obtain genetic correlations.
( , ) ( ) ( ) ( ) 2 2 ( ) * ( ) x y x y c f G
c f c f
r (17)
Where:
rG= genetic correlation between traits x and y
( , )
( )x y
c f = genetic covariance between traits x and y for clones within family
( )
2 ( )x
c f = clone within family mean variance of trait x
( )
2 ( )y
Pearson’s product-moment correlations based on clone means were also estimated for pairs of traits. Phenotypic correlations can describe the strength of the linear relationship between two traits.
Selection efficiency, defined as the ratio of expected response from indirect selection and direct selection of a desired trait, gives a means to compare the effectiveness of the two selection methods (Falconer and Mackay 1996). Correlated response, direct response, and selection efficiency of taper and growth traits were calculated as given by Falconer and Mackay (1996):
y x y G py
CR ih h r (18)
2
y y py
R ih (19)
y y
CR S
R (20)
Where:
y
CR = correlated response of indirect selection of the trait of interest, y i= selection intensity
hx= square-root of the heritability of trait x, the trait actually selected for hy= square-root of the heritability of the trait of interest, y
rG= genetic correlation between traits x and y
2
y
h = clone-mean heritability of the trait of interest, y
S = selection efficiency
Selection efficiencies were calculated for five traits of interest to be indirectly selected for (Trait y): FQ 8.5-0.5, FQ 8.5-2.5, FQ 12.5-0.5, FQ 12.5-2.5, and outside-bark volume (see Table 5 for descriptions of form quotient codes). For each of the aforementioned form quotients, a correlated response (CRy) was calculated using the following traits as Trait
x, the characteristic directly selected for: FQ 2.5-0.5, FQ 4.5-0.5, FQ 4.5-2.5, D0.5, D2.5, D, H,
HLC, Vo b. ., VˆA B o b, . ., and VW G i b, . .. Of the ten form quotients measured in this study, these four
(FQ 8.5-0.5, FQ 8.5-2.5, FQ 12.5-0.5, FQ 12.5-2.5) were selected as traits of interest since the ratios are representative of the bole sections with the expected greatest rates of stem taper. Moreover, the upper-stem diameter measurements used to calculate these form quotients required more time in data collection and were cumbersome to obtain on standing trees. More easily obtainable measurements such as lower-stem form quotients, diameters, and total height were used in Equation 15 as a means to indirectly select for taper with a measurement that is easy to obtain during the selection process in clonal trials.
The correlated response of total outside-bark volume (Equation 5), Vo b. ., was also calculated using predicted outside-bark volume (Equation 6), VˆA B o b, . ., and inside-bark
volume (Equation 8), VW G i b, . ., as the trait directly selected for as described by Equation 15.
this calculation also involved upper-stem diameter measurements. If selection efficiencies are high for these calculations of actual summed volume versus predicted volume, then clones could be accurately described and selected for volume as predicted by a simple combined-variable (D2H) model.
RESULTS
Summary Statistics
Descriptive statistics for the entire dataset are summarized in Table 6. The mean total height and diameter at breast height were 36.8 feet and 6.0 inches, respectively. Total stem outside-bark volume, calculated from summed sectional volumes, had an average of 3.64 cubic feet per stem over all clones, full-sib seedlings, and OP seedlings. Form quotient means ranged from 0.60 to 0.92, depending on the heights along the stem used to take diameter measurements. Several form quotients had a maximum value greater than one, indicating that that a branch whorl or stem abnormality may have impacted the diameter measurement at a specific height. For some traits, missing observations and data entry errors resulted in the number of observations being slightly below that of the entire dataset, 3295 trees.
Figure 1 depicts the mean form quotient between 12.5 and 0.5 feet for the five highest- and lowest-performing clones (based on total outside-bark volume for clone means). The difference in mean form quotient between the highest and lowest performing clones was 0.13, representing a 13% change in stem diameter between 0.5 feet and 12.5 feet.
Clones from families 12 and 10 had the lowest rates of taper between 0.5 feet and 12.5 feet, with four out of the five clones having the overall highest form quotient FQ 12.5-0.5 being from family 12. However, clones with the highest measured total outside-bark volume came from Families 6, 10, and 12, in descending order. Families 11 and 13 had the greatest rate of taper (FQ 12.5-0.5) based on family means while clones 135, 111, 133, 1316 and 11 had the overall most taper based on clone means, all five being from families 11 and 13. Families 2, 3, 4, 5, 14, and 15 were excluded from this ranking in terms of taper and volume due to a low number of clones and ramets.
Figure 2 and 3 show a generally proportionate relationship between taper and size based on clone means. As average total height increases, the mean form quotient between 0.5 and 12.5 feet also increases, indicating less taper in the portion of the stem below 12.5 feet. The plot of mean FQ 12.5-0.5 versus average D suggests a similar relationship, though the low coefficient of determination suggests a lesser correlation between these two traits.
Overall clone rank changed when using measured volume and then estimated volume (both inside- and outside-bark) as a mechanism for ranking, as did clone ranking within family with the exceptions of families 1 and 8. However, when the best two clones from each family (in terms of measured volume) were evaluated, clone rank changes only occurred in families 7, 10, 12, and 13, and volume differences were very small (Table 7). The top performing clone in each family did not change in rank, with the exception of Family 13, where this clone switched rank with the second-best performing clone. Clone 1217 was the top-performing clone overall for both total height and FQ 12.5-0.5; similarly, the top 2 ranking varieties for D, Clone 624 and Clone 633, were also the second and third ranking clones overall for total measured outside-bark volume. When the best two clones from each family were selected, mean measured outside-bark volumes were 11% greater than the grand clone mean volume of all varieties.
Table 8 shows mean measured and estimated total outside-bark volume for the highest performing 20 clones overall. Selecting the best clones overall (regardless of family structure) increased mean measured volume by 0.4 cu ft compared with mean volume of the best 2 clones from each family (Table 7) and increased volume by 19% over the grand clone mean of measured volume across all three study sites. Two clones, 68 and 623, were unique to the top twenty ranking for measured volume and estimated volume, respectively.
Table 24 of the Appendix gives clone mean values for H, D, Vˆo b. ., and FQ 12.5-0.5. Clone means are calculated from all ramets of a clone across the three test sites.
Taper effects on volume among clones
Residual volume, calculated as the difference between measured and predicted outside-bark volume, was tested for differences among clones (Equation 9). Modeling the clonal effect of this residual value can convey whether a traditional volume equation that was specifically derived for non-genetically improved stock accurately describes the volume of these clones as compared to the measured volume which takes into account stem taper below 12.5 feet in the stem. If no significant differences exist among clones, a combined variable model may be the simplest and most efficient method to describe volume of the genetic varieties.
volume (Amateis and Burkhart 1987) over the entire dataset in Figure 7. As expected, the range of residual volume values is larger for individual stems than for clone means. The gradual widening of residuals across the x-axis in Figure 7 depicts the increase in variation of total stem volume as trees become larger.
In Equation 10, total height, D, and several form quotients (FQ 12.5-0.5, FQ 12.5-2.5, FQ 4.5-0.5, and FQ 2.5-0.5) were added separately to the initial fixed model with clone effects only (Equation 9) in order to test for the effect of adding covariates to the residual volume model. Analysis of variance results showed that clonal effects on residual volume remained highly significant (p-value ranging from 0.0006 to <0.0001) with the addition of each of the aforementioned variables as separate covariates. Form quotients FQ 12.5-0.5 and FQ 12.5-2.5 had the greatest effect when added separately to the model, reducing the mean-square error (MSE) from 0.074 (clone effects only) to 0.062 and 0.059, respectively, with the addition of each form quotient. The coefficient of determination also increased from 0.12 in the model with only clone effects to 0.21 and 0.17, respectively, as FQ 0.5 and FQ 12.5-2.5 were added to the model. Three traits – H, D, and FQ 112.5-2.5-12.5-2.5 – were then added
simultaneously to the fixed effects model for residual volume in order to determine the effect of all three covariates on clonal differences (Equation 11). F-tests showed that the clonal effect remained highly significant (p-value = <0.0001) with the addition of all three traits, while the MSE was reduced further from 0.074 (clone effect only) to 0.042 and the
improvement in describing variation among clones for residual volume, indicating that these traits, along with genetic effects, impact the difference between measured and estimated total stem volume and should thus be taken into account when the total volume of clones are considered. A summary of the results from Equations 9, 10, and 11 can be found in Table 21 of the Appendix.
Total measured outside-bark volume and a combined variable (D2H) were used in simple linear regression to derive a volume equation fit to individual stems over the entire dataset.
2
. . 0.25590 0.002400( )
o b
V D H (21)
Figure 8 depicts Equation 21 as a trendline fit (R2 = 0.954) to individual trees. The intercept and slope of the Avery-Burkhart model are contained within the 95% confidence intervals for the slope and intercept coefficients in Equation 21. Figure 9 shows the comparison of
prediction lines for measured outside-bark volume, estimated outside-bark volume (Amateis and Burkhart 1987), and estimated inside-bark volume (Warner-Goebel 1963) based on clone means. It can be seen from Figure 9 that the Avery-Burkhart equation generally
overestimates volume slightly while the Warner-Goebel equation underestimates volume, which is expected since the Warner-Goebel equation estimates inside-bark volume, and the measured volume is outside-bark.
decreased the mean square error (MSE) from 0.075 to 0.060 and increased the r-square from 0.954 to 0.963; adding FQ 12.5-2.5 decreased the MSE to 0.056 and increased r-square to 0.965. Though adding the form quotients slightly improved the fit of the model, the
combined-variable D2H model (Equation 21) is effective in describing the total stem volume of these clones without taking into account a measure of taper beyond D2H.
Variation Among Clones For Taper and Growth Traits
A preliminary analysis of variance showed a highly significant clonal effect on all form quotients and growth traits (results not shown). Mixed model analysis and REML techniques were used to estimate variance components and calculate clone-mean
heritabilities (Equations 12 and 15). Estimates and standard errors of variance components for each trait can be seen in Table 22 of the Appendix.
Percent phenotypic variation of each random effect in Equation 12 is shown in Table 9. For each form quotient and growth trait, variation among clones accounted for the majority of total phenotypic variation (26.0% to 3.4%) while variation among families was a relatively smaller portion, ranging from 10.72 % to 1.1%. Clonal variation for two form quotients, FQ 12.5-0.5 and FQ 12.5-2.5, accounted for roughly the same range of percentage of the
variances among ramets can be thought to represent the environmental effects causing differences between ramets and other sources of variation not accounted for in the model. Residual variance accounted for the majority of the total variance among clones for stem taper and growth traits.
In Equation 13, predicted total outside-bark volume was added to the mixed model (Equation 12) as a covariate in order to determine the effect that adding size (as described by the combined D2H variable) had on the variance among clones for FQ 12.5-0.5. Percent phenotypic variance due to clonal differences in form quotient was reduced from 19% to 16.7% with the addition of total volume as a covariate. The estimates of variance
components and percent phenotypic variance for each random effect of Equation 13 can be seen in Table 23 of the Appendix.
measurements for each clone. Total measured volume also had slightly more variance explained by the clone by environment interaction term, which resulted in a smaller estimate of error variance and thus a higher portion of the total phenotypic variance was attributed to clonal differences, resulting in a higher heritability estimate.
Genetic and phenotypic correlations for several traits of interest are shown in Tables 11a through 11c. Since four form quotients – FQ 8.5-0.5, FQ 8.5-2.5, FQ 12.5-0.5, and FQ 12.5-2.5 - accounted for the greatest rates of taper within stems, these traits were selected to be correlated with other more easily obtainable measurements such as lower-stem form quotients (Table 11a) and growth traits (Table 11b). Measured volume was also correlated with predicted outside-bark and predicted inside-bark volume (Table 11c).
Genetic correlations between the form quotients of interest – FQ 8.5-0.5, FQ 8.5-2.5, FQ 12.5-0.5, and FQ 12.5-2.5 – and lower-stem form quotients ranged from 0.18 to 0.90. In Table 11a, it can be seen that the highest genetic correlations were calculated when the traits of interest were correlated with the form quotient measured between 2.5 feet and breast height (FQ 4.5-2.5), with the exception of FQ 8.5-0.5. Genetic correlations were significantly lower when correlated with the lower-stem form quotient of FQ 2.5-0.5.
Phenotypic correlations from clone means (below diagonal, Table 11a) were generally lower than genetic correlations, ranging from 0.07 to 0.84. Highly significant p-values for
interest, and was found to be statistically uncorrelated with FQ 8.5-2.5 and FQ 12.5-2.5 (p-values 0.1539 and 0.3972, respectively).
Table 11b shows genetic (above diagonal) and phenotypic (below diagonal) correlations between the four form quotients of interest and growth traits. Form quotients and total height had the highest genetic correlations (0.52 - 0.82), followed by height to live crown (0.39 – 0.66) and D (0.28 – 0.48). Diameters at 0.5 and 2.5 feet were not highly correlated with form quotients. Phenotypic correlations between form quotients and growth traits ranged from 0.04 to 0.75, with total height having the highest phenotypic correlation with form quotients of all the growth traits. Measured outside-bark volume was highly correlated (0.99) with estimated outside-bark and estimated inside-bark volume (Table 11c.). Phenotypic correlations between measured and estimated volume were also high and
statistically significant at 0.99 (p-value <.0001).
All pairs of traits used in genetic and phenotypic correlations were plotted in scatter plots to ensure that a correlation other than linear correlation did not exist between traits with low genetic correlations (results not shown). Upon plotting pairs of traits, there was no evidence of a binomial, curvilinear, or cyclic relationship.
calculated using diameters at 0.5 feet and 2.5 feet (D0.5 and D2.5) since these traits had low
genetic and phenotypic correlations with the form quotients.
Selection efficiencies for pairs of traits varied widely, ranging from 0.17 to 0.94 overall (Table 12). When growth traits of H and D were used to indirectly select for form quotients, selection efficiencies were moderately high, with the highest for FQ 12.5-2.5 at 0.79 for direct selection on H. These high selection efficiencies were due in part to the relatively high clone-mean heritabilities of total height and D (0.77 and 0.86, respectively) and the high genetic correlation between H and form quotients. Selection of upper-stem form quotients by lower-stem form quotients resulted in a wide range of selection
efficiencies, ranging from 0.17 to 0.92. Two form quotients, FQ 4.5-0.5 and FQ 4.5-2.5, generally had the highest selection efficiencies as calculated with all four form quotients of interest, indicating that these characteristics may provide an effective means for selection of taper below 12.5 feet in the stem. Selection efficiencies for indirect selection of total measured volume using estimated total inside- and outside-bark volume were high (0.94). This high selection efficiency value was due to the high heritability estimates of both estimated and measured total volume, and to the exceptionally strong genetic correlation between the traits (rG = 0.99).
(see Table 10 for clone-mean heritabilities). However, from a practical standpoint, indirect selection for upper-stem form quotients and measured volume may also be desirable since upper-stem diameter measurements can be difficult, costly, and time-consuming to obtain.
Genotype x Environment Interaction
Effects of genotype by environment interaction (G x E) were small for most traits in this study. Family by site interaction variance accounted for zero percent of the total
phenotypic variance for total height and five form quotients (Table 22 Appendix). Family by site variance contributed between 0.1% and 3.1% of the total phenotypic variance for traits of HLC, D, measured and estimated outside-bark volume, estimated inside-bark volume, and five
form quotients (Table 9). Family rank changed among the three sites for measured volume and form quotient (FQ 12.5-0.5), though family ranking was more stable for the form
quotient (Table 13). Families 2, 3, 4, 5, 14, and 15 were excluded from family ranking due to a low number of observations for means.
changes did occur among clones across the three test sites for traits of measured total volume and form quotient, though the growth differences across the sites were small.
DISCUSSION
A particular form quotient, FQ 12.5-0.5, captured the greatest variation of taper among clones. Results showed that, in general, larger trees in terms of H and D exhibited less taper in the stem below 12.5 feet, suggesting this portion of the bole becomes more cylindrical as the tree grows larger. This is consistent with current understanding of tree growth (Larson 1963). One hypothesis for the decreased taper is that the highest diameter measurement in the form quotient calculation (taken at 12.5 feet) is proportionally farther from the live crown of a taller, larger tree versus that of a shorter, smaller stem. Since taper is generally thought to be greater in dominant trees, with suppressed trees having more
cylindrical stems (Larson 1963 and Newnham 1965), additional upper-stem diameter measurements above 12.5 feet may be needed to fully capture taper of the stem and to make generalized statements about the relationship of whole-stem taper and growth of these genetic varieties.
and FQ 12.5-0.5, exhibiting combined superior height growth and low taper. Similarly, the best clones in terms of D were also superior in terms of total measured outside-bark volume. The best performing clones and families did not always rank the same for measured outside-bark volume and FQ 12.5-0.5, suggesting that the clones and families with the lowest rates of taper are not necessarily the largest trees in terms of volume.
Selecting the best 20 clones (in terms of measured volume) overall improved mean volume by 19% over the grand mean volume of all clones, which was considerably higher than volume improvement achieved by selecting the best 2 clones from each of the nine families (11%). With the exception of one clone from Family 8, the top 20 clones all are progeny of three full-sibling families, and therefore the balance of volume gain and
preservation of genetic variation is a consideration. In a rooted cuttings study by Isik et al. (2005), gains in volume were comparable for the top ranked clones overall and for clones selected from each family. The findings of Isik et al. (2005) suggest that the dual objectives of maximizing gain and maintaining genetic diversity among clones can be achieved by selecting clones from different families versus selection of the top performing clones overall.
Residual volume (measured – predicted) showed a highly significant clonal effect (Equation 9), which indicates that a D2H model predicts volume more accurately and
suggesting that additional variation in residual volume among clones can be removed by adding a measure of taper to the model. However, the mean residual differences in measured and predicted volume overall were small at -0.06 cu ft, or approximately 2% of the mean volume (3.21 cu ft). These results indicate that a combined-variable D2H model such as the Amateis and Burkhart (1987) equation can accurately describe the total volume of these clones without the need for additional upper and lower stem diameter measurements beyond D.
The combined-variable model (Equation 21) fit to individual stems in the dataset was nearly identical in terms of the slope coefficients to the Amateis and Burkhart (1987) model, which was specifically developed from non-genetically improved trees. The similarities between the two models demonstrates that these SE clones are growing in a similar fashion to genetically unimproved trees, and the need for new total volume models may not be required for these varieties. Adding a form quotient to Equation 21 improved the fit of the model slightly, though D2H alone accurately described total volume among clones (R2 = 0.954). These results are consistent with the findings of Newnham (1965), who
demonstrated that greater than 95% of the variation in taper (as described by a regression coefficient) in Scots pine (Pinus sylvestris L.) could be explained by a combined D2H variable.
(4.2% - 26.0%). Adding predicted total volume to Equation 12 as a covariate reduced the variation among clones slightly (from 19.0% to 16.7%); however, clonal effects remained a large source of variation in stem taper (as described by FQ 12.5-0.5). This indicates that genetic differences remain a considerable source of variation in stem taper after accounting for stem size as described by total volume in a D2H combined variable equation. The significant clonal effect in all ten form quotients is contrary to the results of Foster (1988), who found variance among clones for taper to be nonsignificant. These results are also different from those of Isik et al. (1999), who found variance among OP families to be zero for a form quotientmeasured between D and groundline in 17-year-old Turkish red pine (Pinus brutia Ten.). Estimates of percent family and clone variance were similar to those found by previous authors. Isik et al. (2003) reported variance among rooted cuttings to account for 1.2%, 3.1%, and 6.9% of the total phenotypic variance for height, diameter, and volume, respectively. In another study of rooted cuttings, Foster (1988) found family variance accounted for 0.0% - 9.8% of total phenotypic variation while clonal variance accounted for 6.7% to 35.4% for taper and growth traits. In this study, one form quotient (FQ 12.5-0.5) had the largest clone mean variance and heritability estimate of all the form quotients considered. Residual variance was the largest source of variation for each trait, which points to the environmental error among ramets and other sources of error not accounted for in the model (Equation 12).
The heritability estimates for H and D were comparable to clone-mean heritabilities reported in the literature in clonal studies of loblolly pine (Isik et al. 2005, Foster 1988, Frampton and Huber 1995). The relatively low heritability estimate for HLC suggests that factors other than
genetics strongly influence this trait, such as environmental effects. Form quotients that included an upper-stem diameter measurement at 12.5 feet (FQ 12.5-0.5 and FQ 12.5-2.5) had the highest heritabilities ( > 0.87) while various form quotients calculated between 8.5 and 0.5 feet up the stem had substantially lower heritability estimates. The low heritability may be due to the fact that these form quotients span a shorter distance along the stem and are therefore less likely to capture genetic differences among clones.
The clone-mean heritability estimates of measured and predicted volume in this study were comparable but slightly higher than those found by Isik et al. (2004) in their study of loblolly pine rooted cuttings at test sites in Florida and Alabama. Total measured volume had a higher heritability estimate (h2c f( )= 0.94) than either volume estimated by the Amateis and Burkhart (1987) or the Warner-Goebel (1963) model (h2c f( )= 0.85). This larger
heritability estimate suggests that measured volume, calculated using successive diameter measurements in addition to D and H, may capture additional genetic variation among clones that can be exploited for genetic gain.