ADZLAN BIN AINEE
ADZLAN BIN AINEE
A thesis submitted in fulfilment of the requirements for the award of the degree of
Master of Science (Geomatic Engineering)
Faculty of Geoinformation and Real Estate Universiti Teknologi Malaysia
DEDICATION
ACKNOWLEDGEMENT
In preparing this thesis, I was in contact with many people, researchers and academicians. They have contributed towards my understanding and thoughts. In particular, I wish to express my sincere appreciation to my main thesis supervisor, Associate Professor Kamaludin Haji Mohd Omar, for the encouragement, guidance, critics and friendship. I am also very thankful to my co-supervisors Mr. Ahmad Shahlan Mardi and Dr. Nurul Hazrina Idris as well as the other lecturers such as Dr. Dudy Wijawa, Dr. Ami Hassan Md. Din, Dr. Tajul Ariffin Musa and Dr. Abdullah Hisam Omar for their guidance, advices and motivation. Without their continuous support and interest, I might not have the opportunity to complete this study.
ABSTRACT
TABLE OF CONTENTS
CHAPTER TITLE PAGE
DECLARATION ii
DEDICATION iii
ACKNOWLEDGEMENTS iv
ABSTRACT v
ABSTRAK vi
TABLE OF CONTENTS vii
LIST OF TABLES x
LIST OF FIGURES xii
LIST OF SYMBOLS xiv
LIST OF ABBREVIATIONS xv
LIST OF APPENDICES xvii
1 INTRODUCTION 1
1.1 Background of the Study 1
1.2 Problem Statement 3
1.3 Objectives of the Study 4
1.4 Scope of the Study 4
1.4.1 Input Data 6
1.4.2 Area of the Study 7
1.5 Significance of the Study 8
2.3 Coastal Vulnerability Assessment 19
2.3.1 The CVI Variables 20
2.3.1.1Weighted and Non-weighted variables 22 2.3.1.2Mean Tidal Range and Storm Surge 25
2.3.2 Computation of CVI Ranks 26
2.4 Ocean Tidal Study 28
2.4.1 The Moon Attraction Force on Earth 28
2.4.2 Regression of Nodes 31
2.4.3 Theories of Semi Diurnal and Diurnal Tides 32
2.4.4 Harmonic Tidal Analysis 35
2.4.5 Tidal Interpolation Techniques 39 2.4.6 Tidal Spectral Analysis for
Satellite Altimetry Data 42
2.4.7 Tidal Models and Current Status 44
2.5 Satellite Altimetry Principles 45
2.5.1 Altimeter Range Corrections 48
2.5.2 TOPEX’s Tandem Mission Precise Orbit 50
2.5.2.1Tidal Aliasing Effect 51
2.6 Summary of the Chapter 53
3 RESEARCH METHODOLOGY 54
3.1 Introduction 54
3.2 Research Framework 55
3.3 Derivation of SLA 59
3.3.1 TOPEX and Jason-1 SLA Data 59
3.3.2 Range Measurement Corrections 60
3.4 Along-track SLA Validations 63
3.4.1 Selection of Coastal Tidal Stations 63 3.4.2 Altimetry-Tide Gauge Data Correlation 65
3.5 Along track SLA Harmonic Analysis 67
3.5.2 Harmonic Analysis at Crossover Points 69 3.6 Tidal Modelling of the South China Sea 71
3.6.1 Formation of SLA Time Series and Merging
TOPEX and Jason-1 SLA 72
3.6.2 Tidal Spectral Analysis 75
3.6.3 Amplitudes and Phases Data Gridding 75
3.6.4 RMS and RSS Assessment 76
3.7 Computation of Mean Tidal Range 78
3.7.1 Mean Tidal Range Validations 81 3.8 Summary of the Chapter 82 4 RESULTS AND ANALYSIS 83 4.1 Introduction 83
4.2 The SLA Retrieval from RADS 84 4.3 The results of SLA Trend Validations 85 4.4 Harmonic Analysis Results of Along Tracks SLA 91
4.4.1 Harmonic Analysis Results at Coastal Altimetry Data 91 4.4.2 Harmonic Analysis Results at Altimetry Crossover Points 97 4.5 Tidal Spectral Analysis 104
4.6 Tidal Models of the South China Sea 106
4.7 RMS and RSS Analysis 113
4.8 Derivation of Mean Tidal Range from Tidal Models 117
4.9 Mean Tidal Range Ranking Towards the CVI Implementation 121
4.10 Summary of the Chapter 123
5 CONCLUSIONS AND RECOMMENDATIONS 124
5.1 Conclusions 124
5.2 Recommendations 127
LIST OF TABLES
TABLE NO. TITLE PAGE
1.1 Scope of the study 5
1.2 Input data 6
2.1 Suitability classes by area (Berry and BenDor, 2015) 16 2.2 Vulnerable population under different sea level rise
scenario (Abdrabo and Hassaan, 2015) 17
2.3 CVI variables employed by different CVI studies 22 2.4 Values of CVI for vulnerability levels
(Bagdanaviciute et. al, 2015) 23
2.5 CVI scores from estuary and watercourse weighting
(Denner et. al., 2015) 24
2.6 Ranking criteria for CVI variables (Palmer et. al., 2011) 26 2.7 Ranking criteria for CVI variables (Dwarakish et. al., 2009) 27 2.8 Aliased period, of M2, S2, K1 and O1 (Yanagi et. al., 1997) 53 3.1 List of satellite altimeters, phase, cycles, durations and Passes 60
3.2 Corrections applied to range measurement 61
3.3 Altimetry Passes with associated tide gauge stations 65
3.4 Tidal constituents information 67
3.5 Altimetry coastal data validation 68
3.6 Phase A crossover points 70
3.7 Phase B crossover points 70
3.8 List of Phase A Passes and data durations 71
3.9 Tide gauge stations in East Malaysia 77
3.11 Water levels computation 79 3.12 Tidal classification from F value (Pugh, 2004) 81
4.1 TOPEX and Jason-1 SLA processing statistics 84
4.2 Summary of SLA trend validation 88
4.3 Summary of amplitude differences for coastal altimetry data 94 4.4 Standard deviation of amplitudes (cm) and phase (°)
at crossover points 101
4.5 Mean of standard deviation for amplitudes (cm) and phase (°)
derived from altimetry Phase A data 102 4.6 Mean of standard deviation for amplitudes (cm) and phase (°)
derived from altimetry Phase B data 103 4.7 Tidal constituents amplitudes (cm) at predefined tidal stations
obtained from tidal models generated from IDW and Kriging
interpolation techniques and Tide Table 2015 114 4.8 RSS values for IDW and Kriging tidal models 116 4.9 Tidal classification of tide gauge stations 117 4.10 RMS of Mean Tidal Range computed from IDW
and Kriging tidal models 120
4.11 Mean Tidal Range ranking adopted from Abuodha and
Woodroffe, (2010) 122
LIST OF FIGURES
FIGURE NO. TITLE PAGE
1.1 South China Sea (Source: M-map) 7
2.1 Basal mass balance (left) and predicted seal level rise (right)
(Thoma et. al., 2015) 14
2.2 Moon attraction force acting on earth surface (Vella, 2000) 29 2.3 The ecliptic (left) and the moon orbit (right)
(Pugh and Woodworth, 2014) 31
2.4 The earth, moon and semi diurnal tide
(Pugh and Woodworth, 2014) 33
2.5 The earth, moon and diurnal tide (Pugh and Woodworth, 2014) 34
2.6 Phase computation 38
2.7 Variogram fitted with Spherical model
(Oliver and Webster, 2014) 41
2.8 Tidal time series (a) trend removal (b) mean removal
(Emery and Thomson, 2001) 43
2.9 Satellite altimetry measurement principles 47
2.10 TOPEX and Jason-1 51
2.11 Illustration of tidal aliasing effect 52
3.1 Research methodology 56
3.2 Sample of TOPEX Phase A SLA data 62
3.3 Altimetry tracks and locations of tide gauge station 64
3.4 Locations of crossover point 69
3.5 Formation of altimetry SLA time series 73
3.7 The relationships between MHW, MLW and Mean Tidal Range 79 4.1 SLA trend analysis at Bintulu tide gauge station 86 4.2 SLA trend analysis at Geting tide gauge station 87 4.3 Location of Geting tide gauge station (Source: Google map) 87 4.4 Data correlation against distance from tide gauge 90 4.5 The results of harmonic analysis yielded from TOPEX,
Jason-1 and tide gauge data at Labuan, Bintulu, Tioman
and Chendering tidal stations 93
4.6 Mean of amplitude differences for coastal altimetry
harmonic analysis 95
4.7 Mean of phase differences for coastal altimetry
harmonic analysis 96
4.8 Amplitudes of tidal constituents performed at crossover Point 3 98
4.9 Phases of tidal constituents performed at crossover Point 3 98
4.10 Amplitudes of tidal constituents performed at crossover Point 6 99 4.11 Phases of tidal constituents performed at crossover Point 6 100
4.12 Tidal spectral analysis for coastal altimetry data 105
4.13 Tidal spectral analysis for offshore altimetry data 105
4.14 Amplitude of M2 for the South China Sea regions 107
4.15 Phase of M2 for the South China Sea regions 108
4.16 Amplitude of S2 for the South China Sea regions 108
4.17 Phase of S2 for the South China Sea regions 109
4.18 Amplitude of K1 for the South China Sea regions 110
4.19 Phase of K1 for the South China Sea regions 110
4.20 Amplitude of O1 for the South China Sea regions 111
4.21 Phase of O1 for the South China Sea regions 112
4.22 Amplitude RMS computed from the difference of M2, S2, K1 and O1 amplitudes derived from tidal models and Tide Table 2015 115
4.23 Mean Tidal Range derived from IDW and Kriging tidal models And Tide Table 2015 118
LIST OF SYMBOLS
r - Earth radius
D - Distance from point on earth to the centre of moon R - Distance from centre of earth and centre of moon θ - Latitude of point on earth
G - Universal gravitational constant m1 - Mass of the earth
m2 - Mass of the moon
σ - Moon inclination from the equator
α - Declination of moon orbit and the ecliptic ω - Speed of a tidal constituent
- Mean Sea Level (MSL)
HSALT - Altitude of satellite altimeter above reference ellipsoid
N - Geoid heights fc - Nyquist frequency
Ta - Aliasing period of tidal constituents ∆t - Altimetry sampling interval
F - Actual period of tidal constituents
hatm - Atmospheric corrections for range improvement
hssb - Sea state bias correction for range improvement
hIB - Inverse Barometer (IB) correction for range improvement
htides - Tide corrections for range improvement
LIST OF ABBREVIATIONS
IPCC - Intergovernmental Panel on Climate Change ERS - European Remote Sensing Satellite
CVI - Coastal Vulnerability Index SLA - Sea level anomalies
MSL - Mean sea level
RADS - Radar Altimeter Database System
DSMM - Department of Surveying and Mapping Malaysia IDW - Inverse Distance Weighting
FRIS - Filchner-Ronne Ice Shelf USGS - U. S. Geological Survey AHP - Analytical Hierarchy Process LSE - Least Square Estimation SSH - Sea surface height
DORIS - Doppler Orbitography and Radiolocation Integrated by Satellite
SLR - Satellite Laser Ranging GPS - Global Positioning System
SST - Sea Surface Topography
MSS - Mean sea surface
SSB - Sea State Bias
IB - Inverse barometer
RMS - Root Mean Square
LIST OF APPENDICES
APPENDIX TITLE PAGE
A TOPEX and Jason-1 RADS processing statistics 137
B Altimetry along track SLA trend validations 141
C Harmonic analysis at altimetry crossover points 149
INTRODUCTION
1.1 Background of the Study
The increase in sea level around the world attracts global attention. The increase in global sea level is prominently known as sea level rise has been studied by many researchers. The escalation in awareness regarding the sea level rise phenomenon leads to numerous studies in related fields to assess the future impacts as well as improving the understanding related to the sea level rise.
Sea level rise is a result from the increase in global temperature. This has introduced the world to a threat called global warming. Due to the temperature gradient, the rise in global temperature transfers the heat to the ocean’s surface and subsequently causing the ocean’s volume to increase. Theoretically, the water particles gain energy when each of the particles receives heat and causing the water volume to expand. In this context heat is absorbs from the sea surface. Consequently, the increase in ocean’s volume is called ocean’s thermal expansion and many believed that this phenomenon is the main driver to sea level rise phenomenon.
Apart from ocean’s thermal expansion, another factor whose the impact contributing to the sea level rise is the melting glaciers (Church et. al., 2010). Similarly to the ocean’s thermal expansion, the melting glaciers and polar ice caps are also triggered by the global warming. As mentioned earlier, those factors contributing to sea level rise are the resultant from global warming phenomenon. The rise in global temperature is yielded by the increase in greenhouse gas to the air (Church et. al., 2010). The increase in greenhouse gas amount to the air is believed to be the primary factor to amplify the rate of sea level rise in future.
Coastal areas are the most affected areas due to the sea level rise phenomenon. In fact, the sea level rise has the potential to permanently alter the coastal areas due to its association to land inundation, flooding in low-lying areas, contributes to coastal erosion and leads to saltwater intrusion into fresh water (Church et. al., 2010). Thus, it is important to evaluate the susceptibility of a coastal area to provide mitigation measures and subsequently alleviate the impending impacts of sea level rise.
One of most important coastal parameter used to assess the vulnerability of a coastal area to the impacts of sea level rise is the Mean Tidal Range. Mean Tidal Range parameter is commonly derived from tide gauge data. The use of tide gauge data is inarguably accurate and feasible to conduct site specific coastal vulnerability study. However, in order to conduct coastal vulnerability study over a larger area for instance conducting study at national level, the distribution of tidal stations along coastal regions is apparently insufficient. The inadequacy of tidal stations distribution is exacerbated by the fact that tides in shallow water region is extremely localized to the location where the tidal station is located (Hok, 2012).
1.3 Objectives of the Study
The aim of the study is to generate tidal models from TOPEX and Jason-1 SLA data to assess the impending sea level rise threats particularly in Malaysian coastal regions. Three objectives have been outlined in order to achieve the aim of the study. The objectives are as follows:
i) To generate tidal models for South China Sea from TOPEX and Jason-1 SLA data.
ii) To validate the tidal models from tide gauges data.
iii) To derive Mean Tidal Range from tidal models for Malaysian coasts.
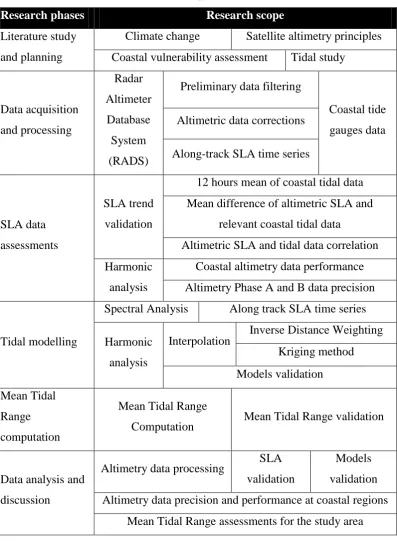
1.4 Scope of the Study
and planning Coastal vulnerability assessment Tidal study Data acquisition and processing Radar Altimeter Database System (RADS)
Preliminary data filtering
Coastal tide gauges data Altimetric data corrections
Along-track SLA time series
SLA data assessments
SLA trend validation
12 hours mean of coastal tidal data Mean difference of altimetric SLA and
relevant coastal tidal data
Altimetric SLA and tidal data correlation Harmonic
analysis
Coastal altimetry data performance Altimetry Phase A and B data precision
Tidal modelling
Spectral Analysis Along track SLA time series Harmonic
analysis
Interpolation
Inverse Distance Weighting Kriging method Models validation Mean Tidal
Range computation
Mean Tidal Range
Computation Mean Tidal Range validation
Data analysis and discussion
Altimetry data processing SLA validation
Models validation Altimetry data precision and performance at coastal regions
Mean Tidal Range assessments for the study area
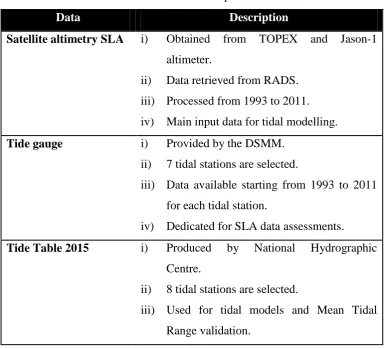
1.4.1 Input Data
There are 3 main input data used such as SLA obtained from satellite altimeter, tide gauge data for various locations provided by Department of Surveying and Mapping Malaysia (DSMM) and tidal constituents from Tide Table 2015 produced by National Hydrographic Centre. These data are used for tidal modelling and data validation purposes. Table 1.2 describes the input data involve in tidal modelling and data validations.
Table 1.2 : Input data
Data Description
Satellite altimetry SLA i) Obtained from TOPEX and Jason-1 altimeter.
ii) Data retrieved from RADS. iii) Processed from 1993 to 2011. iv) Main input data for tidal modelling. Tide gauge i) Provided by the DSMM.
ii) 7 tidal stations are selected.
iii) Data available starting from 1993 to 2011 for each tidal station.
iv) Dedicated for SLA data assessments. Tide Table 2015 i) Produced by National Hydrographic
Centre.
ii) 8 tidal stations are selected.
feature to facilitate further analysis.
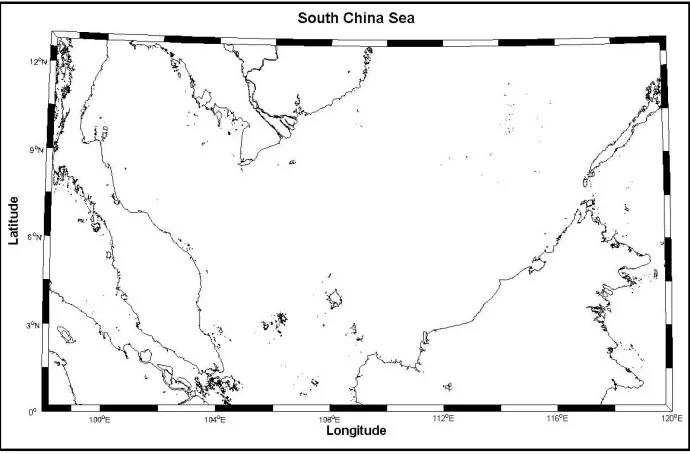
1.4.2 Area of the Study
South China Sea is located in South East Asia region and bordered by several countries such as China, Philippines, Brunei, Malaysia, Singapore and Vietnam. It also interacts with Pacific Ocean in north-east region and Celebes Sea in the eastern part. The southern region of the South China Sea is selected for further tidal modelling purpose due to its immense influence to Malaysia coastal regions. The area subject for tidal modelling covers from latitude 0° N to 13° N and longitude 98° E to 120° E. Figure 1.1 shows the southern part of the South China Sea.
The South China Sea is selected due to the availability of satellite altimetry tracks in the region and the suitability of its location to conduct the study. The availability of altimetry tracks is vital since altimetry data is the sole data input used to model the tides in the region. Furthermore, the presence of heavy industries, dense human settlements and tourism activities across Malaysian coasts increase the demand to monitor coastal regions particularly to alleviate the impacts to coastal hazards and subsequently contribute to a better coastal management and planning.
1.5 Significance of the Study
Current situation has indicated that the impacts of climate change are getting much severe than last few centuries. Sharp varying weather and the increase in storm intensity and frequency are the indications of weather responses to the climate change. Therefore, the implementation of coastal assessment due to the sea level rise phenomenon proposed in this study is expected to benefit coastal management and planning, providing alternative source of data for coastal assessment and introducing to the use to satellite altimetry data instead of sole dependency on tide gauge data.
tidal behaviour (Hok, 2012), expensive operation and maintenance. Therefore, the proposition of the use of tidal models generated for the South China Sea is the most plausible solution as an alternative to accommodate the scarcity of tide gauge network along Malaysian coasts. The use of tidal models allows the computation of Mean Tidal Range parameter at any location along Malaysian coastal regions.
The satellite altimetry data is utilized to generate the tidal models such as TOPEX and Jason-1 SLA data. Satellite altimetry technique provides more reliable data to generate tidal models in term of providing long term sea level time series. Continuous sea level data is one of the criteria to produce a good tidal model. Moreover, sea level measured by the satellite altimeter is the absolute sea level which implies to vertical land motion free sea level data. As opposed to satellite altimetry data, tide gauge data is rarely continuous and hampered by the effect of vertical land motion (Feng et. al., 2013). Absolute sea level data is an important feature in sea level rise study due to the fact that sea level rise is measured in milimeter level which the vertical land motions posed a great influence and consequently needs considerable attention.
1.6 Summary of the Chapter
This Chapter 1 discusses the global and local sea level rise issues as well as the impacts induced by the sea level rise phenomenon particularly towards coastal vicinity. Consequently, coastal vulnerability assessment is indispensable in order to study the impending impacts of the sea level rise, identify the severity of an area due to the sea level rise impacts and assist local authority and decision makers to provide preventive and mitigation measures.
The use of Mean Tidal Range parameter in this study is justified by its influence and potential to exacerbate the impacts of sea level rise and posed permanent changes in coastal setting. The paucity of tidal stations distribution along has hindered the implementation of coastal vulnerability assessment at national level. Thus, this study has suggested the use of tidal models instead of the use of tide gauge data to compute Mean Tidal Range parameter for Malaysian coastal region.
The methodology of the study is briefly explained in this chapter. This methodology is basically introduced to achieve the objectives of the study, outline the scope of the study and provide justification of the input data involved and the significance of study area selected in this study.
Delta coastal urban areas. Urban Climate xxx (2015) xxx–xxx.
http://dx.doi.org/10.1016/j.uclim.2015.09.005
Abuodha, P. A. O. and Woodroffe, C. D. (2010). Assessing vulnerability to sea-level rise using a coastal sensitivity index: a case study from southeast Australia. J
Coast Conserv (2010) 14:189–205. DOI 10.1007/s11852-010-0097-0.
Ami Hassan Md Din (2014). Sea Level Rise Estimation and Interpretation in
Malaysian Region Using Multi-Sensor Techniques. Doctor Philosophy, Universiti
Teknologi Malaysia, Skudai.
Andersen, O. B. and Scharroo, R. (2011). Range and Geophysical Corrections in
Coastal Regions: And Implications for Mean Sea Surface Determination. In
Vignudelli, S., Kostianoy, A. G., Cipollini, P. and Benveniste, J. Coastal
Altimetry. (pp. 103-145). Berlin: Springer-Verlag.
Andersen, O. B., (2010). The DTU10 Gravity field and Mean Sea Surface (2010). Second International Symposium of the Gravity Field of the Earth (IGFS2), Fairbanks, Alaska.
Andersen, O. B. (2003). International Association of Geodesy Symposia, Vol. 126, International Workshop on Satellite Altimetry. Springer-Verlag Berlin Heidelberg 2003
Bagdanaviciute, I., Kelpsaite, L. and Soomere, T. (2015). Multi-criteria evaluation approach to coastal vulnerability index development in micro-tidal low-lying areas. Ocean & Coastal Management 104 (2015) 124e135.
http://dx.doi.org/10.1016/j.ocecoaman.2014.12.011
Bendat, J.S., Piersol, A.G. (1971). Random Data: Analysis and Measurement Procedures. Wiley-Interscience, New York.
Benveniste, J. (2011). Radar Altimetry: Past, present and Future. In Vignudelli, S., Kostianoy, A. G., Cipollini, P. and Benveniste, J. Coastal Altimetry. (pp. 1-18). Berlin: Springer-Verlag.
Berry, M. and BenDor, T. K. (2015). Integrating Sea Level Rise into Developement Suitability Analysis. Computers, Environment and Urban Systems, 51, 13-24. Elsevier. http://dx.doi.org/10.1016/j.compenvurbsys.2014.12.004
Bosello, F. and Cian, E. D. (2014). Climate change, sea level rise, and coastal disasters. A review of modeling practices. Energy Economics 46 (2014) 593–605.
http://dx.doi.org/10.1016/j.eneco.2013.09.002
Cazenave, A. and Nerem, R. S. (2004). Present-day sea level change: observations and causes. Rev. Geophys. 42, RG3001. doi:10.1029/2003RG000139.
Cheng, Y., Andersen, O. (2011). Multimission empirical ocean tide modeling for shallow waters and polar seas. J. Geophys. Res. 116, C11001.
http://dx.doi.org/10.1029/2011JC007172.
694). Cambridge Univ. Press, New York.
Davis, D., Sutherland M., Jaggan, S. (2010). Augmenting Tide Gauge Data with Satellite Altimetry in the Observation of Sea Level Rise in the Caribbean. FIG
Congress 2010, Facing the Challenges – Building the Capacity, Sydney,
Australia, 11-16 April 2010.
Denner, K., Phillips, M. R., Jenkins, R. E. and Thomas, T. (2015). A coastal vulnerability and environmental risk assessment of Loughor Estuary, South Wales. Ocean & Coastal Management 116 (2015) 478e490.
http://dx.doi.org/10.1016/j.ocecoaman.2015.09.002
Din, A. H M. & Omar, K. M. (2009). Sea Level Change in the Malaysian Seas from Multi-Satellite Altimeter Data. Jurnal Teknologi. Universiti Teknologi Malaysia.
Ducet, N., Le Traon, P., Reverdin, G. (2000). Global high resolution mapping of ocean circulation from TOPEX/Poseidon and ERS-1 and -2. J. Geophys. Res. 105 (C8), 19477-19498.
Dwarakish, G. S., Vinay, S. A., Natesan, U., Asano, T., Kakinuma, T., Venkataramana, K.,Pai, B. J. and Babita, M. K. (2009). Coastal vulnerability assessment of the future sea level rise in Udupi coastal zone of Karnataka state, west coast of India. Ocean & Coastal Management, 52, 467–478. Elsevier. doi:10.1016/j.ocecoaman.2009.07.007
Emery, W. J. and Thomson, R. E. (2001). Data Analysis Methods in Physical Oceanography (2nd and Revised Ed.). Amsterdam: Elsevier Science.
Feng, G., Jin, S., Zhang, T. (2013). Coastal Sea Level Changes in Europe from GPS, Tide Gauge, Satellite Altimetry and GRACE, 1993-2011. Advances in Space
Fu, L. L., Chelton, D. B., and Zlotnicki, V. (1988). Satellite altimetry: Observing ocean variability from space. Oceanography 1(2):4, http://dx.doi.org/10.5670/oceanog.1988.01.
Gornitz, V. M., Daniels, R. C., White, T. W., and Birdwell, K. R. (1994). The development of a Coastal Vulnerability Assessment Database: Vulnerability to sea-level rise in the U.S. Southeast: Journal of Coastal Research Special Issue No. 12, p. 327-338.
Gornitz, V., White, T.W., (1992). A Coastal Hazards Database for the U.S. West Coast: ORNL/CDIAC-81, NDP-043C. Oak Ridge National Laboratory, Oak Ridge, Tenn. http://cdiac.ornl.gov/epubs/ndp/ndp043c/43c.htm.
Gornitz V. M., White T. W. and Cushman R. M. (1991). Vulnerability of the U.S. to
future sea-level rise. In Proceedings of Seventh Symposium on Coastal and
Ocean Management. Long Beach I. (pp. 2354-2368). CA USA), 1991.
Green, J. A. M. and David, T. W. (2013). Non-assimilated tidal modeling of the South China Sea. Deep-Sea Research, I78(2013)42–48. dx.doi.org/10.1016/j.dsr.2013.04.006
Hok, S. F. (2012). Ocean Tides Modeling using Satellite Altimetry. Report No. 501. Geodetic Science. Ohio State University. Columbus, Ohio 43210.
the intergovernmental panel on climate change. Cambridge, United Kingdom and New York, NY, USA: Cambridge University Press.
Isobe, M. (2013). Impact of global warming on coastal structures in shallow water.
Ocean Engineering 71 (2013) 51–57. http://dx.doi.org/10.1016/
j.oceaneng.2012.12.032
Li, J. and Heap, A. D., (2008). A Review of Spatial Interpolation Methods for
Environmental Scientists. Geoscience Australia, Record 2008/23, 137 pp.
Matsumaru, R., Nagami, K. and Takeya, K. (2012). Reconstruction of the Aceh Region following the 2004 Indian Ocean tsunami disaster: A transportation perspective. IATSS Research 36 (2012) 11–19. doi:10.1016/j.iatssr.2012.07.001.
Matsumoto, K., Takanezawa, T., Ooe, M. (2000). Ocean Tide Models Developed by Assimilating TOPEX/POSEIDON Altimeter Data Into Hydrodynamical Model: A Global Model and a Regional Model around Japan. Journal of Oceanography, Vol. 56, pp. 567 to 581
Musa, R., Draman, S., Jeffrey, S., Jeffrey, I, Abdullah, N., Halim, N. A. M., Wahab, N. A., Mukhtar, N. Z. M., Johari, S. N. A., Rameli, N., Midin, M., Jaafar, N. R. N., Das, S. and Sidi, H. (2014). Post tsunami psychological impact among survivors in Aceh and West Sumatra, Indonesia. Comprehensive Psychiatry 55 (2014) S13–S16. http://dx.doi.org/10.1016/j.comppsych.2012.12.002.
Oliver, M. A. and Webster, R., (2014). A tutorial guide to geostatistics: Computing and modelling variograms and Kriging. Catena 113 (2014) 56-69. http://dx.doi.org/10.1016/j.catena.2013.09.006.
Omar, K. M. (2004). Monograf Pelarasan Data Spatial 1. Fakulti Kejuruteraan dan Sains Geoinformasi: Universiti Teknologi Malaysia.
Oreiro, F. A., D’Onofrio, E., Grismayer, W., Fiore, M. and Saraceno, M. (2014). Comparison of tide model outputs for the northern region of the Antarctic Peninsula using satellite altimeters and tide gauge data. Polar Science 8 (2014) 10-23. http://dx.doi.org/10.1016/j.polar.2013.12.001
Overpeck, J.T.,Weiss, J.L., 2009. Projections of future sea level becoming more dire. PNAS 106, 21461–21462. http://dx.doi.org/10.1073/pnas.0912878107.
Palmer, B.J., Van der Elst, R., Mackay, F., Mather, A.A., Smith, A.M., Bundy, S.C., Thackeray, Z., Leuci, R., Parak, O., (2011). Preliminary coastal vulnerability assessment for KwaZulu-Natal, South Africa. J. Coast. Res. 64, 1390e1395. ICS 2011 Proceedings, Poland.
Pawlowicz, R., Beardsley, B. and Lentz, S. (2002). Classical tidal harmonic analysis including error estimates in MATLAB using T_TIDE. Computers and
Geosciences 28 (2002), 929-937.
Pendleton, E. A., Barras, J. A., Williams, S. J. and Twichell, D. C. (2010). Coastal vulnerability assessment of the Northern Gulf of Mexico to sea-level rise and coastal change: U.S. Geological Survey. Open-File Report 2010-1146, at
http://pubs.usgs.gov/of/2010/1146/.
Primavera, J. H., Cruz, M. D., Montilijao, C., Consunji, H., Paz, M. D., Rollon, R. N., Maranan, K., Samson, M. S. and Blanco, A. (2016). Preliminary assessment of post-Haiyan mangrove damage and short-term recovery in Eastern Samar, central Philippines. Marine Pollution Bulletin xxx (2016) xxx–xxx. http://dx.doi.org/10.1016/j.marpolbul.2016.05.050.
Pugh, D. and Woodworth, P. (2014). Sea-Level Science: Understanding Tides,
Surges, Tsunamis and Mean Sea-Level Changes (2nd Ed.). Cambridge:
Cambridge University Press.
Pugh, D. (2004). Changing Sea Levels Effects of Tides, Weather and Climate. Southampton: Cambridge University Press.
Purwanto, H. (2006). Determination of Tidal Constituents and Prediction Based on
Short Observation Period. In Othman, R. Hydrographic Survey Current Trends,
Techniques and Applications. (pp. 233-247). Malaysia: Universiti Teknologi
Malaysia.
Rahmstorf, S., 2007. A semi-empirical approach to projecting future sea-level rise.
Science 325, 368–370.
Ray, R. D., Egbert, G. D. and Erofeeva, S. Y. (2011). Tide Predictions in Shelf and
Coastal Waters: Status and Prospects. In Vignudelli, S., Kostianoy, A. G.,
Reyes, S. R. C., Blanco, A. C. (2012). Assessment of Coastal Vulnerability to Sea Level Rise of Bolinao, Pangasinan Using Remote Sensing and Geographic Information Systems. Inetrnational Archieves of the Photogrammetry, Remote
Sensing and Spatial Information Sciences, Volume XXXIX-B6, 2012. XXII
ISPRS Congress, 25 August – 01 September 2012, Melbourne, Australia
Small, C., Nicholls, R. J., 2003. A global analysis of human settlement in coastal zones. J. Coast. Res. 19 (3), 584–599.
Smith, A. J. E., Ambrosius, B. A. C., Wakker, K. F., Woodworth, P. L., Vassie, J. M. (1997). Comparison between the harmonic and response methods of tidal analysis using TOPEX/POSEIDON altimetry. Journal of Geodesy (1997) 71: 695-703.
Szlafsztein, C. and Sterr, H. (2007). A GIS-based vulnerability assessment of coastal natural hazards, state of Para,Brazil. Journal of Coastal Conservation, 11, 53-66. doi: 10.1007/s11852-007-0003-6
Taborda, R. and Ribeiro, M. A. (2015). A simple model to estimate the impact of sea-level rise on platform beaches. Geomorphology 234 (2015) 204–210.
http://dx.doi.org/10.1016/j.geomorph.2015.01.015
Thoma, M., Determann, J., Grosfeld, K., Goeller, S. and Hellmer, H. H. (2015). Future sea-level rise due to projected ocean warming beneath the Filchner Ronne Ice Shelf: A coupled model study. Earth and Planetary Science Letters 431 (2015) 217–224. http://dx.doi.org/10.1016/j.epsl.2015.09.013
Tibbetts, J. R. and Proosdij, D. V. (2013). Development of a relative coastal vulnerability index in a macro-tidal environment for climate change adaptation. J
Coast Conserv (2013) 17:775–797. DOI 10.1007/s11852-013-0277-9
a Test Section of the ASEAN region. 22nd Asian Conference on Remote Sensing. November 5-9, 2001. Singapore: National University of Singapore.
Vella, J. P. (2000). The Development of Tide Models for the Exclusive Economic
Zone (EEZ) of Malaysia Using Satellite Altimetry. Master Thesis. Universiti
Teknologi Malaysia.
Yanagi, T., Morimoto, A., Ichikawa, K. (1997). Co-Tidal and Co-Range Charts for the East China Sea and the Yellow Sea Derived from Satellite Altimetric Data.