Copyright 6 1995 by the Genetics Society of America
Estimating Interference and Linkage Map Distance from Two-Factor Tetrad Data
Franklin W. Stahl*
*+and Russell Lande
*
*Department of Biology and Institute of Molecular Biology, University of Oregon, Eugene, Oregon 97403
Manuscript received September 6, 1994 Accepted for publication December 8, 1994
ABSTRACT
We present methods for using the model of Foss, LANDE, STAHL and STEINBERG to estimate interfer- ence and map distances from twefactor tetrad data. We illustrate the application of the methods with data from Neurospora and from Saccharomyces.
F
O S S et al. ( 1993) offered a biologically based model for chiasma interference. The model is simple, mathematically tractable and flexible and has passed stringent tests of adequacy. The model successfully de- scribes the dependence of the four-point coefficient of coincidence ( S , ) on the map distance separating two short intervals for both Drosophila and Neurospora (Foss et al. 1993), and it describes the distribution of exchanges along the linkage map of the Drosophila Xchromosome for tetrads of ranks I, I1 and 111, respec- tively ( LANDE and STAHL 1993)
.
MCPEEK and SPEED(1995) have demonstrated the superior ability of the model to account for the frequencies of all genotypes arising in a Drosophila cross involving nine linked markers. Models leading to the same equations as those of Foss et al. were presented earlier (COBBS 1978;
STAHL 1979; STAM 1979) but were not widely embraced, perhaps because the formalizations were neither based on a clear biological mechanism nor subjected to rigor- ous tests of adequacy.
The complete mathematical treatments by MCPEEK and SPEED ( 1995) and by ZHAO et al. ( 1995) subsume the analysis given here. Our aim is to provide a user- friendly treatment of a particular example often encoun- tered in tetrad analysis. We offer it for several reasons: ( 1 ) The formalisms of our model provide a more coher- ent description of linkage data than do other models. ( 2) For some fungi, the only data available for estimating interference, and hence determining the best mapping function, may be two-factor tetrad data. ( 3 ) For Sacchar- omyces, gene conversion intrudes upon estimates of con- ventional tetrad types, even for moderately long inter- vals. Methods for estimating interference by tetrad analysis of two-factor crosses minimizes that confusion by using the fewest possible marked loci, and those loci are well separated so that conversions of the markers are rare relative to reciprocal recombination.
Tetrad analysis of two-factor crosses provides informa-
Cmesponding ~ u t f i ~ : F. W. Stahl, Institute of Molecular Biology,
University of Oregon, Eugene, OR 97403-1229. E-mail: [email protected]
Genetics 139 1449-1454 (March, 1995)
tion on both the recombination frequency ( R ) for the marked interval and the intensity of interference from the frequencies ( P D , T and NPD) of Parental Ditype, Tetratype, and Nonparental Ditype tetrads, respectively.
R is directly calculated, without assumptions, as R =
NPD
+
(x)
T.Interference can be sensitively detected by tetrad analysis of two-factor crosses ( PAPAZIAN 1952; STRICK- LAND 1958; PERKINS 1962a). However, interference
(and map distance) in a two-factor cross can be quanti- fied only with the aid of a model. In the model of
BARRATT et al. (1954), interference is embodied in a parameter, k . Their model, like that of FOSS et al., as- sumes the absence of chromatid interference as well as of sister exchanges that can interfere with exchanges between homologues.
map length that can be calculated from the observed frequency of recombinant haploid products ( R ) using the relationship R =
(x)
( 1 - e - 2 x ),
which relates R to map length, X (in Morgans), in the assumed absence of interference. From this estimate of X , the model calculates the frequency of non-exchange tetrads as to= e - 2 x , where 2 X is the mean number of a priori inter- homologue exchanges per tetrad and to is the fraction of tetrads with no exchanges in the interval calculated from that mean according to the Poisson distribution.
The model of BARRATT et al. states that the value of to is independent of the value of the interference parameter k ; i.e., interference is presumed to alter only the frequencies of tetrads with exchanges. The new probability for tetrads with r exchanges in the marked interval is obtained by mutiplying the a @“i (Poisson) frequency for that rank of tetrad by k ( r - l ) . This proce- dure alters the frequencies of the a
p”
tetrads, and a normalization factor, applied to tetrads with one or more exchanges, restores the sum of frequencies of all tetrads to unity.Although the interference parameter, k , has no iden- tified biological basis, the model does allow one to re- late frequencies of tetrad types with estimated map d i s
1450 F. W. Stahl and R. Lande
TABLE 1
Symbols employed
Symbol Definition
R X s4 PD NPD T PD NPD T
k
t,
m C
c,
c o
Y
Pi
p:
Recombination frequency Linkage map distance (Morgans) Four-point coefficient of coincidence Parental ditype tetrads
Nonparental ditype tetrads Tetratype tetrads
Frequency of PDs Frequency of NPDs Frequency of Ts
Interference constant ( B m n et al. 1954) Probability of tetrad of rank r (BARRATT et al. 1954) Interference constant (Foss et al. 1993)
Conversion, visible or cryptic C with associated crossover C without associated crossover Mean number of Cs in an interval Probability of iCs
Probability of 6 . s
NPD
0.25
I
0.20.1 5
0.1
0.05
0.25 0.5 0.75 1 1.25 1.5 1.75 2
tances. BARRATT et al. demonstrated that a given value of k gave a reasonable fit both to tetrad type frequencies in two-factor crosses and to the relationship between R
and X (the mapping function), compatible with the assumption of negligible chromatid interference. SNOW
(1979) introduced the use of maximum likelihood methods for the calculation of k from the frequencies of tetrad types.
The model of BARRATT et al. and the procedure of SNOW are widely used by fungal geneticists. KING and
MORTIMER ( 1991 ) have offered an improved version of the model and maximum likelihood equations for its application. Both of these models, however, are count- location models, which violate the well-established rule, illustrated for Neurospora and Drosophila in
Foss
and STAHL ( 1995 ) and for Saccharomyces in KING and MOR-TIMER ( 1990), that chiasma interference increases (co- efficient of coincidence decreases) as the distance be- tween the intervals examined goes to zero (MCPEEK and SPEED 1995)
.
In the model of FOSS et al., as in that of BARRATT et al., the distribution of exchanges is arrived at by a modification of the Poisson distribution. For FOSS et al., the underlying Poisson distribution is the distribu- tion of Cs, events that could lead to conversions were there markers to reveal them. Cs are resolved as non- crossovers ( C o s ) or as crossovers (C,s)
.
Interference is introduced by the assumption that a fixed number, m , of Cos falls between neighboring C,s. (Within the framework of the double chain break model for re- combination [ SZOSTAK et al. 19831 , the assumption of a fixed number of Cos is a rule governing the resolu- tion of an intermediate that is common to Cos and C,s.) Thus, m is the interference parameter in ourMap
distance,
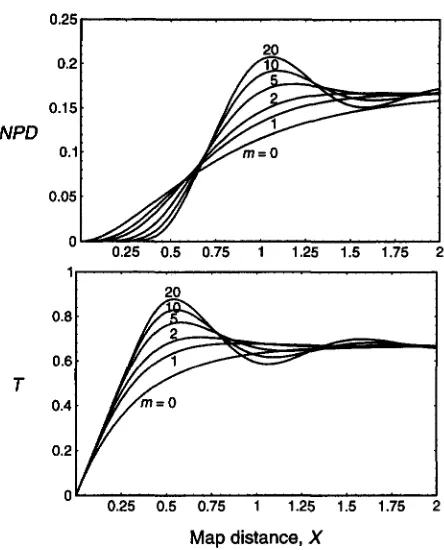
XFIGURE 1.-Nonparental ditype ( N P D ) and tetratype ( T ) tetrad frequencies as functions of map distance, X , for various values of m (see RESULTS) according to the model of FOSS et al. ( 1993).
model. In a simple world, m , as well as k , might be species- or chromosome-specific. Should m or k or any other interference parameter prove to be region- or locus-specific, the hope of establishing a theoretical relationship between R and Xfor an entire chromo- some arm would be thwarted.
A k value of 0.2 was found by BARRATT et al. to be suitable for predicting tetrad type frequencies for both Neurospora and Drosophila. Using different, more stringent criteria, Foss et al. found that m differs be- tween Neurospora and Drosophila. In the first instance,
m is calculated from the observed fraction of Cs that are C,s. These m values, 2 for Neurospora and 4 for Drosophila, were then seen to give optimal fits of the model to the observed dependence of the coefficient of coincidence on map distance between intervals. The value of m = 4 for Drosophila was further substantiated by the ability of the model so evaluated to describe the distribution of exchanges along X chromosomes from tetrads of different rank ( LANDE and STAHL 1993). The
suitability of the m values of 4 for Drosophila and 2 for Neurospora was further confirmed by the analyses of ZHAO et al. 1995.
RESULTS
Estimating Interference 1451
Tetratype frequency, T
As in Foss et al.,
y
= 2 ( m+
1 ) Xis the mean number of C events per X Morgans, andp ,
= y i e - ? / i! is the probability of i C events per XMorgans. Then, definingas the probability of j C, events per X Morgans,
m
m + 1 - i pi > i=O
and
where
I
i ( is the absolute value of i.and PD are as follows ( MATHER 1935) :
In tetrads with j C, events, the frequencies T, NPD
For j = 0: T = 0 , NPD = 0 , PD = 1.
For j = 1: T = 1, NPD = 0 , PD = 0.
F o r j z 2: T = % [ l - ( -
X ) ' ] ,
N P D = P D = ( % ) ( 1 - T ) .
Among all tetrads
m
T = PI
+
% [ l - ( - % ) J ] P j , J = 2m
NPD=
E%[%
+
( - % ) j I P j , j = 2PD = PO
+
NPD.Figure 1 depicts NPD and T us. X for various values of m from 0 to 20. Note that T
+
NPD+
PD = 1, and that for X 9%,
T - +%,
NPD-r'/6
and PD-rx.
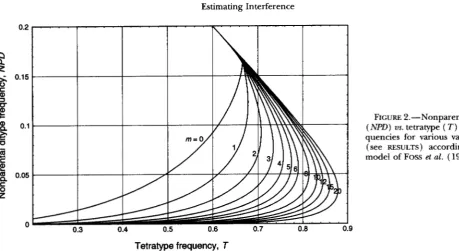
Selecting a value of m from two-factor data: In Fig- ure 2, NPD is graphed vs Tfor various values of m. Since
0.7 0.8
FIGURE 2.-Nonparental Ditype ( N P D ) us. tetratype ( T ) tetrad fre- quencies for various values of m (see RESULTS) according to the model of FOSS et al. (1993).
0. 9
the curves do not cross each other (except possibly for values of X
>
1 ),
each pair of NPD, T values is deter- mined by a unique value for m. To estimate m from experimental data, plot the observed NPD, T value on ( a xerographic copy of) Figure 2. If the point falls conspicuously closer to one curve than to any other, take that as your estimate of m. Armed with that esti- mate, one can select a mapping function from the list below(Foss
et al. 1993) :R =
%
( 1 - e - 2 x ) for m = 0 ,R = %[1 - (1
+
2X) e - 4 x ] for m = 1,R = %[1
-
(1+
4X+
6x2) e - 6 x ] for m =2,
1
+
6X+ 16x2+
3for m = 3,
y
= 2 ( m + l ) X for m 2 4.EXAMPLES
Neurospora: PERKINS ( 1962b, Table 7) observed the following numbers of tetrad types for the cr- os interval:
123 PD, 60 NPD and 418 T. The fraction of Ts is 0.696;
the fraction of NPDs is 0.100. This point falls closest to the NPD us. T curve for m = 2, in agreement with the value for m estimated by Foss et al. for Neurospora both from the C,/C ratio and the dependence of S,
1452 F . W. Stahl and R. Lande
NPD
NPD0.2 I I 1 I I
T
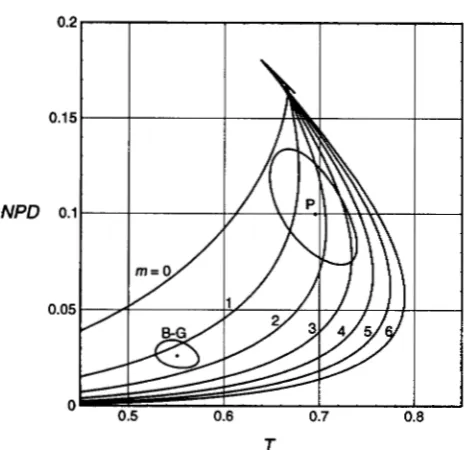
FIGURE 3.-Estimating m for two sets of Neurospora tetrad data. Data points ( P and B G ) are from PERKINS ( 1962b) and BOLE-GOWDA et al. ( 1962), respectively. The 95% confidence regions around each point are calculated according to the APPENDIX.
(Figure 3 ) . With m = 2 and with R = 0.448 t 0.011 determined from the frequencies of tetrad types, we estimate map distance Xwith the appropriate mapping function (by numerical approximation) to be 69.1 t
5.1 cM with an approximate 95% confidence interval of (60.5-82.0). This is (not significantly) larger than the map distance, 64.7, computed from the conven- tional 50 ( T
+
6NPD ) ( PERKINS 1949) , which assumes a maximum of two exchanges.BOLE-GOWDA et al. (1962, Table 1 ) noted 1238 PDs, 76 NPDs and 1614 Ts for the hzst-2 to aurinterval. The fraction of Ts is 0.551 and of NPDs is 0.026. These fractions determine a point about midway between the curves for m = 1 and m = 2, with a nonelliptical confi- dence region that includes the m = 1 curve and almost includes that for m = 2 (Figure 3 )
.
Saccharomyces: Foss et al. ( 1993) failed to deal with yeast data because of the confusion resulting from gene conversions. As described above, this confusion is largely avoided in the present analysis because only two markers are involved, and they are far apart so that conversion is rare relative to reciprocal recombination. FOGEL et al. (1981) reported data on the C,/C ratio for several linked yeast markers. When they corrected their data for incidental exchanges (assuming no inter- ference between a C, and nearby C,s) , the mean C,/
C value was 0.37 with a range from 0.18 to 0.66 in five estimates. Assuming these data are like the Neurospora data in general features, a correction within the frame- work of the model of FOSS et al. would drop the C,
/
C ratio-lo%,
to a mean of 0.33 with range from 0.16 toT
FIGURE 4.-Estimating m for six sets of Saccharomyces tet- rad data. The data point marked M&H is from MORTIMER and HAWTHORNE ( 1966) ; the other points are from KING and MORTIMER ( 1991 )
.
The 95% confidence regions around each point are calculated according to the APPENDIX.0.60 ( PERKINS et al. 1993)
.
This value for C,/ C implies m = 2, with appreciable uncertainty. These C,/C ratios have about the same mean value as do the values from Neurospora (mean = 0.30 ? 0.01) (PERKINS et al. 1993). However, the Neurospora data have a narrower range, 0.18 to 0.38 in nine estimates.MORTIMER and HAWTHORNE ( 1966, Table 2 ) re- ported one interval for which 23 NPDs were scored. The PDs and Ts were 101 and 259, respectively. These values imply m =
2,
with the confidence region compati- ble with m = 1 or 3 (Figure 4 ) .KING and MORTIMER (1991, Table 4 ) presented tet-
rad data for several long ( X
>
0.5) intervals, recon- structed on the assumption of no chromatid interfer- ence. The NPD vs. Tvalues for these intervals are shown, with their 95% confidence areas, in Figure 4.There is considerable heterogeneity in the m values among the yeast data sets in Figure 4. Four of the data sets are compatible with m = 2, but two data sets indi- cate larger values of m , one in the range of 4 to 5 and the other in the range of 5-9.
DISCUSSION
Estimating Interference 1453
The value m = 2 obtained from the frequencies of Neurospora tetrad types is the same as that obtained from the observation that about 1
/
3 of conversions are accompanied by crossovers and from the fit of the model evaluated at m = 2 to the data for S, us. X ( FOSS et al. 1993).
The model of
Foss
et al. is an extension of a proposal by MORTIMER and FOGEL ( 1974) that Cs are Poisson- distributed but that the two subclasses, C, and C,, alter- nate with each other. Their proposal was based on ob- servations made in Saccharomyces. However, the vari- ability in the estimates of m manifest in Figure 4 suggest that the application of the model to yeast will not be as straightforward as it appears to be for Neurospora (and seeFoss
and STAHL 1995).
ZHAO et al. ( 1995) report similar high variability in estimates of m from other sets of Saccharomyces data.We note that for R
<
about 0.2 our estimate of Xwill be nearly the same as that of PERKINS (1962b). For 0.4<
R<
0.5, our estimate of Xwill be substantially larger than that of PERKINS, but, unless the sample size is very large ( n = thousands), the estimates are not likely to be significantly different. Nevertheless, because our method is based on equations that provide a good de- scription of interference, estimates of X derived by our method will generally be more accurate than those ob- tained by previous methods of analyzing two-point tet- rad data.Our text benefited from discussions with ERIC Foss, JEFF KING,
MARY SARA Mc PEEK, DAVID PERKINS, TERRY SPEED and HONGW ZHAO .
This work was supported by National Institutes of Health (NIH) grant GM-33677 and National Science Foundation grant DMB8905310 to F.W.S. and by NIH grant GM-27120 to R.L. F.W.S. is American Cancer Society Research Professor of Molecular Genetics.
LITERATURE CITED
BARRATT, R. W., D. Newmeyer, D. D. PERKINS and L. GARNJOBST, 1954 Map construction in Neurospora crassa. Advances Genet. 6: 1-93. BOLE-GOWDA, B. N., D. D. PERKINsand W. N. STRICKLAND, 1962 Cross-
ing-over and interference in the centromere region of linkage group I of Neurospora. Genetics 47: 1243-1252.
COBBS, G., 1978 Renewal process approach to the theory of genetic linkage: case of no chromatid interference. Genetics 89: 563-
581.
FOGEL, S., R. K. MORTIMER and K. LUSNAK, 1981 Mechanisms of meiotic gene conversions, or “Wanderings on a foreign strand,” pp. 289-339 in Molecular Biology of the Yeast Saccharomyces: Life Cyck and Inheritance. Cold Spring Harbor Laboratory, Cold Spring Harbor, W .
FOSS, E., and F. W. STAHL, 1995 A test of a counting model for chiasma interference. Genetics 1 3 9 000-000.
FOss, E., R. LANDE, F. W. STAHL and C. M. STEINBERG, 1993 Chiasma interference as a function of genetic distance. Genetics 133: 681 - 691.
HOSMER, D. W., JR., and S. LEMESHOW, 1989 Applied Logastic Regres- sion. Wiley, New York.
h N G J. S., and R. K MORTIMER, 1990 A polymerization model of chiasma interference and corresponding computer simulation. Genetics 126: 1127-1138.
KING, J. S., and R. K. MORTIMER, 1991 A mathematical model of
data. Genetics 1 2 9 597-602.
interference for use in constructing linkage maps from tetrad
LANDE, R., and F. W. STAHL, 1993 Chiasma interference and the distribution of exchanges in Drosophila melanogasto. Cold Spring Harbor Symp. Quant. Biol. 5 8 543-552.
MATHER, K., 1935 Reductional and equational separation of the chromosomes in bivalents and multivalents. J. Genet. 30: 53-78. MCCULLAGH, P., and J. A. NELDER, 1989 Generalized Linear Models.
Chapman and Hall, New York.
MCPEEK, M. S., and T. P. SPEED, 1995 Modeling interference in genetic recombination. Genetics 139: 1031-1044.
MORTIMER, R. K., and S. FOGEL, 1974 Genetical interference and gene conversion, pp. 263-275 in Mechanism in Recombination,
edited by R. F. GRELL. Plenum, New York.
MORTIMER, R. K., and D. C. HAWTHORNE, 1966 Genetic mapping in Saccharomyces. Genetics 53: 165-175.
PAPAZIAN, H. P., 1952 The analysis of tetrad data. Genetics 37: 175-
PERKINS, D. D., 1949 Biochemical mutants in the smut fungus Usti- lago maydis. Genetics 3 4 607-626.
PERKINS, D. D., 1962a The frequency in Neurospora tetrads of multi- ple exchanges within short intervals. Genet. Res. 3: 315-327. PERKINS, D. D., 1962b Crossing-over and interference in a multiply
marked chromosome arm of Neurospora. Genetics 47: 1253- 1274.
PERKINS, D. D., R. LANDE and F. W. STAHL, 1993 Estimates of the proportion of recombination intermediates that are resolved with crossing over in Neurospora crassa. Genetics 133: 690-691. SNOW, R., 1979 Maximum likelihood estimation of linkage and in-
terference from tetrad data. Genetics 9 2 231-245.
STAHL, F. W., 1979 Genetic Recombination, Thinking about it in Phage and Funga. W. H. Freeman, San Francisco.
STAM, P., 1979 Interference in genetic crossing over and chromo- some mapping. Genetics 92: 573-594.
STRICKLAND, W. N., 1958 An analysis of interference in Aspergillus nidulans. Proc. R. SOC. Lond. Ser. B 1 4 9 82-101.
SZOSTAK, J. W., T. L. ORR-WEAVER, R. J. ROTHSTEIN and F. W. STAHL, 1983 The double-strand-break repair model for recombination. Cell 33: 25-35.
ZHAO, H., T. P. SPEED and M. S. MCPEEK, 1995 Statistical analysis of crossover interference using the chi-square model. Genetics
188.
139: 1045-1056.
Communicating editor: P. J. PUKKILA
APPENDIX: CONFIDENCE INTERVALS FOR ESTIMATES O F rn AND X
Russell Lande
Departmat of Biology, University of Oregon, Eugene, Oregon 9740? In a sample of n tetrads, the observed frequencies,
NPD and PD are assumed to follow a trinomial distri- bution. Since the observed frequencies sum to 1, all of the information in the sample is contained in any two of the observed frequencies, e.g., NPD and
F.
These have sampling variances and covariance:Var [ NPD] = NPD( 1 - NPD) / n ,
V a r [ n = T ( l - T ) / n , ( 1 )
COV [ NPD,
f‘l
= -T. NPD/ n, ( 2 ) from which it can be shown thatVar[fi] = [ R ( 1 - R ) - T / 4 ] / n . ( 3 )
If the observed number of nonparental ditypes,
1454 F. W. Stahl and R. Lande
U
0.5
0.4
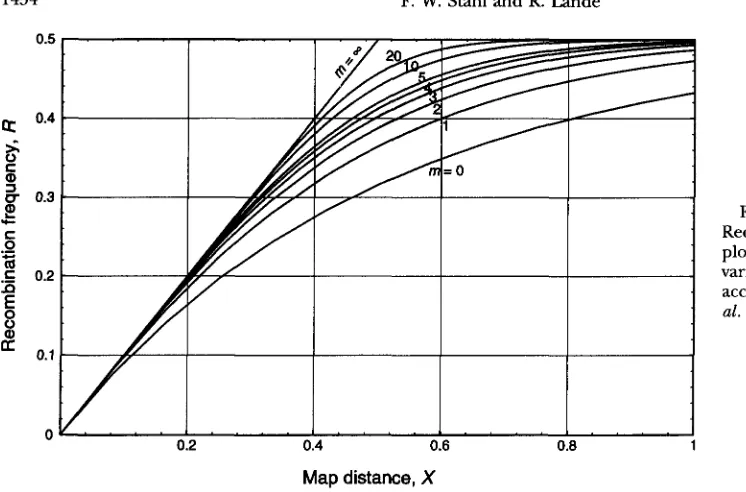
FIGURE 5.-Mapping functions. Recombination frequency ( R ) is plotted vs. map distance ( X ) for various values of m (see RESULTS) according to the model of Foss et
al. (1993).
Map
distance,
Xof the lines for different values of m that intersect the The 100 ( 1 - a )
%
confidence region is described by ellipse give values of m that are compatible with the the parametric relationshipdata.
A more accurate method of determining a 95%
confidence region (valid when n is large) is based
on the logit transformation of all frequencies with (Hosmer and Lemeshow 1989; McCullagh and
Nelder 1989),
(6
h
( 7 ) ( r ) ) =\I-
2
l n ( 1 - a )W(
A & ? )which have approximate variances and covariance
1
Var [ f i ] E
nT(
1 - T )’
cov
[ j , &
=
- --
1 (
+
12 1 - T 1 - N P D
Let the column vector (
f ,
,
f,)
’
(where prime indi- cates matrix transposition ) have variancecovariance matrix C with elements in (4) and ( 5 ) . Because C is symmetric, it can be represented by the spectral decom- positionC = M r ( 0 A2 ‘)M,
for 0 5 r 5 2 ~ .
An estimated recombination rate, R = NPD
+
p/2,
has sampling variance given by Equation 3. For large samples, the 95% confidence interval around the esti- mate can be approximated by 2 2 SDs around the esti- mate.An estimate of map distance, X , corresponding to an estimated recombination rate can be obtained using the mapping function with the closest value of m , either numerically from the formulas or graphically from Fig- ure 5. The 95% confidence interval around X can be approximated either by using the appropriate mapping function to transform the endpoints of the correspond- ing confidence interval for R , or, somewhat less accu- rately, by using 2 2 SDs around the estimate. The sam- pling variance of X in large samples is approximately
Var
[a
= Var [ R ] ( dR/dX),’where A1 and X2 are the (real positive) eigenvalues of
C, and M is a unitary, orthogonal matrix with columns d R
- C Y C -
Y i with y = 2 ( r n + 1)X. (11)that are the eigenvectors of C normalized to unit length.
where
”