ABSTRACT
Population structure parameters commonly used for diploid species are reexamined for the particular case of tetrasomic inheritance (autotetraploid species). Recurrence equations that describe the evolution of identity probabilities for neutral genes in an “island model” of population structure are derived assuming tetrasomic inheritance. The expected equilibrium value of FSTis computed. In contrast to diploids, the
correlation of genes between individuals within populations with respect to genes between populations (FST) may vary among loci due to the particular segregation patterns expected under tetrasomic inheritance
and is consequently inappropriate for estimating demographic parameters in such populations. We thus define a new parameter (r) and derive its relationship with Nm. This relationship is shown to be independent from both the selfing rate and the proportion of double reduction. Finally, the statistical procedure required to evaluate these parameters using data on gene frequencies distribution among autotetraploid populations is developed.
D
UE to its frequent occurrence among angiosperm pair during meiosis. Multivalents leading to polysomic inheritance are formed. This does not necessarily lead species (from 30 to 50%;Stebbins1971; Grant1981), polyploidy is now recognized as an important to random assortments of homologous chromosomes into gametes; two sister chromatids may also segregate step in the evolutionary diversification of flowering
plants (Lewis 1980; Levin 1983; Stebbins 1985; into the same gamete (Figure 1). This phenomenon, known as “double reduction,” is specific to autopoly-Thompson and Lumaret 1992; Soltis and Soltis
1993;BretagnolleandThompson1995, 1996;Petit ploids. It increases the production of homozygous ga-metes as compared to what is expected under random et al. 1996, 1997). Polyploid species are commonly
classi-fied in two major types according to their presumed chromosome segregation and is thus likely to alter many basic expectations of population genetics (Bever and origin: allopolyploids are thought to result from
hybrid-ization between different taxa and subsequent chromo- Felber1992). Because the frequency of double reduc-tion depends on the occurrence of crossovers between some doubling, while autopolyploids presumably stem
from the chromosome doubling of the same genome, the centromere and the locus under consideration (Fig-ure 1), segregation patterns are expected to vary among primarily by fusion of unreduced gametes (Beverand
Felber1992;BretagnolleandThompson1995). Au- loci, obscuring predictions regarding genetic aspects of totetraploidy was originally thought to be rare and mal- autopolyploids.
adaptive as compared to allopolyploidy. However, a Probably because of the agronomic significance of growing number of studies using genetic information in polyploid species, the consequences of polysomic inher-addition to cytological and morphological traits confirm itance and double reduction have been investigated, that autopolyploids are more common and of greater especially for self-fertilization and regular systems of evolutionary importance than originally appreciated inbreeding (Haldane1930;Demarly1963;Bennett (Levin 1983; Crawford1985; RiesebergandDoyle 1968;Gallais1990). In contrast, few investigations have
1989; SoltisandSoltis1989). dealt with the amount and patterns of genetic variation
Due to the addition of divergent genomes, inheritance among naturally occurring autopolyploid populations, in allopolyploids is disomic; i.e., pairing behavior during and theoretical models incorporating population struc-meiosis is similar to that of nonhomologous pairs of ture and estimation procedures are still lacking for tet-chromosomes in diploids. In contrast, segregation pat- rasomic inheritance (Glendinning 1989; Bever and terns in autopolyploids are much more complex be- Felber1992 for review;Moodyet al. 1993).
cause more than two homologous chromosomes can For diploids, the distribution of genetic diversity within and among natural populations is commonly ana-lyzed using theoretical models of population structure, Corresponding author: Joe¨lle Ronfort, Laboratoire de Ge´ne´tique et for instance, the island model or the stepping stone
d’Ame´lioration des Plantes, Institut National de la Recherche
Agro-model. Functions of probabilities of gene identity within
nomique, Domaine de Melgueil, 34130 Mauguio, France.
E-mail: ronfort@ensam.inra.fr and between units (populations, subpopulations), such
Figure1.—Possible segregation patterns
of a locus in an autotetraploid individual following the formation of a quadrivalent. Type I describes the segregation patterns expected when there is no crossover be-tween the centromere and the locus. The first division is then reductional. When a crossover occurs between the centromere and the locus (Types II and III), the first division can be either equational (Type II) or reductional (Type III). Under Type III, the second division may then lead to double reduction. In the present case, gametes ii and jj have undergone double reduction.
as FST(Wright1951), can be estimated using isozyme of tetrasomic inheritance; the case of the island model is given here as an illustration. Equilibrium values for or DNA-based marker diversity and can be compared
to expectations under specific models such as Wright’s traditional F-statistics parameters are derived. Because the proportion of double reduction may vary over loci, island or isolation by distance models (Slatkin and
Barton 1989; Rousset 1997). The relationships be- we define an additional function of probabilities of gene identity. This parameter seems appropriate to analyze tween estimates and expectations can then be used to
quantify gene flow between the studied units or even population structure in autotetraploids, because its rela-tionship with the migration rate and the population size to understand how ecological and life history traits may
influence the distribution of genetic variation within is shown to be independent from both the selfing rate and the proportion of double reduction. Finally, follow-and among populations (see, for example, Loveless
andHamrick1984; Hamrickand Godt1990). How- ingWeirandCockerham(1984), we define estimators for the different parameters using the analysis of vari-ever, models of population structure as well as
estima-tion procedures have been almost exclusively devoted ance framework. to diploid populations (see, however,Wright1938).
The aim of this article is to develop a theoretical
frame-HIERARCHICAL GENIC STRUCTURE
work for the analysis of population structure in
autotet-AND DEFINITION OF PARAMETERS
raploid species. Recurrence equations that describe
Q˙r5 E[(12 m) ]5 E[(12 m) ] within individuals (Q0) can be issued either from the
· E[(12 m)2T 2]. (6)
same gamete (probability 1/3) or from two different gametes (probability 2/3). If QA and QB denote the
Because T2corresponds to a coalescence time, then probability of IIS associated, respectively, with these two
using the relationships between the coalescence of categories of pairs of genes, then Q05 (QA12QB)/3.
genes and identity probabilities, E[(12 m)2T 2] repre-FollowingCockerhamandWeir(1987, 1993; see also
sents the IBD probability for a pair of genes when both Rousset1996), F-statistics parameters can be defined as
are sampled in the same individual (Figure 2):
FIT ;Q02Q2 12 Q2
(1)
E[(12 m)2T 2]511Q˙A1 2Q˙B
4 . (7)
Unlike T2, T1in this instance is not a coalescence time FIS;Q02Q1
12 Q1
5 (QA1 2QB)/3 2Q1 12 Q1
(2)
but rather the “waiting time” for two genes initially at distance r to migrate within the same individual (Figure FST;Q12Q2
12 Q2
. (3) 2). To define T
1, we do not make any reference to identity between the two genes under consideration, Another parameter we will consider is and this waiting time will depend only on the initial distance between the two genes (r51 or 2) and on the way genes migrate within and between subpopulations.
r˙ ; Q˙12Q˙2
(1 1Q˙A12Q˙B)/42 Q˙2
. (4)
Hence, E[(12 m)2T1], which we will denote h˙
rin what follows, is not an IBD probability but simply denotes This parameter is analogous to the “correlation
be-the probability that neibe-ther gene has mutated during tween truly outcrossed mates” in diploids (Wallerand
T1. Since double reduction affects only transition proba-Knight1989;TachidaandYoshimaru1996). For
dip-bilities for genes within individuals, it does not affect loids, interest in this correlation has come from the
T1nor h˙r. These two parameters are consequently inde-fact that the relationship between this parameter, the
pendent from the proportion of double reduction. migration rate, and the population size is independent
Now, following (2), and using (3), the IBD probability from the selfing rate (seeNagylaki1983;Tachidaand
for two genes in different individuals at distance r re-Yoshimaru1996). We will show that, forr˙ in
autotetra-duces to ploids, this relationship is moreover independent of the
proportion of double reduction and therefore identical
Q˙r5h˙r·
11Q˙A12Q˙B
4 (8)
for all loci independently of their distance to the centro-mere.
and, putting this formula into (4), yields the following Let us define Q˙ras the IBD probability for two genes
expression forr˙ : in different individuals located either in two different
subpopulations (r 5 2) or in the same subpopulation
r˙ 5(1 1Q˙A 12Q˙B)h˙1/42 (11Q˙A1 2Q˙B)h˙2/4 (1 1Q˙A1 2Q˙B)/42(11Q˙A1 2Q˙B)h˙2/4 (r 5 1) and use the relationship between coalescence
of genes and identity probabilities (Male´ cot 1975; Tachida1985;SlatkinandVoelm1991): the
probabil-5h˙12 h˙2 12h˙2
. (9)
ity of IBD for a pair of genes is the probability that neither gene has mutated between the present time
This parameter is of interest for two reasons: (1) Because and the time of first common ancestry, that is, their
the h˙rs are independent of the coefficient of double coalescence time (Male´ cot1975;Slatkin1991). This
reduction, this equation shows that this is also true for yields the expression
r˙ ; (2) as will be shown later, the expected value ofr˙ can be deduced with minimal effort from previous Q˙r5
o
∞
t51
(12 m)2tP(t)5 E[(12 m)2T], (5)
Figure2.—Waiting times for coalescence of two genes located in two different individuals that are at distance x at the present
time (x51 for individuals located in the same population; x52 for individuals in two different populations) and their associated probabilities. Populations are represented by large ellipses; small circles represent genes (four such circles denote an individual) shaded in black or gray for the genes studied, in white for genes not considered.
EQUILIBRIUM VALUES OF THE PARAMETERS
Consider now,
IN AN ISLAND MODEL
We consider a finite island model (Wright1951) of
r˙ 12 r˙ 5
Q˙12Q˙2
(1 1Q˙A1 2Q˙B)/42 Q˙1
. (10)
population structure: a set of n subpopulations, each consisting of N individuals, with nonoverlapping
gener-Noting that ations. Individuals are monoecious and subpopulations
exchange migrant gametes at a rate m. Each migrant has an equal chance of coming from each of the other 11 3F˙IS
4 5
(11 Q˙A12Q˙B)/42Q˙1 12Q˙1
,
n21 subpopulations. Genes are assumed to be neutral and the mutation ratemis the same for all alleles.
Follow-we can always write ingNagylaki(1983) andCrowandAoki(1984), two
notations will be used. After migration, the proportion of pairs of genes that originate from one subpopulation F˙ST
12F˙ST5
(1 1Q˙A1 2Q˙B)/42 Q˙1
12 Q˙1 in the previous generation is a5(12m)21 m2/(n2
1) for genes within a subpopulation, and b5(12 a)/
· Q˙12 Q˙2
(11 Q˙A12Q˙B)/42 Q˙1 ,
(n21) for genes from different subpopulations. In each subpopulation, a proportion S of offspring is produced
which reduces to through selfing and the proportion of double reduction
for the studied locus is denoteda.
When individuals are autotetraploid, there are 4N F˙ST
12F˙ST5
113F˙IS
4 ·
r˙
12 r˙ . (11) genes in each subpopulation. Then, provided neither gene has mutated [with probabilityg 5(12 m)2], genes This may be compared to the result of the diploid originating from the same subpopulation are identical model with selfing (TachidaandYoshimaru1996), in by descent with probability (1 1 3Q˙
0)/4N 1 (1 2
which one can write 1/N )Q˙1, while genes from different subpopulations are
identical by descent with probability Q˙2. The recurrence relations for Q˙1and Q˙2are as follows (t denoting time F˙ST
12 F˙ST5 11 F˙IS
2 ·
r˙
it can be shown thatrr/(12 rr)≈r/(2Ds2)1Constant, Q˙1,t112 Q˙2,t11 5 g·
(a2 b)·
3
113Q˙0,t
4N 1
1
121
N
2
Q˙1,t4
for a pair of populations at distance r in a one-dimen-sional model, andrr/(12 rr)≈ln(r)/(2Dps2)1Con-1(b2a)Q˙2,t
. (15) stant, in a two-dimensional model, where D is the
popu-lation density ands2is a measure of dispersal (Rousset At equilibrium, the Qi’s do not change, hence 1997).
(Q˙12Q˙2) ·
3
12 g· (a2b) ·1
12 1N
24
POPULATION PARAMETERS ESTIMATIONConsider a dataset describing the genotypic
constitu-5 g· (a2b) ·113Q˙0 24Q˙2
4N . (16) tion of autotetraploid individuals sampled (at random) from a set of r subpopulations. Each subpopulation is Using d5a 2b, this equation can be expressed as
represented by ni individuals (sample size), where i re-fers to the ith subpopulation. To build estimators for C 5 Q˙12Q˙2
113Q˙024Q˙2
5 gd
4N(12 gd)14gd. (17) the level of population differentiation, we use the linear model with hierarchical effects (subpopulations, indi-viduals within subpopulations, and genes within individ-Noting that (11Q˙A12Q˙B)/42Q˙15 (11 3Q˙02
uals) developed by Cockerham (1969, 1973) for the 4Q˙1)/4, then substituting this into (10) and using (17),
analysis of diploid population structure. Now xijkis an yields
indicator variable describing the state of the kth gene (1# k# 4, instead of 1# k# 2 for diploids) in the
r˙ 12 r˙ 5
4(Q˙12Q˙2) 123Q˙024Q˙1
5 4C
124C5
gd
N(12 gd), jth sampled individual (1#j#ni) of the ith subpopula-tion (1 # i# r). For a particular allele u, xijk:u5 1, if (18)
the gene is u, xijk:u50 otherwise, and the ANOVA setup which is the same result as in the diploid (or haploid) is as follows:
model. Using u 5n/(n2 1), Equation 18 becomes
o
r Subpopo
ni
Indiv
o
4Genes
(xijk:u2x...:u)25
o
io
jo
k(xijk:u2xij.:u)2
r˙ 12 r˙ 5
1
2N(mu 1 m)·(11 O(m)1O(m)), (19) 1
o
io
jo
k(xij.:u2 xi..:u)2
i.e., 1
o
i
o
jo
k(xi..:u 2x...:u)2
5SSg[enes]:u1 SSi[ndividuals]:u
r˙ 12 r˙ ≈
1
2N(mu 1 m) (20)
1 SSs[ubpopulation]:u. and, using (11),
Using the same developments as for diploids (Weir 1996), the following sum of squares expectations can F˙ST
12 F˙ST≈
113F˙IS
4 ·
1
2N(mu 1 m). (21) be derived (details are given in theappendix): for genes within individuals
As one may note, we do not need to know identity ε(SS
g[enes])53S1(12 Q0); (23a) probabilities within subpopulations (Q0and Q1) to
de-for genes between individuals within subpopulations rive these results. For diploids, the expected equilibrium
value of FIS depends on the selfing rate (S), and the ε
(SSi[ndivis])5 Wd· (4(Q02 Q1)1 (12 Q0)); (23b) population size (N ). For autotetraploids, it also depends
on the proportion of double reduction that increases and for genes between individuals from different sub-populations
ε(SSs[ubpops])54Wa· (Q12Q2)1Ww · [4(Q0 2Q1) mates in autotetraploids are expected to vary across the loci as a consequence of different amounts of double
1 (12Q0)], (23c)
reduction during meiosis (Figure 1 and Introduction). This problem is illustrated in Equation (11) because FIS where S15Rini, S25Rin2i, Wd;S12r, Wa;S12S2/
will vary depending on both the selfing rate and the S1, and Ww; r2 1.
proportion of double reduction (a). Since the propor-From Equations 23a–23c, we obtain
tion of double reduction for a given locus is difficult to assess empirically and because population structure Q12 Q25
Wdε(SSs)2Wwε(SSi)
4WaWd (24) estimates should be based on several loci, we defined a
new function of identity probabilities, r, which is an 12 Q25
1 4WaWd
3
WaWd
S1 ε(SSg)1(Wa2Ww) analogue to the “correlation between truly outcrossed mates” previously defined for diploids (Waller and ε(SSi)1Wdε(SSs)
4
, (25) Knight1989;TachidaandYoshimaru1996). For both diploids and tetraploids, the relationship between thiswhich yield an estimator of FST: correlation and the product Nm is independent from
the selfing rate (except when selfing affects migration).
FˆST5 WdSSs 2WwSSi
[WdSSp1(Wa2Ww)SSi1(WaWd/S1)SSg]
. For autotetraploids, interest inrcomes mainly from the fact that this relationship is also independent of the (26) proportion of double reduction and therefore identical
for all loci independently of their distance to the centro-Now, noting that 113Q024Q1512Q014(Q02
mere. The parameter r can consequently be used to Q1)5 ε(SSI)/Wd, we have
assess population structure over many loci, without any prior knowledge concerning the proportion of double
rˆ 12 rˆ5
4 · (Qˆ 12 Qˆ2) 113Qˆ0 24Qˆ1
5 WdSSs2WwSSi WaSSi
.
reduction.
(27) Inspection of the relationship betweenrand FST(11) shows that FSTis increased by a factor (113FIS)/4 when An estimator of FˆIT;12(1 2Qˆ 1)/(12Qˆ 2) is
self-fertilization or double reduction occurs within sub-populations. This means that like self-fertilization, dou-FˆIT5 4(WaWd/3S1)SSg
[WdSSp1(Wa2Ww)SSi1 (WaWd/S1)SSg] ,
(28) ble reduction reduces the effective subpopulation size and hence promotes differentiation among subpopula-and
tions (for the studied locus). The complication due to partial selfing or double reduction can be absorbed FˆIS512
12FˆIT 12FˆST
. (29)
in the single parameter FIS and by defining the effec-tive population size as NZ 5 N/(1 1 3FIS). Equation For all these parameters, multilocus estimates (i.e., (21) can then be used with N
Z replacing N, i.e., FST/ combining the information from all alleles and all loci) (12FST)5 1/(8NZmu 18N
Zm), whileris still equal to are defined as the sum of locus-specific numerators di- r/(12 r)≈1/(2Nmu 12Nm), which depends only on vided by the sum of locus-specific denominators (see the migration rate, mutation rate, and the demographic alsoReynoldset al. 1983;Weir1996). For example,
population size (i.e., N, not NZ). Comparison of Equa-tion 11 with the results of the diploid model (12) further
r
ˆ 12 rˆ 5
o
nl l51o
ul
u51(WdSSS 2WwSSi)lu
o
nll51
o
ulu51(WaSSi)lu
, (30) shows that self-fertilization has a greater influence on differentiation in autotetraploids as compared to dip-where l refers to the lth loci and u to the uth allele loids.
(with nl, the number of locus and ul, the number of When ignoring selfing and double reduction, the ex-alleles at locus l). Given the dependency of F-statistics pected effect of drift under the island model of popula-on the proportipopula-on of double reductipopula-on (see above), tion structure is halved at equilibrium as compared to multilocus estimates of these parameters will be appro- expectations for diploids, i.e., FST ≈ 1/(1 1 4Nmu 1 priate to make inferences about the balance between 4Nm) (Crow and Aoki 1984; Cockerham and Weir migration (and/or mutation) and drift only if a 5 0 1987). This can be interpreted as the decrease in the for all the studied loci. As soon asa?0 for at least one rate of coalescence of genes within subpopulations and locus, only the estimate ofrwill have this property. is due to the fact that the probability of drawing the same gene within an individual is reduced to 1/4 in an autotetraploid species instead of 1/2 in diploids. In
DISCUSSION
other words, this means that, for a same demographic population size, the effective population size is doubled The aim of this study was to adapt the use of Wright’s
esti-We wrote a computer program estimating F-statistics and the parameter r according to the ANOVA setup developed above (details of the computations are given in the appendix). The program provides estimations forr, FST, FIS, and FITfor each allele as well as estimates combining data over alleles and over loci. To test for a departure from FST50, the program allows for Fisher’s exact test on (population 3 genotypes) contingency tables [for each locus separately, see Raymond and Rousset(1995) for the diploid model]. Exact tests on
Figure3.—Comparison of average values of the estimator
contingency tables in which cell counts are tetraploid
(rˆ) with expected equilibrium values ofr. An island model
was simulated assuming K59 allelic states for each of 10 loci, genotypes are valid even if there is double reduction.
n512 subpopulations andm 51025(see text for a complete
As for diploid datasets (RaymondandRousset1995),
description of the simulation procedure). To determine the
the software allows for analysis either over the whole set
number of generations required for the population to reach
of populations or for pairs of populations. The program
its equilibrium, sampling was performed in generations 200,
400, 1000, 2000, and 5000. For N 550, the estimates were containing both estimations and exact tests procedures
stable after 2000 generations. Each symbol gives the value is available upon request.
of rˆ computed after 2000 generations and averaged over 10
We thank D. Couvet and P. Jarne for discussions, M. Raymond for replicated simulations (standard errors were always less than
advice concerning the computer program, and J. M. Prosperi for 1023and are therefore not shown) for N550, no selfing,a 5
comments on the manuscript. This work was supported by a grant
0. s is for sample size e 5 10, d for e 5 30. Lines were
from the French “Bureau des Ressources Ge´ne´tiques” to E.J. and J.R. computed using the expected equilibrium value ofr, i.e.,r≈
This is contribution number 98-085 of the Institut des Sciences de
1/(1 1 2Nmu 12Nm) for small Nm. Simulations were
per-l’Evolution.
formed for two other parameter sets: N 550, S5 0.2,a 5
0; N550, no selfing,a 52/7.ris identical for these different parameter sets and the average values of the estimates (rˆ) are too close to be distinguished on the figure.
LITERATURE CITED
Bennett,J. H., 1968 Mixed self- and cross-fertilization in a
tet-on autotetraploids (Moody et al. 1993) that assumed
rasomic species. Biometrics 24: 485–500.
that mutation alone was opposed to genetic drift (i.e., Bever, J. D.,andF. Felber,1992 The theoretical population
genet-ics of autopolyploidy. Oxford Surv. Evol. Biol. 8: 185–217.
m50, FIS5 0,a 50): FST51/(118Nm).
Bretagnolle, F.,andJ. D. Thompson,1995 Gametes with somatic
Following the linear model derived in Cockerham
chromosome number: mechanisms of their formation and role
(1969, 1973) for diploid data, estimators for F-statistics in the evolution of autopolyploid plants. New Phytol. 129: 1–22.
Bretagnolle, F.,andJ. D. Thompson,1996 An experimental study
and r can be computed through hierarchical analyses
of ecological differences in winter growth between sympatric
of variance of gene frequencies. Simulations were per- diploid and autotetraploid Dactylis glomerata. J. Ecol. 84: 343–351. formed to assess possible bias in the estimation ofrdue Cockerham, C. C.,1969 Variance of gene frequencies. Evolution
23:72–84.
to small sample sizes. We simulated a finite island model
Cockerham, C. C.,1973 Analysis of gene frequencies. Genetics 74:
composed of n monoecious subpopulations of size N. 679–700.
In each subpopulation, 10 neutral, independent loci Cockerham, C. C.,andB. S. Weir,1987 Correlations, descent
mea-sures: drift with migration and mutation. Proc. Natl. Acad. Sci.
(recombination rate50.5), each with K possible allelic
USA 84: 8512–8514.
states (K-allele model), and all segregating according
Cockerham, C. C.,andB. S. Weir, 1993 Estimation of gene flow
to the same proportion of double reduction (a) were from F-Statistics. Evolution 47: 855–863.
Crawford, D. J.,1985 Electrophoretic data and plant speciation.
modeled. Initial frequencies of the different allelic states
Syst. Bot. 10: 405–416.
were made equal in all the subpopulations (initial
fre-Crow, J. F.,and K. Aoki, 1984 Group selection for a polygenic
quency51/K ). Each subpopulation had the same mat- behavioral trait: estimating the degree of population subdivision.
Proc. Natl. Acad. Sci. USA 81: 6073–6077.
Demarly, Y.,1963 Ge´ne´tique des te´traploı¨des et ame´lioration des ics of polyploid plants: origins, establishment and persistence.
Trends Ecol. Evol. 7: 302–307. plantes. Ann. Amelior. Plantes 13: 307–400.
Waller, D. M.,andS. E. Knight,1989 Genetic consequences of
Gallais, A.,1990 The´orie de la Selection en Ame´lioration des Plantes.
outcrossing in the cleistogamous annual, Impatiens capensis. II. Masson, Paris.
Outcrossing rates and genotypic correlations. Evolution 43: 860–
Glendinning, D. R.,1989 Some aspects of autotetraploid
popula-869. tion dynamics. Theor. Appl. Genet. 78: 233–242.
Weir, B. S.,1996 Genetic Data Analysis II: Methods for Discrete Population Grant, V.,1981 Plant Speciation, Ed. 2. Columbia University Press,
Genetic Data. Sinauer Associates, Sunderland, MA.
New York.
Weir, B. S.,andC. C. Cockerham,1984 Estimating F-Statistics for Haldane, J. B. S.,1930 Theoretical genetics of autotetraploids. J.
the analysis of population structure. Evolution 38: 1358–1370. Genet. 22: 359–372.
Wright, S.,1938 The distribution of gene frequencies in popula-Hamrick, J. L.,andJ. W. Godt,1990 Allozyme diversity in plant
tions of polyploids. Proc. Natl. Acad. Sci. USA 24: 372–377. species, pp. 43–63 in Plant Population Genetics, Breeding and Genetic
Wright, S.,1951 The genetical structure of populations. Ann.
Eu-Resources, edited byA. H. D. Brown, M. T. Clegg, A. L. Kahler
gen. 15: 323–354. andB. S. Weir.Sinauer Associates Inc., Sunderland, MA.
Levin, D. A.,1983 Polyploidy and novelty in flowering plants. Am.
Communicating editor:M. Slatkin
Nat. 122: 1–25.
Lewis, W.H.,1980 Polyploidy in angiosperms: dicotyledons, pp.
241–268 in Polyploidy, Biological Relevance, edited byW. H. Lewis.
APPENDIX Plenum Press, New York.
Loveless, M. D.,andJ. L. Hamrick,1984 Ecological determinants
Computation of expected sum of squares of gene
of genetic structure in plant populations. Annu. Rev. Ecol. Syst.
15:65–95. frequencies involved in estimatingrand F-statistics:Let
Male´cot, G.,1948 Les Mathe´matiques de l’He´re´dite´. Masson, Paris.
Eudenote the expectation of xijk:u, andpu, the expected
Male´cot, G.,1975 Heterozygosity and relationship in regularly
sub-frequency of the allele u. Then ε[(xijk:u2Eu)2]5 pu2
divided populations. Theor. Popul. Biol. 8: 212–241.
Moody, M. E., L. D. MuellerandD. E. Soltis,1993 Genetic varia- p2
u, whereεdenotes expectation. Then, summing over
tion and random drift in autotetraploid populations. Genetics
all alleles, we obtain
134:649–657.
Nagylaki, T.,1983 The robustness of neutral modes of
geographi-εijk 5ε
3
o
u(xijk:u2 Eu)2
4
5 12o
up2
u5 12 Q3, (A1)
cal variation. Theor. Popul. Biol. 24: 268–294.
Petit, C., J. D. ThompsonandF. Bretagnolle,1996 Phenotypic
plasticity in relation to ploidy level and corm production in the where Q
3denotes the identity probability for genes from
perennial grass Arrhenatherum elatius. Can. J. Bot. 74: 1964–1973.
different independent replicate populations, then, in
Petit, C., P. Lesbros, X. GeandJ. D. Thompson,1997 Variation
the following, we write [xijk2E] for the sum over alleles.
in flowering phenology and selfing rate across a contact zone
between diploid and tetraploid Arrhenaterum elatius (Poaceae). Using the relationship (x
k2 xk9)25(xk2E)21 (xk92
Heredity 79: 31–40.
E)222 · (x
k2E) · (xk92E), we obtain a useful equation
Raymond, M.,andF. Rousset,1995 An exact test for population
for the covariance of two genes, i.e.,
differentiation. Evolution 49: 1280–1283.
Reynolds, J., B. S. WeirandC. C. Cockerham,1983 Estimation of
ε[(xk2E)(xk92E )]5ε[(xk2E)2]2ε[(xk2xk9)2]/2.
the coancestry coefficient: basis for a short-term genetic distance. Genetics 105: 767–779.
(A2)
Rieseberg, L. H.,andM. F. Doyle,1989 Tetrasomic segregation
in the naturally occurring autotetraploid Allium nevii (Alliaceae).
This, derived for different pairs of genes, yields the
Hereditas 111: 31–36.
Rousset, F.,1996 Equilibrium values of measures of population covariances
subdivision for stepwise mutation processes. Genetics 142: 1357–
1362. ε[(xijk2E )(xijk9 2E)]5 (12Q3)2 (12Q0)
Rousset, F.,1997 Genetic differentiation and estimation of gene
flow from F-statistics under isolation by distance. Genetics 145: 5 Q0 2Q3 (A3)
1219–1228.
Slatkin, M.,1991 Inbreeding coefficients and coalescence times. for genes within individuals,
Genet. Res. 58: 167–175.
Slatkin, M.,andN. H. Barton,1989 A comparison of three indirect ε[(x
ijk2E )(xij9k9 2 E)]5 (12Q3)2(12 Q1)
methods for estimating average levels of gene flow. Evolution 43:
5 Q12Q3 (A4)
1349–1368.
Slatkin, M.,andL. Voelm,1991 FSTin a hierarchical island model.
for genes between individuals within subpopulations,
Genetics 127: 627–629.
Sokal, R. R.,andF. J. Rohlf,1995 Biometry, Ed. 3. Freeman and and
Company, New York.
Soltis, D. E.,andP. S. Soltis,1989 Genetic consequences of auto- ε[(x
ijk2 E)(xi9j9k92E)]5(1 2Q3)2(1 2Q2)
polyploidy in Tolmiea (Saxifragaceae). Evolution 43: 586–594.
Soltis, D. E.,andP. S. Soltis,1993 Molecular data and the dynamic 5Q
22 Q3 (A5)
nature of polyploidy. Crit. Rev. Plant Sci. 12: 243–273.
Stebbins, G. L.,1971 Chromosomal Evolution in Higher Plants. Addi- for genes between individuals in different
subpopula-son-Wesley, Reading, MA. tions. These relationships can be used to derive the
Stebbins, G. L.,1985 Polyploidy, hybridization and the invasion of
expectations
new habitats. Ann. MO Bot. Gard. 72: 824–832.
Tachida, H.,1985 Joint frequencies of alleles determined by
sepa-εij.5ε[(xij.2E)2]
rate formulation for the mating and mutation systems. Genetics 111:963–974.
Tachida, H.,andH. Yoshimaru,1996 Genetic diversity in partially 5 1
16ε
3
o
4k51
(xijk5E)21
o
4k51k
o
?k9(xijk2 E)(xijk92 E)
4
,selfing populations with the stepping-stone structure. Heredity 77:469–475.
54Wa· (Q12 Q2)1 Ww
i.e., · [4(Q
02Q1)1(12 Q0)]. (A11) As for diploids (CockerhamandWeir1987), the com-εi..5 (12Q3)2
ni21
ni (12Q1)2 3 4ni
(1 2Q0)
ponents of variance of the nested ANOVA model (xijk:u5
mu1 ai:u1 bj:u1εijk:u) can be expressed as linear functions
ε...5 ε[(x...2E)2]5 ε
31
14S1
o
io
jo
k xijk2 E2
2
4
, (A7) of identity probabilities, i.e.,s2
a;Q1:u2Q2:u5(12Q2:u) FST, (A12) i.e.,
s2
b ;Q0:u2Q1:u5(12Q2:u)(FIT2 FST), (A13)
ε...5 (12Q3)2(1 2 S2 S2 1
) · (12 Q2)2
1
S22 S1S2
1
2
ands2
e ;12Q0:u5(12Q2:u)(12FIT). (A14) · (12Q1)2
3 4S1
(12 Q0), (A8)
ANOVA framework for the estimation ofrand F-statis-tics: To compute sum of squares, straight way gene fre-where S15Riniand S25Rin
2
i. quencies were used instead of indicator variables (x
ijk). Now, the basic relationship ε[Rriwi(x
i2x)2]5ε[Rriwi This method is based on the following relationships be-(xi2E)2]2ε[Rriwi(x2E)2] can be used to write sum of tween gene frequency estimates and the indicator variable squares expectations, for genes within individuals, [seeWeir(1996) for the diploid case],
x...5
o
inip˜Ai/
o
ini5p˜A
ε(SSg[enes])5ε
3
o
ri
o
nij
o
4k
(xijk2xij.)2
4
xi..5
o
jo
kxijk/4ni5 p˜Ai
5ε
3
o
i
o
jo
k(xijk2E)2
4
x2 ij.5 ε(
o
k
xijk)2/165(p˜
Ai13P˜AAi)/4,
2ε
3
o
i
o
jo
k(xij.2E)2
4
where p˜Ai5RjRkxijk/4ni and P˜AAi5P˜0,i1P˜1,i/21P˜,2;i/6 with P0,i, P˜1 ,i, and P˜2,i standing, respectively, for the
pro-and using (A6) pro-and (A7), we obtain portion of monogenic (AAAA), trigenic (AAAa), and
di-genic (AAab) individuals in the ith population (Male´cot ε(SSg[enes])54S1εijk2 4S1εij.53S1(12Q0). (A9)
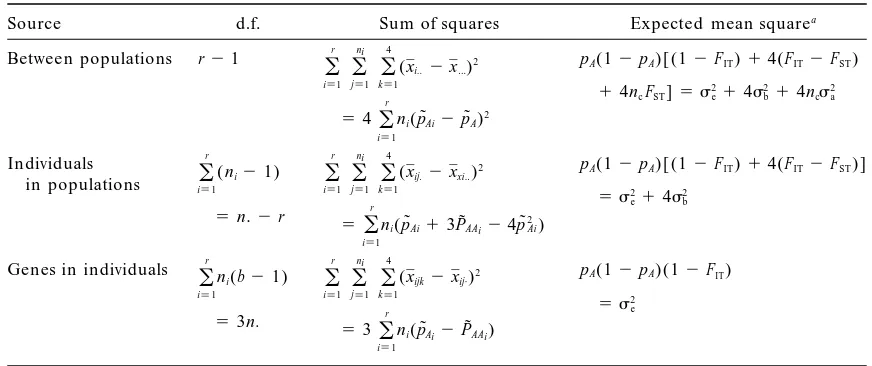
TABLE 1
Nested analysis of variance layout for estimation of the variance components of population structure in autotetraploid organisms, and corresponding gene frequency-based equations.
Source d.f. Sum of squares Expected mean squarea
Between populations r21
o
pA(12pA)[(12FIT)14(FIT2FST)r
i51
o
nij51
o
4k51
(xi..2x...)2
14ncFST]5 s2e14s2b14ncs2a
54
o
r
i51
ni(p˜Ai2p˜A)2
Individuals
o
pA(12pA)[(12FIT)14(FIT2FST)]r
i51
(ni21)
o
r
i51
o
nij51
o
4k51
(xij.2xxi..)2
in populations
5 s2
e14s2b
5n.2r 5
o
ri51
ni(p˜Ai13P˜AAi24p˜2Ai)
Genes in individuals
o
pA(12pA)(12FIT)r
i51
ni(b21)
o
r
i51
o
nij51
o
4k51
(xijk2xij·)2
5 s2
e
53n. 53
o
ri51
ni(p˜Ai2P˜AAi)
This table directly follows a two-way nested ANOVA (seeSokal and Rohlf1995). Corresponding data
design: r populations (1# i#r) of sample size ni (1#j #ni), and b genes registered for each individual
(1#k#4).
anc51/(r21) [Rr