VELIE, BRANDON D. Repeatabilities and Heritabilities of Behavior Traits and Their Relationships with Performance. (Under the direction of Joe Cassady).
The object of this study was to estimate repeatabilities and heritabilities of
indirect measures of pig behavior. Relationships of measures of behavior with
production traits were estimated. Traits chosen were backtest, resident-intruder, human
approach (HAT), novel object (NOT), birth weight (BW), backfat depth (BF), loin
muscle area (LMA), average daily gain in the farrowing house (ADGFH), average daily
gain (ADG), 21 d weight (21DW), and 140 d weight (W). Each behavior trait was
measured twice (n ≥ 457). The study consisted of 95 litters from 31 sires with an average
of 3 sires per litter. Between 7 and 14 d of age the backtest was conducted by placing
each pig in the supine position for 60 s. Total time spent struggling (TTS) and total
number of attempts to struggle (TAS) were recorded. The resident-intruder test was
performed in the nursery while the human approach (HAT) and novel object tests (NOT)
were performed on the finishing floor. The resident intruder test involved two pigs; a
resident pig and an intruder pig from another litter. The resident pen was divided in half
with a solid door. One pig, a resident, was placed in the test area and an intruder pig was
then introduced. Time taken until an attack occurred (LAT) and total number of attacks
over the two tests (RIS) were recorded. Amount of time taken for each pig to make snout
contact with an unfamiliar human (HAT) or object (NOT) was recorded. Dam and sire
effects were significant for all traits (p < 0.01). Sex and pen effects were significant for
LAT, RIS, HAT, and NOT (p < 0.10). Repeatabilities of TTS, TAS, RIS, LAT, HAT,
and NOT were 0.38, 0.21, 0.07, 0.08, 0.17, 0.11, respectively. The phenotypic
time spent struggling and TAS tended to be phenotypically correlated with 21DW and
ADGFH. TAS was phenotypically correlated with BF (0.15). Latency until an attack
occurred was phenotypically correlated with LMA (0.23). RIS was phenotypically
correlated with ADG (-0.13), W (-0.13), and LMA (-0.21). Heritabilities of TTS and
TAS were 0.31 and 0.53, respectively. Genetic correlation of TAS with both ADG and
W was 0.38. Genetic correlations of TTS with BF, W, and TAS were 0.14, 0.18, and
0.81, respectively. It was concluded that the backtest is a heritable and repeatable
measure of a behavioral characteristic in pigs that is both phenotypically and genetically
Performance
By
Brandon D. Velie
A thesis submitted to the Graduate Faculty of North Carolina State University
in partial fulfillment of the requirements for the degree of
Master of Science
ANIMAL SCIENCE
Raleigh, NC
2007
APPROVED BY:
_________________________ _________________________ Dr. Todd T See Dr. William L Flowers
_________________________ _________________________
Dr. Doug Newcome Dr. Wayne W Robison
_________________________ Chair of Advisory Committee
Biography
My name is Brandon Velie and I was born in Biloxi, Mississippi, on August 30,
1983. My parents, Gerald and Mary Velie, were both part of the United States Air Force
the majority of my youth was spent on a military bases. Upon retirement from the armed
forces my family settled down in Burgaw, North Carolina where I attended Pender High
School. After graduation I attended North Carolina State University and received a
Bachelor of Science in Animal Science in the spring of 2005. In August of 2005 I began
graduate school under the direction of Dr. Joe Cassady working towards a Master of
TABLE OF CONTENTS
Page
LIST OF TABLES ... v
LIST OF FIGURES ... vi
LITERATURE REVIEW ... 1
I. Introduction ... 1
II. Environmental Impact ... 2
III. Behavior Tests ... 3
A. Backtest ... 3
B. Resident-Intruder... 4
C. Social Confrontation Test... 7
D. Novel Object Test ... 7
E. Human Approach Test... 8
F. Open Door Test... 8
G. Novel Environment Test ... 8
IV. Biological Reactions ... 9
V. Repeatability ... 11
VI. Correlations... 12
A. Between Behavior Tests... 12
B. Correlations With Performance Traits ... 13
VII. Heritability... 16
VIII. Behavior In Other Species ... 16
A. Avian ... 16
B. Canine... 17
IX. Statistical Analysis... 18
A. Repeatabilities/Correlations ... 18
B. Heritability ... 19
X. Conclusion ... 20
Repeatabilities and Heritabilities of Behavior Traits and their relationships with
performance ... 29
Introduction... 29
Materials and Methods... 30
Results... 34
Discussion ... 36
Literature Cited ... 41
List of Tables
Page
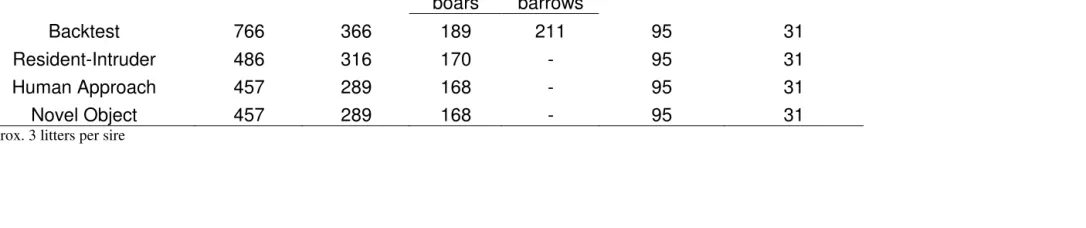
Table 1. Distribution of animals according to indirect measures of behavior ... 46
Table 2: P-Values of fixed effects of sex, dam, sire, nursery pen, human approach
pen, and novel object pen on behavior traits... 47
Table 3: Phenotypic relationships between behavior and performance traits using
multivariate linear modeling ... 48
Table 4: Genetic relationships between behavior and performance traits using
MTDFREML………. 49
Table 5: Heritability estimates and ranges for indirect measures of behavior and
performance traits……….. 50
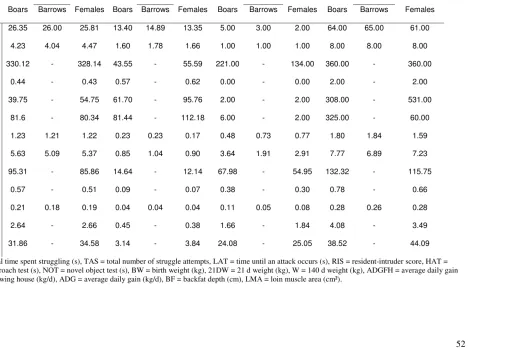
Table 6: Unadjusted Means, Standard Deviations, Minimums, and Maximums for Breed 21 ... 52
List of Figures
Page
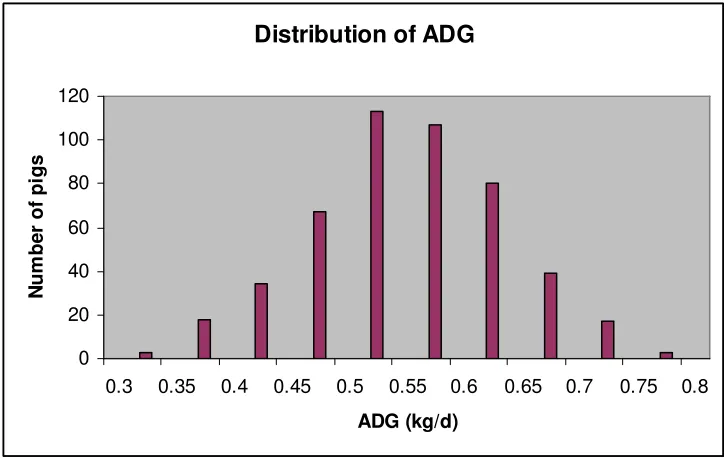
Figure 1. Distribution of ADG... 54
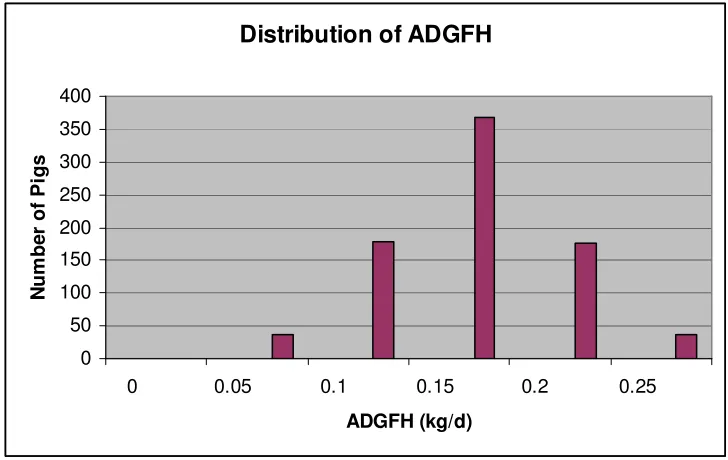
Figure 2. Distribution of ADGFH... 55
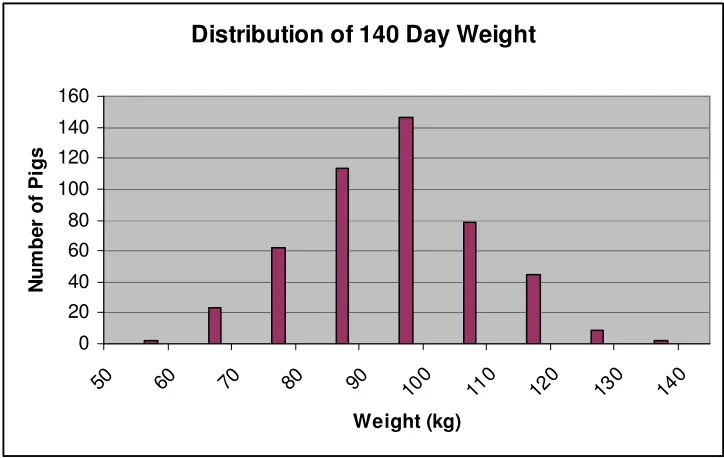
Figure 3. Distribution of 140 day weight... 56
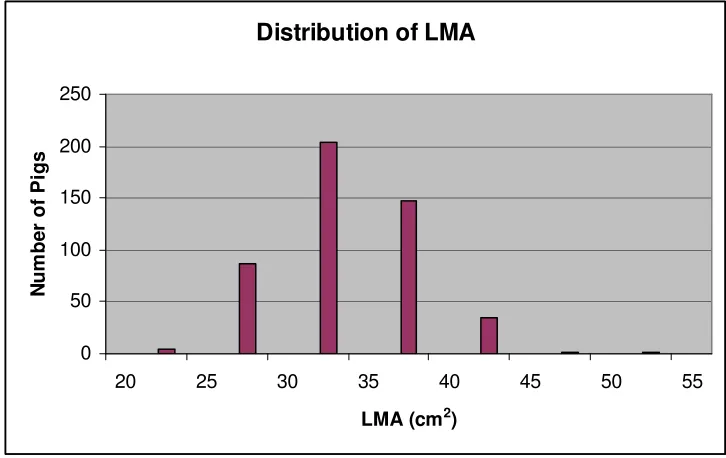
Figure 4. Distribution of LMA ... 57
Figure 5. Distribution of BF... 58
Figure 6. Distribution of BW ... 59
Figure 7. Distribution of the HAT ... 60
Figure 8. Distribution of LAT... 61
Figure 9. Distribution of the NOT ... 62
Figure 10. Distribution of the RIS ... 63
Figure 11. Distribution of TAS... 64
Figure 12. Distribution of TTS ... 65
Literature Review
Introduction:
It is well known that the swine industry wants to produce lean, fast growing, and
efficient pigs. Pigs are housed in generally uniform, confined conditions and selected
based on their performance from a production standpoint. These methods of raising pigs
have been in use for many years; however, recent discussions have given rise to the
well-being of pigs in these conditions. Although the conditions pigs are raised in provide the
physical necessities required for optimum performance, other conditions may affect the
behavior or mental state of the pig, resulting in greater performance. Perhaps a pig that
appears to both physically and mentally thrive in its environment is the answer. It is
possible that tail biting, head knocking, and other perceived negative behaviors are a
reaction to the stress of the pigs’ environment. To address some of the well-being
concerns, tests have been developed as indirect measures of pigs’ behavior; in an effort to
find tests that give an estimate of the pig’s ability to cope with its environmental
conditions and discover if performance is linked to these behaviors.
Coping is the individual response to a stressor by which harmful physiological
effects of this stressor are reduced (Levine, 1989). There has been much debate as to the
validity of a coping behavior being genetic or environmental; however, various animal
studies have shown the existence of two distinct “personality types” that contribute to the
animal’s behavior and reaction to its environment. These two types of animals are
proactive and reactive (Bohus et al., 1987; Benus et al., 1991). Proactive animals are
sympathetic reaction of fight or flight. The reactive animals respond more with
immobility and avoidance and a predominant parasympathetic activation (Ruis et al.,
2000).
It has also been hypothesized that the ability of a pig to cope might be a
composite of several aspects of the pig’s “personality” (van Erp-van der Kooij et al.,
2002). Five dimensions in the “personality” of animals have been suggested to exist and
consist of neuroticism, agreeableness, extraversion, openness, and dominance (Gosling
and John, 1999). Perhaps the indirect behavior tests conducted on pigs measure different
aspects of behavior. Assuming this is true, relationships may be established between
behavior and performance of the animals. Animals demonstrating behavior deemed
favorable, such as a lack of aggression towards other pigs, could then be selected and
overall well-being for pigs in the industry could be improved.
Environmental Impact:
Studies in which pigs were reared under poor conditions and enriched conditions
have led to conclusions that rearing under poor conditions facilitates the development of
social stress later in life. Poor conditions usually have sows in farrowing crates with 67%
concrete floor and a 33% slatted floor. The sow is restrained by metal railings at each
side. No bedding material is present. Piglet contact with other litters is limited to
vocalizations and odors (Olsson et al., 1999). Enriched conditions range but usually
consist of bedding such as straw or sand and allow piglets to interact with piglets of other
litters (Olsson et al., 1999; Bolhuis et al., 2003). Pigs reared under poor conditions and
the establishment of social dominance. Pigs from poor rearing conditions showed less
avoidance behavior in response to social and non-social stressors which supports the idea
of an environmental influence over behavior (van Erp-van der Kooij et al., 2000).
Litter effects have also been found in some studies which points to a possible
maternal environment effect as perhaps a maternal genetic effect (van Erp-van der Kooij
et al., 2000). Long-term behavioral and physiological changes may represent long lasting
effects of acute stressors, but social isolation predominantly determines the long-term
behavioral response (Ruis et al., 2001a).
Behavior Tests:
Backtest:
The backtest allows each piglet to be tested individually. This test consists of
each individual piglet being laid on its back in the supine position for sixty seconds.
During this time one hand is loosely placed over the front half of the piglet to prevent the
pig from getting away when it struggles. The number of escape attempts during the sixty
seconds is recorded. Early studies used this test to classify piglets as resistant,
non-resistant, or intermediate and repeated the test five times. Resistant pigs struggled on
average more than 2 times, non-resistant less than 2 times, and the intermediate averaged
exactly 2 struggles. Most individuals who were classified as non-resistant or resistant
based on all five backtests already showed this in the first and second test. As a result,
performing the backtest twice would suffice (Hessing et al., 1994).
The backtest has been used as a measure of the pig’s ability to cope with what
pig struggles is an indication of a better ability to cope with one’s surroundings. The pig
which struggles the fewest times is demonstrating a better ability to adapt to a stressful
situation. The fact the pig struggles less indicates the pigs’ recognition of a stressful
situation and its reaction to a continual stressor. The pig is still physically being stressed
in the same way; however, the reaction of the pig is less aggressive.
Resident Intruder:
The resident-intruder test is a test designed to measure the aggressiveness of a pig
towards other pigs by recording how long it takes for one pig to attack another. The
resident intruder test allows the individual to express its aggressive behavior in a
relatively unconstrained way. Each test involves two pigs; a resident pig and an intruder
pig from another litter. The resident pen is then divided in half by a solid door. One pig,
a resident, is placed on its own in the test area while the rest of the litter remains on the
other side of the board. The intruder pig is then introduced and the testing time starts.
The test continues until one pig attacks the other, or until the predetermined time has
expired. The allotted time for the test varies and can range from three to five minutes
(Erhard and Mendl, 1997).
When tests are performed in consecutive days some studies have yielded a
priming effect (D'Eath, 2002b; Erhard and Mendl, 1997). As a result of close testing
days, attack latencies decreased and non-attackers became more likely to attack on the
second day (Erhard and Mendl, 1997). Although a change in attack latency occurred, the
ranking between individuals remained the same. The change was merely a scaling effect,
between individuals (Erhard and Mendl, 1997). A sex effect on attack latency and the
likelihood of an attack occurring does appear in some studies. Of the intruders who are
attacked by the resident, male intruders are significantly more likely to fight back than
females (Erhard and Mendl, 1997). In other studies female pigs were more likely to
attack than males and among attacking pigs, females had shorter attack latencies than
their male littermates (D'Eath, 2002b; D'Eath, 2004a).
Attackers tend to be heavier than non-attackers at seven weeks of age but the
relationship disappears as the pigs get older. When attackers are considered alone there
is a significant negative correlation indicating that smaller pigs in a litter attack faster
(Erhard and Mendl, 1997). There is also a correlation in dealing with the weight
difference between resident and intruder. Negative correlations show that the larger the
weight difference between resident and intruder, the longer it takes for the resident to
attack (Erhard and Mendl, 1997). Neither absolute body weight nor weight ranked within
litter appears to be highly correlated with aggressiveness (Erhard and Mendl, 1997;
Gosling, 1999; Meese, 1973; Scheel, 1977), but consisting of heavier and more
aggressive pigs have more skin lesions and less weight gain (D’Eath et al., 2004c).
Attack latency has also been used as a method to predict aggressive behavior after
mixing. The probability of a fight happening, the duration and intensity of the fighting,
and the speed of group integration are all influenced by the level of aggressiveness of the
individual pigs (Erhard and Mendl, 1997). The absolute level of aggressiveness of an
individual, rather than the relative level of aggressiveness as compared to their
opponents, determines the level of aggression shown (Erhard and Mendl, 1997). Pigs
pigs also accept their position in the new hierarchy more easily than pigs with short
attack latencies (Erhard and Mendl, 1997). When mixing pigs, there are conflicting
results. By mixing high with low aggressive pigs the intensity of fighting is reduced
(Erhard and Mendl, 1997). Mixing low- with other low-aggressive pigs maintains this
effect, but speeds up group integration, thus, from a well-being standpoint it appears to be
preferable for pigs to be mixed in groups consisting of only low-aggressive pigs (Erhard
and Mendl, 1997).
During repeated resident-intruder tests, pigs from poor rearing conditions inflicted
more damage on their opponents than pigs from enriched conditions. The
dominant/subordinate relationships were rapidly and distinctly established in pigs from
enriched conditions, but not in pigs from poor conditions (Olsson, 1999). In groups with
enriched conditions almost 100% of the confrontations were won by the residents, in
contrast to the poor rearing conditions where confrontations were won in almost equal
proportions (Olsson, 1999). These results support the idea that a lack of social skills in
pigs from poor rearing conditions, underlie the increased levels of stress leading people to
believe that the behavioral reaction to stress is a result of environmental factors.
Overall, weight and aggressiveness each affected different aspects of aggressive
behavior at mixing. Weight predicted success in agonistic interactions, but
aggressiveness affects the nature and time scale of the interaction. Highly aggressive
pigs tend to show more one-sided aggression by bullying the other pigs as well as being
Social Confrontation Test:
At one week of age, two to three piglets from one litter are placed in a metal crate
together with two to three piglets from another litter. The duration of the test is thirty
minutes and during this time the occurrences of certain behavior elements are recorded.
These elements are sniffing, threat, head knock, biting, fighting, chasing, fleeing,
withdrawal, passive, and fight initiative. Immediately after each observation some
studies had the piglets classified as aggressive or non-aggressive. In most studies the test
is repeated a week later and all the piglets are given new classifications. This test was
first used to show that pigs exhibit consistent individual behavioral characteristics. The
majority of the piglets classified as aggressive at only one week of age were again
classified as aggressive at an older age when the test was repeated (Hessing et al., 1993).
Novel Object Test:
The novel object test is a method used to measure the pig’s reaction to an
unfamiliar object. Many ways to perform this test have been developed. One such way
involves each pig being alone in its home pen. From a position outside the pen, the
observer throws an object into the pen so that the object lands in the center of the pen.
The behavior of the pig is then observed for a given amount of time. Such behaviors are
approach, manipulate, sniff, avoid, and playing with the object (Olsson, 1999). Another
version of the test consist of the pigs remaining in their home pen together and the novel
object being hung from the ceiling so it will be a few inches off the ground in the middle
of the pen. The time taken for each pig to make snout contact with the object is then
Human Approach Test:
The human approach test (HAT) is a way to measure the pig’s reaction to
unfamiliar humans in an effort to judge how the pig will cope with the stress of being
around humans everyday. The test takes place in the home pen of the pig and the time it
takes the pig to make contact with the human is recorded. All pigs in a pen are present at
the time of testing and remain in the pen until all pigs have made contact with the human
(van Erp-van der Kooij et al., 2002).
Open Door Test:
In an open door test (ODT), the door of the pen is opened and how fast the pigs
leave their home pen is recorded. In some studies the time it took each pig to reach
certain distances away from the pen is also recorded (van Erp-van der Kooij et al., 2002).
The test is used as a measurement of exploratory behavior and is an attempt to quantify a
pig’s desire to flee its home environment.
Novel Environment Test:
The novel environment test (NET) is usually performed in an arena with solid
walls and a solid concrete floor. The arena is connected to a start box and both are
separated by a sliding door. After being removed from their home pen pigs are gently
driven into the start box. Pigs are then given an adjustment time of approximately 2 min.
in the start box to acclimate to the change in environment. When the adjustment time
a predetermined amount of time. Behavior parameters determined are usually latency to
leave the start box, which requires all four legs being outside the start box, and the
distance traveled in the arena. Number of vocalizations can also be recorded during the
pig’s time in the arena (Ruis et al., 2001a). Similarly to the open door test, the novel
environment test is an attempt to measure exploratory behavior.
Biological Reactions:
Physiologically, when comparing high-resistant and low resistant gilts in a group,
the low resistant gilts had higher mean scores of reactivity of the
hypothalamic-pituitary-adrenocortical (HPA) system. Gilts were scored according to the number of escape
attempts in the backtest. Pigs were classified as low resistance when less than 3 escape
attempts were made and as high resistance when more than 4 attempts were observed.
The low resistant gilts displayed higher cortisol responses to the first novel object test, to
routine weighing, and to administration of ACTH (Ruis et al., 2000). Compared to levels
prior to stress procedures, social defeat also causes significant increases in ACTH and
cortisol concentrations. Social defeat significantly increases plasma catecholamine and
prolactin concentrations (D'Eath, 2002b). The hormonal changes have been shown to be
short-lived following termination of the stressor (D'Eath, 2002b). Pigs housed together
have yielded evidence that low resistant pigs in the backtest show higher baseline
salivary cortisol levels than high resistant pigs (Geverink, 2002). Pigs classified as low
resistant may be better equipped to deal with stressors due to a natural elevation in
A relationship also exists between gender and the backtest scores. Castrated
males tend to resist less than females which becomes more apparent the more the pigs
mature. A possible explanation for this effect might be the decreasing level of hormones,
such as testosterone, after castration, which becomes more evident with time (van
Erp-van der Kooij et al., 2000).
Higher cardiovascular activities are characteristic of some pigs. Some pigs
exhibit higher heart rates in reaction to certain stimuli. These higher heart rates are seen
in the NOT and the aversion test and are most prevalent when the pig is isolated (Ruis et
al., 2001a). When kept in groups low resistant and high resistant pigs showed no
difference in heart rate reactivity and were not shown to relate to backtest response
(Geverink, 2002).
Some studies involving the immune response of pigs have demonstrated that the
effect of housing on immune response of pigs depends on the individuals’ ability to cope.
Pigs selected for divergent responses to the backtest vary in KLH-induced lymphocyte
proliferation and in the impact of housing on antibody responses to KLH. Higher
resistant pigs showed a higher Con A-induced lymphocyte proliferation than low resistant
pigs (Bolhuis et al., 2003); however, more recent studies have shown no relationship
between the backtest and humoral immunity (Geverink et al., 2004).
The largest biological effect comes after the pig is isolated. Regardless of how
the pig scores on the behavior test isolation is a stressful situation, the only difference is
the degree of stress. Several responses to isolation point to a prolonged higher state of
stress in high resistant pigs. Body temperature in high resistant gilts failed to recover
the percentages of leukocyte subsets were only developed in high resistant pigs (Ruis et
al., 2001b). Pigs that score high resistant on the backtest show lower circadian cortisol
concentrations and a diminished heart rate response to feed delivery when compared with
low resistant pigs (Geverink, 2003).
Repeatability:
In a study done using only gilts there was no agreement between responses to the
backtest (Ruis et al., 2000). The number of escape attempts, duration of escape behavior
and number of vocalizations were not found to be repeatable. No consistency was found
in the novel environment test; however, aggression measured in group-feeding
competition tests among gilts has been found to be very consistent (Rs = 0.61; P = 0.003)
In this study tests were done at 14 weeks of age whereas, in studies where the backtest
was found to be repeatable, studies were performed at only seven weeks of age (Ruis et
al., 2000). Different and specific experiences for each individual pig may affect the
perception of the backtest; therefore yielding conflicting repeatabilities in multiple
studies. Time of day, age, and the awareness of the animal at the time of testing also may
influence the reaction to the backtest. Studies done addressing these questions have led
to findings that do show a repeatability for the backtest between 0.27 and 0.40 (van
Erp-van der Kooij et al., 2002; Erp-van Erp-Erp-van der Kooij et al., 2001). These studies also show
that correlations between successive backtests with only animals that were fully awake,
were not higher than experiments where piglets could be sleeping just before testing.
The order in which animals are tested appears to have no influence on how that animal
will perform on the backtest (van Erp-van der Kooij et al., 2001).
Resident-intruder studies have produced evidence of consistent individual
differences over time in both the occurrence of an attack and in attack latency. After
adjusting for treatment, sex, and litter, evidence is still present for consistent differences
between individuals in the resident intruder test. Consistency appears to increase the
more frequent the test is performed possibly due to the behavior of the pig becoming
more developed as the pigs age (D'Eath, 2004a).
Data collected on the NOT has led to a repeatability of 0.26 (P<0.05) while the
ODT appears to be repeatable as well with a repeatability of 0.24 (P<0.05) (van Erp-van
der Kooij et al., 2002).
Correlations:
Between Behavior Tests:
When both the social confrontation test and the backtest were performed on the
same pigs, an association between the two was found. About 75% of the piglets
classified as aggressive or non-aggressive in the social confrontation test were, the
resistant and non-resistant individuals, respectively, in the backtests (Hessing et al.,
1993). Several studies support this observation that the social confrontation test and the
backtest are associated (Bohus et al., 1987; Benus et al., 1990).
S. Giroux et al. (2000) found that piglets gaining more weight after weaning than
their pen-mates are more aggressive, while those gaining less weight are more
response to the stress of isolation and novelty measured during the first week after
weaning. This suggests that piglets who remain calm after weaning dissipate less energy
than piglets reacting actively, thereby gaining more weight the first week after weaning
(Giroux et al., 2000).
When comparing the backtest to the novel environment test high resistant gilts
and low resistant pigs from the backtest differ in their results in the novel environment
test. Low resistant pigs showed a significantly longer latency time to leave their home
pen in the first novel environment test and a tendency for a longer latency time in a
second novel environment test (Ruis et al., 2000; van Erp-van der Kooij et al., 2002).
For latencies to contact a human, gilts classified as low-resistant in the backtest
had significantly higher values (Ruis et al., 2000). Correlations between HAT, NOT, and
ODT have also been established along with a pen effect. Test have shown that animals in
a pen consisting of only pigs scored as high resistant in the backtest have higher test
results than animals in low resistant pens. Low resistant pigs seem to hesitate longer to
leave their home pen and to contact a human (Ruis et al., 2001). The HAT and NOT
have been shown to have a phenotypic correlation between 0.35 and 0.44 (P<0.05). A
correlation between the ODT and the NOT has also been suggested between 0.18 and
0.40 (P<0.05) while the correlation between the ODT and the HAT appears to be between
0.18 and 0.24 (P<0.05) (van Erp-van der Kooij et al., 2002).
Correlations with Performance Traits:
There are conflicting results in swine on the correlation between growth and the
reaction to humans and pig growth (Giroux et al., 2000), but there appears to be a
relationship between human reactivity and pork quality. Pigs that are less aggressive and
have a positive reaction to human contact perform better on meat quality test than those
pigs who reactive negatively to human contact (Terlouw et al., 2005).
Although no consensus has been established on the relationship between growth
and the reaction to humans, there is a relationship between the reaction to humans at an
early age and a sow’s maternal ability. It has yet to be established if this relationship is
because of a genetic factor or something the pig has learned. A reduced level of fear of
humans is associated with a shorter duration of farrowing, shorter average durations of
inter-birth intervals, less variation in inter-birth intervals and fewer piglets dying without
milk in their stomachs. In addition, reduced fear of humans tended to be associated with
a reduced number of stillborn piglets and fewer numbers of live piglets dying within three
weeks of age (Janczak, 2003).
In some studies no relationships were found between daily weight gain in the
suckling period, weaning or fattening period and the backtests scores, or between the
backtest scores and weight (Geverink, 2002; van Erp-van der Kooij et al., 2000). Backtest
score and lean meat percentage at the slaughterhouse were positively related as was the
backtest and carcass grading at the slaughterhouse, but only after being corrected for
gender, sow identity, artificial insemination (AI) and weight (van Erp-van der Kooij et
al., 2000). On the individual animal level relationships have also been found between the
backtest and performance. Animals with high backtest scores had less millimeters (mm)
muscle in the carcass, a lower daily weight gain (DWG) in the suckling period, and a
results support the need for further exploration. This contradicts earlier work that found
high resistant pigs to be heavier than low resistant pigs (Ruis et al. 2000). High resistant
pigs were also found to have a higher lean meat percentage (%LM) and less mm backfat
in the carcass at slaughter (van Erp-van der Kooij, 2003; Van Erp-van der Kooij et al.
2000).
The resident-intruder test has shown some relationships with performance.
Groups composed of pigs with higher aggressiveness scores had lower weight gain after
mixing. The heaviest pigs gained the most weight after mixing occurred. Based on these
results Richard (1995) suggested that the presence of aggressive pigs in a group could
have affected weight gain because pigs increased their energy expenditure on aggressive
behavior and do not fully compensate by increasing feed intake. Social stress may lead to
suppressed appetite through the action of corticotropin-releasing factor (Heinrichs and
Richard, 1999). More aggressive pigs may also be less tolerant of a defeated pig near the
feeder which would result in restricted access to food for that pig (D'Eath, 2002a).
As seen in studies involving mice (Ryan and Wehmer, 1975) and rats (Seitz,
1954), larger litter size is a predictor of increased aggression in the pigs. In larger litters
piglets generally compete more vigorously for access to the teats and gain less weight
(Fraser, 1975). This may be due to the lower availability of nutritional resources in a
larger litter. This may program pigs born into larger litters to show more aggression
towards intruders later in life because of the instilled idea of defending scarce food
Heritability:
Preliminary data suggest some indirect measures of behavior are heritable. Sows
with lower backtest scores when they were piglets yielded offspring with lower backtest
scores and a trend was found between the backtest score of the piglet and sow reaction
(van Erp-van der Kooij et al., 2000).
Behavior In Other Species:
Avian:
In young birds, a positive phenotypic correlation of 0.24 exists between an active
open-field response and high levels of pecking in a social test. At a young age genetic
correlations, between body weight and gentle feather pecking, range from 0.20 to 0.66
(Bessei, 1984). In adults, a positive genetic correlation of 0.62 exists between the
open-field response and pecking behavior (Rodenburg et al., 2004). Birds that are more fearful
and less social as young chicks showed higher levels of pecking as adult hens
(Rodenburg et al., 2004).
Van Oers and colleagues (2004) demonstrated that avian “personality” traits are
genetically correlated and range from 0.51 to 0.66 for individual test values. For nest
means correlations ranged from 0.84 to 1.00. Risk taking behavior, a combination of the
novel environment and novel object test, had a genetic correlation of 0.58 with early
exploratory behavior when done individually; however, the correlation was 0.84 when
nest means were used (Van Oers et al., 2004).
Dingemanse and colleagues (2002) estimated the repeatability and heritability of
ranged from 0.27 to 0.66 while the heritability ranged from 0.22 to 0.61 (Dingemanse et
al., 2002).
Canine:
In German Shepard dogs heritability estimates for temperament and hip dysplasia
were 0.51 and 0.26, respectively. A genetic correlation between the two traits was
estimated as -0.33 (Mackenzie et al., 1985). A strong sex effect existed for temperament.
Male dogs scored more favorably in regards to temperament. Mackenzie and colleagues
found no maternal effects for temperament; however, other studies have suggested that
maternal effects are dependent on how long the puppies are left with the dam (Scott and
Fuller, 1965).
A study conducted by Brown and colleagues (1978) investigated the effect on
inbreeding on behavior in pointer dogs. A small increase in morbidity was associated
with inbreeding. Neither inbreeding of litter or dam significantly influenced other
behavior traits or heart rate (Brown et al., 1978). Increased inbreeding of litter increased
the number of atrioventricular blocks. The relatively small effects that increased
inbreeding had on the traits of human aversion suggested that most of the variability in
traits associated with human aversion was the result of additive gene action (Brown et al.,
Statistical Analysis:
Repeatability/Correlations:
In calculating the repeatability of the tests, correlations between two consecutive
tests were calculated using the Pearson correlation test (van Erp-van der Kooij et al.,
2002; van Erp-van der Kooij et al., 2001). The Pearson correlation test measures the
strength of the linear relationship between two variables and assumes both variables are
approximately normally distributed and their joint distribution is bivariate normal. In the
situation where the data is not normally distributed a chi-square test is applied. A chi
square statistic is used to investigate whether distributions of categorical variables, as is
the case with the resident-intruder test score, differ from one another. The chi square
statistic compares the counts of categorical responses between two independent groups.
Repeatability has also been estimated as the proportion of variance attributed to
the individual pig. This is accomplished using the Proc Mixed procedure of SAS (SAS
Inst., Inc. Cary, NC). As with the Pearson correlation coefficients, the proc mixed
procedure assumes the data are normally distributed. This procedure provides not only
means, but variances and covariances as well. In the proc mixed procedure the data are
permitted to exhibit correlation and nonconstant variability.
Pearson correlation coefficients have also been used for calculating phenotypic
correlations between the behavior traits; however, for group tests such as the human
approach, relationships were calculated by using multivariate linear modeling (van
Erp-van der Kooij et al., 2002). Multivariate linear modeling is especially useful and has
modeling allows for measuring several different variables in a single experiment. As a
result, there is a better chance of discovering which factors are truly important.
Heritability:
In cases of vast amounts of phenotypic data, the classical experimental designs to
estimate heritability will not suffice. When information is available on more distant
relatives and several generations it is best to use maximum likelihood (ML) (Falconer
and McKay, 1996). Maximum likelihood procedures can accommodate any structure of
genetic relationships in data, thus allowing all the information available to be taken into
account. According to Falconer and McKay (1996) restricted maximum likelihood
(REML) is now the method of choice for estimating heritability and variance
components. Restricted maximum likelihood is preferred because of its ability to
eliminate one of the biases of a ML procedure. Restricted maximum likelihood adjusts
the observations for the estimates of the fixed effects, thus eliminating the underestimates
of variance (Falconer and McKay, 1996).
Multiple trait derivative-free maximum likelihood (MTDFREML) is a set of
programs used to estimate variance components using animal models and derivative-free
REML. This program can be used for single trait, bivariate, and multiple trait animal
models with repeated records including traits with sex limited expression (Boldman et al.,
1993). Multiple trait derivative-free maximum likelihood is the method of choice when
not all the animals in the pedigree have records. Multiple trait derivative-free maximum
animals with records, but also for parents and other relatives in the pedigree (Boldman et
al., 1993).
Conclusion:
Recent evidence clearly shows that the behavior of pigs is determined by a
combination of genetic and environmental factors. One is not more important than the
other and both decide how an animal will react to different stimuli. Isolation has been
shown to affect all pigs regardless of how they perform in the behavior test which
supports the long standing notion that pigs are social animals. The difference in the tests
comes into play with how the pig deals with the stress of environmental changes. Stress
responses to isolation have been shown to differ in magnitude and duration between pigs
classified as high or low resistant in the backtest. Low resistant pigs exhibit higher levels
of cortisol and generally show more exploratory behavior, perhaps indicating a better
ability to adapt to changes in its surroundings (Ruis et al., 2001b). For high resistant pigs
social isolation seems to be a chronic stressor while low resistant pigs are able to adapt to
the isolation.
Although a general consensus has yet to be reached on the exact relationship
between behavior and performance, most research has yielded some correlation between
the two. Terlouw et al. (2005) found that pigs that are less aggressive and have a positive
reaction to human contact perform better on a meat quality test than pigs who reactive
negatively. A sow’s maternal ability has also been related to a positive reaction to
humans (Janczak, 2003). From these findings it can be theorized that a favorable reaction
The backtest has also been linked to performance; however, conflicting results
have been published. Some studies found a favorable relationship between the backtest
and performance (van Erp-van der Kooij et al., 2000), while others found negative
relationships (Ruis et al., 2000). Conflicting results are also found with the
resident-intruder test. It is unclear which studies are correct in their estimates of relationships
between performance and behavior; however, it is overwhelming clear that research in
this area must continue. A relationship between performance and behavior obviously
exist but only time will confirm if this relationship is economically favorable.
Much debate also surrounds the relationships between the indirect measures of
behavior. Some correlations between these measures of behavior have been published,
yet a consensus on these relationships has yet to come. Each measure of behavior may
account for a different portion of the pig’s character. A lack of relationships between
these measures would show that these portions are independent of each other and
measure different aspects of the pig’s character. On the other hand, if traits are shown to
be related then it is quite possible that they measure similar aspects of the animal’s
character and performing both tests may not be necessary.
From the information given one might conclude that the industry should consider
performing indirect measures of behavior on their piglets and incorporating these
measures into their selection criteria. Investigation needs to continue in relation to litter
size and aggression, since larger litter size appears to yield higher aggressive pigs later in
life (D'Eath, 2004b). Overall the indirect measures of behavior give a small amount of
short amount of time is left until indirect measures of behavior are incorporated into
Literature Cited
Benus, R. F., B. Bohus, J. M. Koolhaas, and G. A. van Oortmerssen. 1991. Behavioural
differences between artificially selected aggressive and non-aggressive mice:
Response to apomorphine. Behav Brain Res 43: 203-208.
Bessei, W. 1984. Untersuchungen zur Heritabilitat des Federpickverhaltens bei
Junghennen. I. Mitteilung. Arch. Geflugelk. 48: 224-231.
Bohus, B., R. F. Benus, D. S. Fokkema, J. M. Koolhaas, C. Nyakas, G. M. Van
Oortmerssen, A. J. A. Prins, A. J. H. de Ruiter, A. J. W. Scheurink, and A. B.
Steffens. 1987. Neuroendocrine states and behavioral and physiological stress
responses. Prog Brain Res 72: 57-70.
Boldman, K. G., L. A. Kriese, L. D. Van Vleck, and S. D. Kachman. 1993. A manual for
use of MTDFREML. A set of programs to obtain estimates of variances and
covariances [Draft]. U.S. Department of Agriculture, Agricultural Research
Service.
Bolhuis, J. E., H. K. Parmentier, W. G. Schouten, J. W. Schrama, and V. M. Wiegant.
2003. Effects of housing and individual coping characteristics on immune
responses of pigs. Physiol Behav 79: 289-296.
Brown C. J., O. D. Murphree, and J. E. O. Newton. 1978. The effect of inbreeding on
human aversion in pointer dogs. J. Heri. 69: 362-365.
D'Eath, R. B. 2002a. Individual aggressiveness measured in a resident-intruder test
predicts the persistence of aggressive behavior and weight gain of young pigs
D'Eath, R. B. 2004a. Consistency of aggressive temperament in domestic pigs: The
effects of social experience and social disruption. Aggress. Behav. 30: 435-448.
D'Eath, R. B., Lawrence, Alistair B. 2004b. Early life predictors of the development of
aggressive behaviour in the domestic pig. Anim. Behav. 67: 501-509.
D'Eath, R. B., Pickup, H. E., & Burn, C. C. 2004c. Pig Aggression. Retrieved May 27,
2004, from http://www.sac.ac.uk/animal/External/AnimalWelfare/Pig/Aggression
D'Eath, R. B., Pickup, Helena. 2002b. Behaviour of young growing pigs in a
resident-intruder test designed to measure aggressiveness. Aggress. Behav. 28: 401-415.
Dingemanse, Niels J., Christiaan Both, Piet J. Drent, Kees Van Oers, and Arie J. Van
Noordwijk. 2002. Repeatability and heritability of exploratory behaviour in great
tits from the wild. Anim. Behav. 64: 929-938.
Erhard, H. W., and M. Mendl. 1997. Measuring aggressiveness in growing pigs in a
resident-intruder situation. Appl. Anim. Behav. Sci. 54: 123-136.
Falconer, D. S., Mackay, T.F.C. 1996. Introduction to quantitative genetics. 4 ed. Pearson
Prentice Hall, New York
Fraser, D. 1975. The 'teat order' of suckling pigs ii. Fighting during suckling and the
effects of clipping the eye teeth. J. Agri. Sci. 84: 393-394.
Geverink, N. A., H. K. Parmentier, G. de Vries Reilingh, W. G. P. Schouten, G. Gort, and
V. M. Wiegant. 2004. Effect of response to backtest and housing condition on
cell-mediated and humoral immunity in adult pigs. Physiol. Behav. 80: 541-546.
Geverink, N. A., Schouten, S.G.P., Gort, G., Wiegant, V.M. 2002. Individual differences
in aggression and physiology in peri-pubertal breeding gilts. Appl. Anim. Behav.
Geverink, N. A., Schouten, S.G.P., Gort, G., Wiegant, V.M. 2003. Individual differences
in behaviour, physiology and pathology in breeding gilts housed in groups or
stalls. Appl. Anim. Behav. Sci. 81: 29-41.
Giroux, S., G. Martineau, and S. Robert. 2000. Relationships between individual
behavioural traits and post-weaning growth in segregated early-weaned piglets.
Appl. Anim. Behav. Sci. 70: 41-48.
Gosling, S. D., John, O.P. 1999. Personality dimensions in non-human animals: A cross
species review. Current Directions in psychological science 8: 69-75.
Heinrichs, S. C., and D. Richard. 1999. The role of corticotropin-releasing factor and
urocortin in the modulation of ingestive behavior. Neuropeptides 33: 350-359.
Hessing, M. J., A. M. Hagelso, W. G. Schouten, P. R. Wiepkema, and J. A. van Beek.
1994. Individual behavioral and physiological strategies in pigs. Physiol. Behav.
55: 39-46.
Hessing, M. J. C. et al. 1993. Individual behavioural characteristics in pigs. Appl. Anim.
Behav. Sci. 37: 285-295.
Hessing, M. J. C., Schouten, W.G.P., Wiepkema, P.R., Tielen, M.J.M. 1994. Implication
of individual behavioural charcteristics on performance in pigs. Livestock Prod.
Sci. 40: 187-196.
Janczak, A. M., Pedersen, Lene J., Rydhmer, Lotta, Bakken, Morten. 2003. Relation
between early fear- and anxiety-related behaviour and maternal ability in sows.
Appl. Anim. Behav. Sci. 82: 121-135.
Levine, S., and S. G. Wiener. 1989. Coping with uncertainty: A paradox. Academic
Mackenzie, Stephen A., Elizabeth A. B. Oltenacu, and Eldin Leighton. 1985.
Heritability Estimate for Temperament Scores in German Shepard Dogs and Its
Genetic Correlation with Hip Dysplasia. Behav. Gen. 15: 475-482.
Meese, G. B., and R. Ewbank. 1973. The establishment and nature of the dominance
hierarchy and the domesticated pig. Animal Behaviour 21: 326-334.
Olsson, I. A. S., de Jonge, F.H., Schuurman, T., Helmond, F.A. 1999. Poor rearing
conditions and social stress in pigs: Repeated social challenge and the effect on
behavioural and physiological responses to stressors. Behavioural Processes 46:
201-215.
Richard, D. 1995. Exercise and the neurobiological control of food intake and energy
expenditure. Int J Obes Relat Metab Disord 19 Suppl 4: S73-79.
Rodenburg, T. B., A. J. Buitenhuis, B. Ask, K. A. Uitdehaag, P. Koene, J. J van der Poel,
J. A. M. van Arendonk, and H. Bovenhuis. 2004. Genetic and Phenotypic
Correlations Between Feather Pecking and Open-Field Response in Laying Hens
at Two Different Ages. Behav. Gen. 34: 407-414.
Ruis, M. A., Johanna de Groot, Joop H. A. te Brake, E. Dinand Ekkel, Johan A. van de
Burgwal, Jo H. F. Erkens, Bas Engel, Willem G. Buist, Harry J. Blokhuis, and
Jaap M. Koolhaas. 2001a. Behavioural and physiological consequences of acute
social defeat in growing gilts: Effects of the social environment. Appl. Anim.
Behav. Sci. 70: 201-225.
Ruis, M. A., Joop H. A. te Brake, Bas Engel, Willem G. Buist, Harry J. Blokhuis, and
stress responses of growing gilts with different coping characteristics. Physiol.
Behav. 73: 541-551.
Ruis, M. A., Joop H. A. te Brake, Johan A. van de Burgwal, Ingrid C. de Jong, Harry J.
Blokhuis, and Jaap M. Koolhaas. 2000. Personalities in female domesticated pigs
behavioural and physiological indications. Appl. Anim. Behav. Sci. 66: 31-47.
Ryan, V., and F. Wehmer. 1975. Effect of postnatal litter size on adult aggression in the
laboratory mouse. Dev Psychobiol 8: 363-370.
Scheel, D. E., Graves, H.B., Sherritt, G.W. 1977. Nursing order, social dominance and
growth in swine. Journal of Animal Science 45: 219-229.
Scott, J. P., and J. L. Fuller. 1965. Dog Behavior-the Genetic Basis, University of
Chicago Press, Chicago.
Seitz, P. F. 1954. The effects of infantile experiences upon adult behavior in animal
subjects. I. Effects of litter size during infancy upon adult behavior in the rat. Am
J Psychiatry 110: 916-927.
Smart, J. L. 1981. Multidisciplinary approaches to aggression research. Elsevier/North
Holland, Amsterdam.
Terlouw, E. M., J. Porcher, and X. Fernandez. 2005. Repeated handling of pigs during
rearing. Ii. Effect of reactivity to humans on aggression during mixing and on
meat quality. J Anim Sci 83: 1664-1672.
van Erp-van der Kooij, E., A. H. Kuijpers, J. W. Schrama, F. J. C. M. van Eerdenburg,
W. G. P. Schouten, and M. J. M. Tielen. 2002. Can we predict behaviour in pigs?
Searching for consistency in behaviour over time and across situations. Appl.
van Erp-van der Kooij, E., A. H. Kuijpers, J. W. Schrama, E. D. Ekkel, and M. J. Tielen.
2000. Individual behavioural characteristics in pigs and their impact on
production. Appl. Anim. Behav. Sci. 66: 171-185.
van Erp-van der Kooij, E., A. H. Kuijpers, F. J. van Eerdenburg, and M. J. Tielen. 2001.
A note on the influence of starting position, time of testing and test order on the
backtest in pigs. Appl. Anim. Behav. Sci. 73: 263-266.
van Erp-van der Kooij, E., Kuijpers, A.H., van Eerdenburg, F.J.C.M., Tielen, M.J.M.
2003. Coping characteristics and performance in fattening pigs. Livestock Prod.
Sci. 84: 31-38.
van Oers, Kees, Gerdien de Jong, Piet J. Drent, and Arie J. van Noordwijk. 2004. A
Genetic Analysis of Avian Personality Traits: Correlated, Response to Artificial
Introduction:
Animal well-being has become an ongoing concern in the swine industry.
Current housing and production procedures at many commercial swine facilities have
raised concerns regarding pig well-being. Pigs are housed in generally uniform, confined
conditions and selected based on their performance from a production standpoint.
Although the conditions pigs are raised in provide the physical necessities required for
optimum performance, other conditions may affect the behavior or mental state of the
pig, resulting in greater performance. In response to this growing concern, tests have
been developed to help quantify pig behavior and provide some insight into the pig’s
well-being.
Over the past few decades many behavior tests have emerged with varied results.
Two widely used tests are the backtest and resident-intruder tests. Backtest is used as a
measure of a pig’s ability to cope with what may be perceived as a stressful situation and
is conducted on pigs between 7 and 21 d of age (Hessing, 1993). Resident-intruder test is
a measure of a pig’s aggressiveness towards other pigs, and is recorded in the nursery
(Erhard and Mendl, 1997). Other tests are human approach, novel object, social
confrontation, and open door.
All tests have been performed on various lines of pigs and repeatabilities and
correlations have been estimated; however, highly variable results have slowed progress
in reaching overall consensus on the tests’ repeatabilities and correlations among the
tests. (D'Eath, 2002a; Janczak, 2003; van Erp-van der Kooij, 2003; van Erp-van der
publications on the heritabilities of indirect measures of behavior, van Erp-van der Kooij
and colleagues (2000) suggest that some of the tests are heritable. Progeny of sows with
lower backtest scores have lower backtest scores (van Erp-van der Kooij et al., 2000).
Bunter and Lansdowne supported this in a discussion paper at a genetics workshop,
providing estimates for the heritability of the backtest (Bunter, Kim and Richard
Lansdowne, 2004).
Perhaps the lack of a consensus on the relationship of behavior with performance,
is due to only one or two behavior tests being conducted on a group of pigs. Published
estimates of the variance and covariance relationships among indirect measures of
behavior are lacking at this time. These estimates are essential for determining if genetic
selection for behavior could be implemented into future breeding programs. For this
study pigs were subjected to the backtest, resident-intruder test, human approach test, and
novel object test. Performance data were collected on individual pigs. The objective was
to calculate repeatabilities and correlations among the behavior and performance traits, as
well as, provide heritability estimates for behavior traits.
Materials and Methods:
Housing and Animals:
The experiment was performed on pigs maintained at the North Carolina
Department of Agriculture Tidewater Research Station in Plymouth, North Carolina. The
housing was similar to general farming practice. The backtest consisted of 766 animals
(Table 1). Due to limited space the resident intruder test consisted of 486 animals and the
which each litter had a least one representative with an average of 3 litters per sire (Table
1). Sows farrowed in crates, and between 23 and 37 d of age pigs were weaned and
transferred to the nursery. At approximately 56 d of age pigs were transferred to the
finishing floor and grouped 10 or 11 to a pen according to size and sex.
Data Collection:
Pigs were weighed at birth (BW) and at approximately 21 d of age (21DW).
Between 172 and 198 d of age, weights (W) and ultrasound measurements of 10th rib
backfat depth (BF) and loin muscle area (LMA) were collected by a certified ultrasound
technician. BF and LMA were then adjusted according to the weight of the animal.
Backtest:
A backtest was performed as described by Hessing et al. (1993). The backtest
consisted of each piglet being put on its back and gently restrained in the supine position
for 60 s. One hand was placed loosely over the head of the piglet and the other placed
loosely over the hind legs. Each time the piglet wriggled without pause was counted as
one struggle attempt. Total number of attempts to struggle (TAS) and duration of each
struggle (TTS) were recorded. If a pig continued to struggle at the end of the testing
period, the period was extended until the end of the attempt (Cassady, 2007). Each piglet
was tested twice during the suckling period with a week between repetitions and no test
Resident Intruder:
The resident intruder test took place in the nursery on pigs between 23 and 40 d of
age. Each test involved two pigs; a resident pig and an intruder pig from another litter.
The resident pen was then divided in half by a solid door. One pig, a resident, was placed
in the test area while the rest of the litter remained on the other side of the board. The
intruder pig was then introduced and the 3 min testing period began. The test continued
until one pig attacked the other, or until 3 min expired (D'Eath, 2002a). The time taken
until an attack occurred (LAT) was recorded and pigs which failed to attack were given a
time of 3 min. Total number of attacks was also recorded and the cumulative number of
attacks during the two tests yielded the pigs resident intruder score (RIS). When the first
attack occurred, pigs were separated immediately and the test was terminated. Each pig
was tested twice with a week interval between tests. Each intruder was used twice unless
it attacked the resident in that case it was not used as an intruder again on that day. Tests
were divided by sex so only females were tested with females and males with males.
Human Approach/Novel Object:
Human approach and novel object tests took place on the finishing floor in the
home pen of the pigs. The HAT was performed at approximately 150 d of age and the
NOT at approximately 170 d of age. All pigs were present in the pen at the same time.
An unknown human entered the pen and stood motionless in the center of the pen and the
time taken for each individual pig to make snout contact with the human was recorded.
and the time taken for each pig to make snout contact with the object was recorded. Each
test was performed twice with no less than 1 wk between tests and each test lasted for 5
min or until all pigs made contact with the human or object (van Erp-van der Kooij et al.,
2002). If no contact was made, the pig was given the maximum time of 5 min.
Statistical Analysis:
Phenotypic Analysis:
Pearson correlation coefficients were calculated for all variables. Repeatability
was calculated as the total amount of variance due to the individual using the Proc Mixed
procedure in SAS (SAS Inst., Inc. Cary, NC). Fixed effect for the backtest was sex.
Fixed effects for the resident intruder test were sex and nursery pen. Fixed effects for
HAT and NOT were sex and pen. Pig was included as a random effect, and repeatability
was estimated by dividing the variance due to the individual pig by the total variance.
For the resident-intruder test a chi-square test was performed to test for a difference
between total number of attacks between the two repetitions.
Regression coefficients were estimated for the effects of weight on backfat and
loin muscle area as well as the effect of age on 140 d weight. These regression
coefficients were then used to adjust backfat and loin muscle area to the average weight
of the population, 110 kg. All subsequent analyses were conducted using adjusted values
for backfat depth and loin muscle area. To calculate the relationships between the
behavior traits and performance traits multivariate linear modeling (PROC GLM in SAS)
was used. The model used to test the behavior traits and the performance traits included
Fixed effects of nursery pen, human approach pen, and novel object pen were included
where appropriate to account for any environmental effects of pen.
Genotypic Analysis:
To estimate heritability of the behavior traits the animal model was chosen and
data were analyzed using MTDFREML (Boldman et al., 1993). The model for TTS,
TAS, and BW had a fixed effect of sex. All other traits included fixed effects of sex and
pen. Maternal effect was included as a second animal effect for all traits. Heritabilities
for all traits were estimated using a single trait model. Genetic correlations for behavior
with performance were estimated using a two trait model. Starting parameters were
randomly assigned. Convergence criteria were carried to the ninth decimal and the
maximum rounds of iteration was at least two thousand. At least 5 cold restarts were
done for each analysis.
Results:
Repeatabilities of TTS, TAS, RIS, LAT, HAT, and NOT were 0.38, 0.21,
0.07, 0.08, 0.17, and 0.11, respectively. Dam and sire effects were significant for all
behavior traits (p < 0.01) and pen effects were significant for LAT, RIS, HAT, and NOT
(p < 0.01). Sex effects were significant for LAT, RIS, HAT, and NOT (p < 0.10) (Table
2). The chi-square test comparing the total number of attacks (RIS) in each trial yielded a
chi-square of 2.8408 with one degree of freedom resulting in a p-value of less than 0.10.
Based on the chi-square test RIS was not repeatable.
Based on multivariate linear modeling TTS and TAS were phenotypically
with RIS (r = -0.85). The HAT and NOT were also correlated (r = 0.34). All other
phenotypic correlations among behavior traits did not differ from zero (Table 3).
Total time struggling and TAS tended to be correlated with 21DW and ADGFH
(p < 0.05). Total attempts to struggle was also phenotypically correlated with BF (p <
0.05) (Table 3). Latency until attack was phenotypicly correlated with LMA (r = 0.22).
Resident intruder score tended to be correlated with ADG, W, and LMA (p < 0.10). No
other relationships between behavior traits and performance traits were found to be
statistically significant (Table 3).
Using MTDFREML genetic correlations among behavior and performance traits
were estimated (Table 4). The genetic correlation of TAS with both ADG and W was
0.38 (Table 4). Genetic correlations of TTS with BF, W, and TAS were 0.14, 0.18, and
0.81, respectively (Table 4). No other genetic correlations were different from zero.
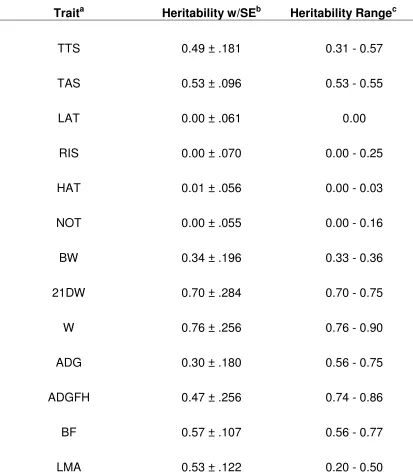
Heritabilities for TTS and TAS, when analyzed using a single trait model, were
0.49 and 0.54, respectively (Table 5). When using TTS and TAS in a two trait model the
heritability of TTS lowers to 0.31 but the TAS heritability remains the same as the single
trait estimate. All other behavior traits had heritability estimates of zero. Heritability
estimates were also calculated using each repetition of individual behavior tests as a
separate trait. The heritability of TTS for each repetition of the backtest was 0.38 and
0.40, respectively. All other analyses gave heritability estimates of zero. Heritabilities
of ADGFH, ADG, BW, 21DW, W, BF, and LMA were also estimated. These
Discussion:
A number of tests have been developed in order to quantify behavioral
characteristics in pigs in an attempt to better understand the nature of a pig and with the
thinking that improved production efficiency may increase in the process. The tests
chosen for this study were selected as indirect measures of different aspects of pig
behavior. These tests were chosen opposed to other tests because previous studies have
yielded estimates of a relationship between these tests and performance (Terlouw et al.,
2005; Van Erp-van der Kooij, 2003; Van Erp-van der Kooij et al., 2000). Past research
only involved one or two tests on a sample of pigs; however in this study multiple tests
were performed with multiple repetitions on a single group of pigs. In the past, efforts
have been made to establish accommodations for pigs that will allow for maximum
profitability. Some pigs seem to thrive in their environment while others do not, resulting
in the quest to better understand why pigs respond differently to a common environment.
One reason for this difference in response could be the genetic makeup of the pig. Some
pigs may have specific alleles that allow them to cope with their environment better than
other pigs.
Repeatability for the backtest was similar to previous work done; however, other
repeatabilities were lower than in previous work (Cassady, 2007; van Erp-van der Kooij
et al., 2000). A possible explanation for this is the breed of the pig. Perhaps some breeds
react differently to different situations than others. The HAT repeatability may also
depend heavily on the amount of regular exposure the pigs have to humans. Some
facilities’ personnel may interact more frequently with the pigs, skewing the results of a
unrepeatable. Due to the lack of repeatability in some of the traits, certain behavior traits
may be classified as situation specific because of their dependence on a combination of
previous experiences.
Phenotypic relationships of TTS and TAS with growth showed that the more
often and longer a pig struggles the slower the pig will grow. Total time struggling and
TAS have been associated with the resident-intruder test (Hessing et al., 1993; Ruis et al.,
2000); however, the present study does not support this relationship. The lack of any
relationship between the backtest and resident-intruder test suggest that the two test
measure different aspects of the pig. The backtest measuring the pigs ability to cope with
what may be perceived as a stressful situation and the resident-intruder measuring the
pig’s aggression towards unfamiliar pigs. Total time struggling has also been associated
with the HAT (Ruis et al., 2001b), but again the present study does not support this
association. The association between HAT and NOT supports previous findings by (van
Erp-van der Kooij et al., 2002). As one would think, the amount of time a pig takes to
approach something unfamiliar, whether it be a human or an unfamiliar object, is related.
The phenotypic relationship between LAT and RIS is misleading. There appears
to be a negative relationship between the total time taken until an attack occurs and the
total number of attacks; however, this relationship is likely a result of the testing process
itself. In the resident-intruder test if a pig did not attack it was given the maximum LAT
and scored a 0 for RIS. This means that a pig which did not attack was still given a time
taken until an attack occurred. The difference is it was just given a relatively higher time
were given a maximum time a relationship appears between LAT and RIS; however, the
reliability of this relationship is questionable.
As shown by the phenotypic correlation between the resident-intruder and weight,
there seems to be a relationship between aggressive a pig is and how quickly it grows.
The negative relationship between RIS and W, as well as with ADG shows that the pigs
which grew the slowest and weighed the least were also the pigs that attacked another pig
the most (Table 3). These pigs also exhibited smaller LMA. These relationships have
positive implications and greatly impact any well-being concerns producers may have. If
pigs that are more aggressive towards each other grow slower and have less LMA than
less aggressive pigs, there is no benefit to keeping them in a population. By culling these
animals from the population the overall production efficiency of the population increases
as well and by default so does the well-being of the population. With less aggressive pigs
in a population the risk of the pigs hurting each other is significantly reduced.
As suggested by Olsson (1999) and van Erp-van der Kooij et al. (2000), pig
behavior seems to be determined by a combination of genetic and environmental factors.
Phenotypic relationships between behavior traits and performance have been established,
but the contribution due to genetics or environment has not yet been determined (Janczak,
2003; Terlouw et al., 2005; van Erp-van der Kooij, 2003). Previous researchers have
suggested that some of the behavior traits are, in fact, heritable and may be genetically
correlated with certain performance traits (van Erp-van der Kooij et al., 2000). In the
current study four tests were evaluated in an effort to achieve an estimate of heritability
for those traits and estimate any genetic correlations that may exist (Table 4; Table 5).