Teaching and Learning of Conditional Probability. (Under the direction of Dr. Hollylynne S. Lee).
Statistics and probability has an abstract, uncertain nature. Where conclusions in mathematical problems are mostly certain, in probability it is only possible to have ‘probabilistic’ conclusions that approximate the theoretical probability in order to make decisions. Because of its uncertain nature there have been serious cognitive issues in teaching and learning of probability. Conditional probability is specifically difficult for students to learn and it is also difficult for teachers to teach. With the help of simulation tools where students can participate in the process of building probability models and collecting data generated from those models, there are great opportunities to improve teaching and learning of conditional probability. In this thesis, research-based misconceptions and suggestions for overcoming these misconceptions are discussed. Using research-based suggestions and previous frameworks, a new framework about creating conditional probability tasks (i.e. simulation tools) has been constructed for others to use. Two TinkerPlots tasks are presented as examples in which task content and problems are aligned with the framework.
by Kemal Akoglu
A thesis submitted to the Graduate Faculty of North Carolina State University
in partial fulfillment of the requirements for the degree of
Master of Science
Mathematics Education
Raleigh, North Carolina 2014
APPROVED BY:
_________________________ __________________________ Dr. Karen Hollebrands Dr. Molly Fenn
BIOGRAPHY
Kemal Akoglu was born and raised in Antakya, Turkey. He graduated from Ankara
University with a BS’ degree in Mathematics in 2008. Kemal taught mathematics for middle school and high school students until he moved to the U.S in 2009.
Kemal has been interested in sociology and literature since his high school years. On his meeting with the sociology professor, Dr. William M. Wentworth, Kemal enrolled in the Applied Sociology master’s program at Clemson University. After a successful year of coursework and graduate research assistantship (GRA) job in this program, Kemal took a leave of absence from the program and moved to Raleigh, North Carolina.
In Fall 2012, with the encouragement and support of his wife Tulay, he applied the master’s program in Mathematics Education at North Carolina State University (NCSU). During his master’s study, he worked as a GRA for Preparing to Teach Mathematics with Technology (PTMT) research project. He accomplished his coursework at this program in Spring 2014.
ACKNOWLEDGMENTS
I cannot express enough thanks to my advisor and committee chair, Dr. Hollylynne S. Lee for her continuing support, encouragement and patience. I feel one of the luckiest graduate students in the universe because of having her as my advisor.
I would like to thank my caring and loving wife, Tulay Ayyildiz Akoglu. This thesis could not have been accomplished without her support. She always trusted me more than I trusted myself, and she always encouraged me to continue.
TABLE OF CONTENTS
LIST OF TABLES ... vi
LIST OF FIGURES ... vii
CHAPTER 1. INTRODUCTION ...1
Purpose of Thesis ...7
CHAPTER 2. REVIEW OF LITERATURE ...9
Students’ Understandings of Conditional Probability ...9
Suggestions for overcoming the cognitive issues ...18
Reflection on research issues ...24
Design and Modeling of Conditional Probability Tools ...27
Modeling probability and simulation tools ...28
Reflection on research issues ...37
CHAPTER 3. DESIGNING A FRAMEWORK AND TASKS ...39
The Framework ...45
Phase 1: Pose a question ...48
Phase 2: Collect data ...49
Phase 3: Analyze data ...50
Phase 4: Interpret results ...52
Using TinkerPlots as a Modeling and Simulation Tool ...52
Illustrating the Framework with Two Tasks ...61
The origin of the story content ...62
Designing of the task and tool ...62
Task 2: Spinodice ...73
Spinodice game rules ...74
Designing of the task and tool ...75
CHAPTER 4. DISCUSSION AND FUTURE DIRECTIONS ...82
Statistics and Mathematics: Divided or Together? ... 82
Constructing the Framework: Strengths and Limitations ...83
Arguable Task Contents ...86
The Help of Computer Technologies ...88
The Future of the Research on Conditional Probability ...90
REFERENCES ...91
APPENDICES ...98
Appendix A. Lesson Plan for Task 1 ...99
LIST OF TABLES
Table 1. The Framework for Designing Conditional Probability Tasks with
LIST OF FIGURES
Figure 1: TinkerPlots description 1 ...54
Figure 2: TinkerPlots description 2 ...55
Figure 3: TinkerPlots description 3 ...56
Figure 4: TinkerPlots description 4 ...56
Figure 5: TinkerPlots description 5 ...57
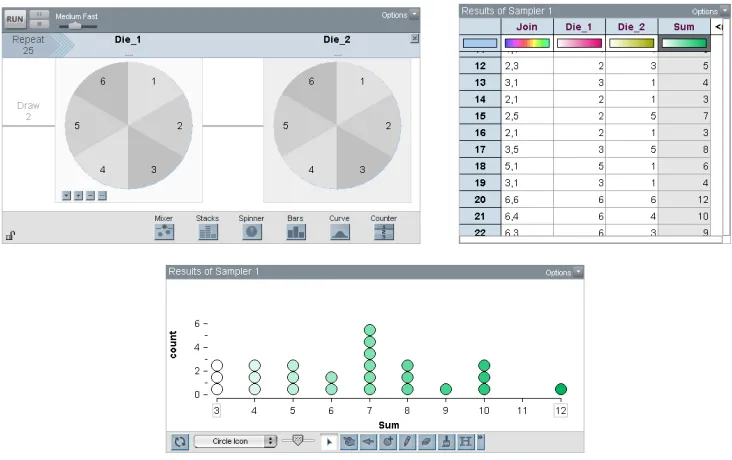
Figure 6: TinkerPlots Sampler 1 ...58
Figure 7: TinkerPlots Sampler 2 ...59
Figure 8: TinkerPlots Sampler 3 ...60
Figure 9: Urim & Thummim 1 ...63
Figure 10: Urim & Thummim 2 ...66
Figure 11: Urim & Thummim 3 ...67
Figure 12: Urim & Thummim 4 ...68
Figure 13: Urim & Thummim 5 ...69
Figure 14: Urim & Thummim 6 ...70
Figure 15: Urim & Thummim 7 ...70
Figure 16: Urim & Thummim 8 ...71
Figure 17: Spinodice 1 ...76
Figure 18: Spinodice 2 ...77
Figure 19: Spinodice 3 ...78
CHAPTER 1 INTRODUCTION
For several centuries, probability has been one of the most important components in many research areas, such as physics, chemistry, and biology, engineering, medicine, sociology, and economics. Not only in sciences, but also in our daily life, we see the importance of probability; deciding how the weather is going to be, what stocks are likely to be more profitable, the chance of getting a certain disease, etc.
Unlike the mathematics we used to know where we ‘mostly’ deal with concrete problems, statistics and probability has an abstract, uncertain nature. Where our conclusions in
mathematical problems are and have to be certain, in probability it is only possible to have ‘probabilistic’ conclusions that approximate some unknown theoretical probability in order to make decisions.
Scheaffer (2006) states the differences between statistical and mathematical reasoning. For example he points that statistical reasoning mostly includes a probabilistic thinking process where mathematics often requires deterministic thinking. He describes the
changes numbers into information” (p. 320). Although statistics is usually taught as a part of mathematics, math and stats use different ways of reasoning.
According to Britz et al. (1996) statistical thinking has its own principles: statistical work is a system of interconnected processes; variation exists in all processes; and understanding and reducing variation are keys to success in statistics. The author describes the relation between mathematics and statistics as a strong marriage. According to Scheaffer, as in marriage, statistics and mathematics “can come together not for the purpose of becoming one but so that the strengths of each can be validated, supported and enhanced” (p. 320).
Rossman, Chance and Medina (2006) also investigate the differences between statistical and mathematical reasoning science of gaining insight from data”. They state that even though statistics broadly use math, it is a separate discipline. “Statistics is the science of gaining insight from data” (p. 323). The authors point the role of context in statistics and the difference that r0ole creates between mathematics and statistics; according to them
mathematics can exist independently of context; on the other hand, context is crucial in statistics and one cannot ignore the context when analyzing data. Differently from
Another difference highlighted by Rossman et al. (2006) is a measurement issue. The authors state that measurement issues take a significant place in statistics. Even though measurement is also important in mathematics; however in mathematics “measurement includes getting students to learn about appropriate units to measure attributes of an object such as length, area, etc. In statistics, drawing conclusions from data depends crucially on taking valid measurements of the properties being studied” (p. 326).
The differences between mathematics and statistics could be a possible reason for the misconceptions about probability. At a certain time of their study, students confront with probability as a unit in mathematics in which they need to have / develop another way of reasoning. As it is an issue for students to learn this new reasoning it is also an issue for teachers to teach probability within mathematics curriculum (Stohl, 2005).
Even though the research about probabilistic theory arose and accumulated independently, especially in education, probability has been considered a part of statistics. Because of the essential relation between probability and data, this consideration is not surprising. However, probability has a specific characteristic puts it in a unique situation; there are several
cognitive issues about probability which are confronted by both teachers and students. Concepts in the study of probability are widely misunderstood by students and teachers (e.g., Tversky & Kahneman, 1972, 1974; Fischbein & Gazit, 1984; Steinbring, 1991; Stohl & Tarr, 2002; Shaugnessy, 2003; Batanero et al, 2005). Thus, students possess some
since the outcomes are 3H, 2H and 1T, 1H and 2T, and 3T.Outcomes are usually judged to be equally likely by the beginning probability student. Students feel that the probability of getting a head is greater on the 10th toss after a run of 9 tails.This misconception arises because people expect even short runs of coin flips to reflect the fairness of a coin (Shaughnessy, 1977).
As in probability in general, several cognitive issues in teaching and learning of conditional probability also emerge. Research shows that those cognitive issues are also resistant to the same teaching methods that have been used. A possible reason for that can be that teaching methods themselves are ineffective to overcome those issues. Since conditional probabilities play a central role in making inferences about the uncertain world, they are worthy to be studied. According to Falk (1986), the formal definition of conditional
probability is easy and has no issues. On the other hand, upon careful probing into students’ ideas of conditional probabilities, some misconceptions and fallacies are uncovered.
Without replacement conditions put a bracket between conditional probability and independence. Consider that we are given a problem where we have three white and three black marbles in an urn and we will draw two marbles in order. If the first drawn marble was put back in the urn, the first and second events are independent events, if the marble is held after the first draw; the second event now has a different sample space (only 5 marbles) and is thus conditional upon the first. Independence is a difficult idea that is better understood in relation to specific examples - classroom lessons often include discussions about conducting an experiment in class and whether two events (describing sets of possible outcomes of the experiment) are independent. Textbooks and teachers often use phrases such as event A and event B are independent events if knowledge about whether event A has occurred provides us with no knowledge about whether event B has occurred (Kelly & Zwiers, 1986).In a very subtle way an element of time is hinted at in such a statement and it often confuses students. It is therefore important to emphasize to students that whatever the temporal relationship between two (or more) independent events, a knowledge of the occurrence (or
nonoccurrence) of any of the events provides one with no knowledge of the future or past outcomes of any of the other events. By planning for instruction of these two fundamental concepts we can insure that students’ understanding is built up systematically. This provides a firmer foundation upon which students can acquire a grasp of probability theory (Kelly & Zwiers, 1986).
and there have since been technological and pedagogical developments in mathematics education, we are still far away from overcoming the cognitive issues which will be explained in Chapter 2. This lack of research on students’ reasoning in these two concepts (conditional probability and independence) is a matter of concern given the fact that these concepts are increasingly being identified as important ideas in probability instruction for the middle school. Reaburn (2013) states that understanding conditional probability is essential for students of inferential statistics as it is used in Null Hypothesis Tests. It is also used in Bayes’ theorem, in the interpretation of medical screening tests and in quality control procedures, which have been used by different areas.
As it will be discussed in Chapter 2, most of instructional methods that used physical experiments were not helpful to overcome the cognitive issues of conditional probability. Instead, research shows that cognitive issues are often increased by age and education (Fischbein & Schnarch, 1997). That shows us a significant problem about probability
education: either probabilistic misconceptions are resistant to age or there is a problem in our teaching methods. In any case, there has to be steps to be taken in order to overcome that. Differently from past, now we have advanced technological tools to help us in those issues as will be discussed further. There is almost universal agreement that technology should play a predominant role in probability and statistics education (Shaughnessy, 1992; Pfannkuch & Ziedins, 2014).
within the time constraints of school instruction. Furthermore, generating large data sets allows students to experience the misunderstood concepts such as ‘law of large numbers’, or ‘independence of events’ in a meaningful way (Drier, 2000).
Statistics benefits from technological tools for representing large data and making inferences. Besides data analysis, dynamic statistics software such as TinkerPlots (v. 2.0, Konold & Miller, 2011) includes the capability to model random phenomena, which gives us a golden chance to create simulations to use for probability problems.
Purpose of Thesis
The purpose of this paper is to twofold. First, I will synthesize the research about
cognitive issues in learning conditional probability and independence, and analyze research-based teaching suggestions to potentially overcome those issues. A particular focus will be examining the use of a modeling approach to teaching probability that takes advantage of computer simulation power. The second purpose is to provide a framework to guide the design of conditional probability tasks and two research-based designed simulation tasks that are hypothesized to assist learners in developing better understandings of conditional
probabilities.
CHAPTER 2
REVIEW OF LITERATURE
As stated in Chapter 1, the subject of this research is cognitive issues about conditional probability and the role of technology for overcoming these issues. Hence, Chapter 2 will be focused on the literature behind those topics. In the first part of this chapter, research about teaching and learning of conditional probability and research based methods used to teach conditional probability will be discussed. It will be pointed out that there are difficulties to both teach and learn conditional probability appropriately. Research based suggestions to overcome those problems will be presented and discussed. In the second part of this chapter the main point will be the research about design and modeling of effective tools to use in conditional probability lessons. The role of technology in the efforts of easing the difficulty about conditional probability will be highlighted, as well.
Cognitive Issues about Conditional Probability
Students’ understandings of conditional probability and independence
In their famous Science paper, which has been referenced numerous times, Tversky and Kahnemann (1974) categorize probabilistic misconceptions in three main heuristics, which they have called representativeness, availability, and adjustment & anchoring. Even though those heuristics are used to describe probability misconceptions in general, they are highly related to reasoning used with conditional probability and independence. The
Conditional probability and independence are two key constructs incorporated to describe and predict middle school students’ reasoning in probability. Based on their empirical study, Fischbein and Gazit (1984) identified two main misconceptions in students’ thinking in conditional probability:
1) Students do not realize that the sample space changes in a “without replacement” situation.
2) Students find the probability of an event in a without replacement situation by comparing the number of favorable outcomes for the event before and after the first trial rather than making comparisons with the total number of outcomes.
On the other hand, Konold et al. (1991) analyzed misconceptions about independence as either positive or negative recency effects. The Gambler’s Fallacy (Negative Recency Effect) is the tendency to believe that, after a run of tails, heads should be more likely to come up. The Positive Recency Effect is the tendency to believe that, after a run of tails, a tail is more likely to come up.
In some of the early work in conditional probability, Falk (1986) found three main issues about conditional probability. First, students interpret conditionality as causality. If students claim that conditioning the probability of an outcome of a draw on an event that occurs later is not permissible, they may be using causal reasoning. Second, the definition of the
conditioning event is often problematic. The probability of the target event should be
conditioned on the immediate event given as datum in the problem and not on some inferred event. The examples related to this insight highlight the vital role of the basic concept of the statistical experiment, the outcomes of which define our probability space. One way to promote gaining insights concerning such problems is to devise experimental models in order to explicate the exact procedure that has generated the data and then uncovers hidden
assumptions. For example, the 3 card problem which is used by several researchers; we have three cards in a hat, one is blue on both sides, one is green on both sides, and one is blue on one side and green on the other. We draw one card blindly and put it on the table as it comes out. It shows a blue face up. What is the probability that the hidden side is also blue?
In later studies that build from Falk’s early work, students’ tendency to confuse the inverse is often referred to as the ‘time axis fallacy’ or ‘Falk paradox’, which will be discussed further in the paper.
The cognitive issues about conditional probability and independence are not in the field of mathematics education only. There is also a concern in psychology and cognitive sciences about conditionals and conditional probability. Oaksford and Chater (2003) state that in the psychology of reasoning, the two main theoretical approaches, mental logic and mental models; the conditional is treated as truth-functional. Experimental work has concentrated on the indicative or straight conditional. For example, if Oswald didn’t shoot Kennedy, then someone else did, or, if you turn the key the car starts. According to the authors, in the philosophy of language and logic, the majority view is that straight conditionals are a matter of subjective conditional probabilities. An important consequence of this view is that people, ‘do not use ‘‘if’’ to express propositions, evaluable in terms of truth. And if conditionals do not have truth conditions, then they would not appear to be truth functional, as many
psychological theories assume. Thus, the main component of conditional probability has been ignored in the real world, which may be a reason for many of the misconceptions analyzed in this paper.
antecedent holds and the consequent does not, then they infer an equiprobable prediction. If they consider all the alternative prior possibilities, but assume that the conditional holds only when the antecedent and consequent hold, then they infer a conjunctive estimate.
One of the most famous conditional problems in psychology, used with college students, is found in Tversky and Kahneman (1974), the taxicab problem. In this problem, a cab was involved in a hit-and-run accident at night. Two cab companies, the Green and the Blue, operate in the city. You are given the following data:
(i) 85% of the cabs in the city are Green and 15% are Blue. (ii) A witness identified the cab as a Blue cab.
The court tested the witness’ ability to identify cabs under the appropriate visibility conditions. When presented with a sample of cabs (half of which were Blue and half of which were Green) the witness made correct identifications in 80% of the cases and incorrect identifications in 20% of cases. Then the question follows as: What is the probability that the cab involved in the accident was Blue rather than Green?
Used by psychologists over the years with college students, the taxicab problem is notoriously difficult and reveals many misconceptions in the interpretation of language and information presented. The main misconception displayed by students attempting to solve this problem is called a base-rate fallacy. This misconception occurs when the indicant or diagnostic data (i.e. eyewitness account) overshadows the base-rate information (i.e.
is, base-rate data with causal interpretation influence judgments, whereas the other base-rates are dominated by other causally relevant data.
A possible reason triggering the cognitive issues about conditional probability may be the wording we use in process of teaching and assessing the topic. Some problems seem to be caused by formal wording or algebraic notation, although there is a surprising amount of difficulty even when the conditional probability is expressed in terms of simple percentages (Pollatsek et al., 1987). Research shows that those cognitive difficulties occur even with intelligent and highly educated people such as physicians, engineers, etc. An example of wording causing a misconception is: The probability of A given B could be confused with the probability of B given A, the joint probability of A and B, or even the joint frequency of A and B. In fact, one can find similar examples in daily experiences.
1. Which of the two events is more probable?
(a) That a girl has blue eyes if her mother has blue eyes (b) That a mother has blue eyes if her daughter has blue eyes (c) The two events are equally probable
2. In which prediction would you have the greatest confidence? (a) Predicting that a person who has a fever is sick
(b) Predicting that a person who is sick has a fever (c) Equal confidence in both predictions (p. 258)
It is documented by Watson and Kelly (2007) that the two main confusions for these types of problems above might be: contextual knowledge that implies a causal relationship for the events, and the syntax involved in answering the question. Kelly and Zwiers (1986) provided instructor suggestions that can be used to equip students with an intuitive, comprehensive understanding of the basic concepts ‘independence’ and ‘mutually exclusive’.
determining when events in the real world are independent or dependent. Once again, we rarely help students to bridge the gap between the fuzzy distinctions (natural) and the rigid distinctions, which are made in mathematics.
However, I think that the term ‘negligible’ is somewhat dangerous for classroom uses. Since we already deal with a world of uncertainties where we have to transform all our mathematical knowledge into an abstract, non-deterministic field, it does not seem right to me to convince students that something is “negligible”. This makes conditional probability and independence much more difficult to reason.
One of the most difficult misconceptions about conditional probability and independence is the time axis fallacy. Reaburn (2013), in an empirical study about students’
misconceptions while entering university, uses ‘the urn problem’, which was originally described by R. Falk (1986), and also used by Fischbein and Schnarch (1997). In the problem, an urn was described that contained two white and two black balls. The first question asked for the probability of taking a white ball from the urn given that one white ball had already been removed. The second question then asked for the probability that the first ball was white, given that it is known that the second ball was white. The most common reasoning used in the second question was that the second ball could not affect the outcome of the first ball; therefore the probability was one half. This is a result of misplaced causal reasoning, and it is called time axis fallacy (or Falk’s Paradox).
Suggestions for overcoming cognitive issues with conditional probability and independence
extracting marbles, rolling dice, counting outcomes in defined situations. The relation between a priori calculated probabilities and empirically obtained frequencies was
particularly emphasized in the article. From their study, the implication for teaching was that the implementation of a systematic program on probability might be carried out without particular difficulties, possibly starting from grade six and certainly starting from grade seven. Some intuitive obstacles have been identified but we assume that an improved version of the teaching program may overcome the respective difficulties. One may suppose that a course on probability (including practical activities) might have a positive beneficial effect on the children's prejudices and misconceptions with regard to sequences of events in uncertain situations. According to the authors, an important didactical problem arises: It seems that, with respect to proportional reasoning, the lessons had a rather negative effect.It may seem a surprising finding for a new reader of the subject; nevertheless, it is not the only example for seeing a negative effect despite time and education.
Fischbein and Schnarch (1997) find in their comprehensive empirical study that most of the misconceptions known about probability are either stable or increasing by age and education. Fischbein & Gazit (1984) think that the difficulty could be overcome if special care is devoted to this problem. They suggest that special exercises have to be devised in which students will be confronted with proportional computations and the respective implications for probability estimations.
students to reflect on the validity of their intuitions, and providing teachers’ access to student thinking.Engaging students in carefully designed tasks allows the teacher to formally and informally assess student thinking and inform instructional decision-making. Tasks should be set in contexts that are familiar to students (middle school level students in their study) and promote small group and whole-class discussions. The authors state that instruction that is informed by research-based knowledge of students’ thinking in conditional probability and independence can foster a coordinated understanding of both concepts. Therefore, it is vital for a researcher who is interested in this topic to be connected to the research in cognitive psychology. The authors state that a primary objective of instruction must be developing the idea that the sample space changes in without-replacement situations.Additionally,
according to the authors, an instructional program must help students to consider the
composition of the sample space in relation to the total number of outcomes; that is, although the number of elements of a target color may remain the same after sampling
without-replacement, it is critical to consider how the entire sample space has been modified by the conditioning event. They conclude that the educational environment can lead to deeper understanding of key ideas by encouraging discussion and reflection among students regarding possible misconceptions. Similarly, other researchers, according to the article, document the importance of providing students with opportunities to collaborate on
Castro (1998) compared the impact of two different instructional orientations: 1) an environment that focused on eliciting student thinking and encouraging reflection on probabilistic ideas (referred to “conceptual change”), and 2) traditional instruction that centered on a clear, linear presentation of mathematical ideas without considering student conceptions and misconceptions. Castro found that misconceptions in conditional probability and independence were more resilient among those receiving “traditional instruction” than in classes that focused on “conceptual change”. For example, students experiencing “traditional instruction” were more likely to retain representativeness strategies than students
experiencing instruction that confronted misconceptions.
Falk (1986) suggests that one way to reduce the risk of confusion would be to dispense with such short-cut terms, which are unconditionally worded. Instead, we should strictly adhere to the symbolic language of conditional probabilities. Another didactic device is to present the problem’s data in a two-dimensional frequency table, so that the two orthogonal directions for the computation of the two inverse conditional probabilities will be
conspicuous.
of surface learning, where the content of a text maybe just reproduced, and deep learning, where the student can relate parts of the material to the whole integrate it with existing knowledge and apply it in real world situations.”
There are task and teaching program characteristics suggested by research, according to one of the most recent studies on the cognitive issues about conditional probability (Huerta, 2014). Nevertheless, there is very little information about conditional probability problems and we do not know what problems students have to solve, what characteristics problems possess that might have an influence on students’ behavior and which make them so difficult to solve. Moreover, we have not yet considered in which direction, teaching models should be addressed so that they could help students to become competent and probabilistically literate in the actual uses of the probability. And it is known that, according to Huerta, research on probability problem solving should involve three elements, individually and in relation to each other: problems, students solving these problems, and teachers teaching students to solve them. The author describes the conditional probability problems she uses in her empirical study as this: “A probability problem is a conditional probability problem if in its formulation at least one of the quantities explicitly mentioned in the problem could be interpreted as a conditional probability” (p.614).
Continuing on Huerta’s article, it is stated that no previous research has been conducted in the field of conditional probability problem solving, despite Shaughnessy’s (1992)
researchers to carry out research in problem solving. Researchers may help teachers in their task of improving students’ competences in solving problems of conditional probability. Thus, Huerta and her colleagues have conducted some research on conditional probability problem solving. That was carried out in order to obtain knowledge about conditional probability problems, identifying a particular family of problems -ternary problems of conditional probability- as a model for many school tasks on conditional probability. Cerdán and Huerta (1997) modeled this family of problems by means of what they called trinomial graph of the world of ternary problems of conditional probability. A ternary problem of conditional probability is a conditional probability problem formulated with three known quantities and one unknown quantity, to be solved for, and verifying that all probabilities in the problem are connected by ternary relationships, that is to say, additive or multiplicative relationships between the three quantities (Huerta, 2009).
According to Huerta (2009), however, because problem solving is a process, the
difficulties of the problems can arise anywhere during this process. In particular, the author states that they have found difficulties when the process starts with the reading and
Even though they are very important questions, there are no wide agreements among the researchers about when to start teaching conditional probability, and how to start introducing the subject in order to prevent the misconceptions. However, I will try to discuss some main problems I found in the methods used so far, and they may be helpful in answering those questions.
Reflection on research issues
First of all, unlike the references where it was suggested to consider the misconceptions about conditional probability and independence together, I think that independence is easier to understand for students than conditional probability. The misconceptions about
independent events, such as negative and positive recency effects (i.e. the gambler’s fallacy, and the hot hand belief) may be easily fixable. Either in-class experiments or computer simulations can be used to convince students that having independent events, the probability of a proceeding experiment will not be affected by previous results. Because students are able to observe that the sample space remains stable, and the experiments are still random. On the other hand, solving the misconception about conditional probability might be quite harder.
misconception. In my opinion, it is basically misleading to ask that question. It does not seem reasonable to force students for considering a future event as ‘given’. If we do, it is not surprising that we have unstoppable misconceptions about the urn problem. Hence, the source of misconceptions about conditional probability seems deeper. It is probably worth to question the problems we typically pose to students first and try to find more reasonable problems.
Another problem I found in empirical studies I reviewed was that analyzing a lower age student could be wrong. Even though it seems reasonable to teach the subject in lower grades as Watson and Kelly (2007) stated: “Rather than continuing to push complex topics to higher levels in the education system, perhaps they can be approached more directly at lower levels” (p. 233) .
In Tarr and Jones (1997), the authors ask a 5th grade student, Alicia, to guess the color she thinks that is more likely to appear in a spinner experiment. Her answer for the next color of spinner’s turn was blue, and Alicia says that she answered blue because it was ‘her
reasoning. As far as I read the literature, I found that the problem with conditional probability studies could become non-effective, and even harmful in such cases.
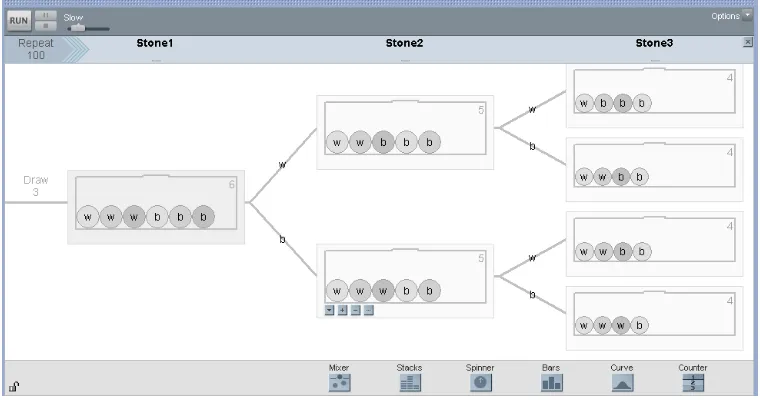
Besides the issues in the methods researchers used, it is obvious that the subject itself contains basic cognitive problems. It should also be addressed in this paper that recent developments in technological tools could make a great contribution for the future empirical studies in the field. For example, dynamic statistical software TinkerPlots has a built-in feature called the Sampler in which one can create conditionally probability models and collect large data samples.
Design and Modeling of Conditional Probability Tools
NCTM (2000) declared that “Technology is essential in teaching and learning
mathematics; it influences what is taught and enhances students’ learning” (p. 24). According to Lee and Hollebrands (2006), designing technology tools can dramatically affect the
students’ interaction with tools and those interactions may effect students’ mathematical problem solving. Research shows that the development of statistical software helped us to take big steps in probability education. There have been numerous empirical studies about the cognitive issues in probability and the role of technology to overcome those. For example, graphing calculators and pseudo-random number generators are well used in probability classes for students to understand better the concepts of randomness and chance. The statistical software also helped educators and students to have large sample sizes that had been a serious problem when we teach probability. On the other hand, there is little research about the suggestions to overcome specifically the cognitive obstacles about conditional probability.
understand probabilistic concepts with small sample sizes. On the other hand, it is not only students who needs to be considered while creating those technology tools; as Batanero et al (2005) stated, most of the educators have little experience with probability and share with the students various probabilistic misconceptions. Again, the lack of affordance of the
technology in schools plays a part here. It seems that besides research, there has to be politic pressure to make the educational technologies reachable.
Before synthesizing the research on probability models and simulations, we need to point out the pedagogy needs to be considered here. As Stohl and Tarr (2002) based their work on the theoretical ideas that learning is a constructive process of resolving perturbations through reflection on actions and effects of actions that allows for abstraction. This process is
coordinated with the social context in which meanings are negotiated through interactions with other cognizing individuals. This section of the literature review will discuss the main characteristics of designing tasks, modeling approach, embodied-design approach and semiotic approach of probability tasks.
Modeling probability and simulation tools
According to Lee and Lee (2009), students can model probabilistic situations based on their assumptions about a theoretical distribution, they can also simulate experiments to generate large amounts of data, and use the data in different ways that would be very difficult to do within the time constraints of school curriculum and instruction.
authors students need opportunities to re-invent some artifacts (see, touch, etc.). Only thus, according to the authors, can students appropriate these objects as thinking tools; only thus, do students develop trust in their personal mathematical agency; only thus, do students develop critical numeracy. The authors propose four key design-research constructs, which are as below:
1- Conceptual composite (mathematical concepts can be taught as sign systems, such as symbols or diagrams),
2- Learning axis (expresses an analysis of a mathematical representation to create learning tools)
3- Bridging tool (backgrounds the similarity of the idea elements, thus reminding their difference.)
4- Learning issue (that is the design challenge on understanding the concept)
The educators’ challenge is to determine the conception of probability that should be promoted in teaching and learning. According to several studies, the best direction in which to steer probability learning seems to be towards a modeling approach (Chaput et al., 2011). Before comparing different approaches on modeling, it may be more plausible to discuss the nature of thinking about probability and models. According to Pfannkuch and Ziedins (2014), there are three interconnected ways of thinking about probability: true probability, model probability, and empirical probability. And, we could define three ways for attention to notions of a model: good model, poor model, and no model. And also, there are two interpretations of probability models: the first one is the theoretical notion of a
mathematically-computed probability distribution called the classical approach; and the second one is the empirical notion of a stabilized probability distribution when some random experiment is repeated many times under the same conditions, called the frequentist
approach. Batanero states that (2005), interpreting random situations in terms of probabilistic models will serve to overcome the controversy between classical, subjective and frequentist approaches.
How does the modeling process work? According to Chaput (2011), there are three stages in the modeling process, and those are:
1- Pseudo-concrete model (putting empirical observations into a working model) 2- Mathematization and formalization (translating working hypotheses into model
3- Validation and interpretation in context (checking fit of a probability model to data).
It is essential for students to know why they are modeling the probability. Providing only numerical representations of real world examples make students unaware of the unique nature of probability which is full of uncertainties, differently from certain nature of mathematics in general.
In a recent paper, Pfannkuch and Ziedins (2014) state that a model is generally built for answering particular questions about a system and sometimes it could be only for
understanding the behavior of that system better. According to Pfannkuch and Ziedins, a model becomes a “virtual world” where the experiments could be conducted to reflect the real world. Several researchers (Abrahamson & Wilensky, 2007; Konold & Kazak, 2008; Pfannkuch & Ziedins, 2014) highlight the importance of “model fit” as a main design construct. Model fit means the model fits to the purpose of the problem. Model probabilities are the estimates of true probabilities and they arise from modeling that we hope captures the essential behaviors of the process. Model probabilities need to satisfy certain consistency conditions to be useful for probabilists.
We could separate probability-modeling approaches in two categories: Theory-driven and data-driven. There are very strong links between the data-driven and theory-driven
reference to such a motivation since the mathematical models are of interest in their own right.
Konold et al. (2011) suggest that students exposed entirely to probability situations that could be ascertained theoretically and empirically, such as the sum of two dice, coin tossing, and number of boys in a four-child family, could develop an impoverished view of
probability. Hence they believe that students should experience problems for which there is no theoretical probability model or the presumed theoretical model is inadequate.
According to Pfannkuch and Ziedins (2014), teaching and learning probability from a modeling perspective is only now possible because the technology and tools are available. Also the technology we have on everyday life has opened up our minds to the possibility of operating in virtual worlds. Hence the time is ripe to consider new ways of teaching
probability. Tertiary courses try to move students to a world where they work with ever richer and more complex models and move between real and virtual world systems. School students are already experiencing some of the elements of theory-driven and data-driven approaches. If they are to experience modeling, they may need to start by exploring the notion of a model as an approximation to reality, which may be fit for some purposes, but not others, and which can be improved if necessary. Teaching from a modeling perspective, moreover, would better resemble the practice of applied probabilists and should help students build a more integrated view of probability and a probabilistic way of thinking.
approach’, which was suggested by Bakker and Hoffmann (2005). According to Abrahamson (2009), a semiotic approach appears to be a good option for the practice of design-based research. “The objects that formulate, store, convey, and mirror student expression is closely aligned with design-based researchers’ analytical and pragmatic objectives, to better theorize the roles of mathematical objects in creating opportunities for mediated content learning and, to delineate principles for effective design” (p. 29).The approach Abrahamson proposes to use for the analysis of student interaction with new materials and it is an intellectual foundation for a principled design framework. In this approach, students perform semiotic acts with available media. Hence, they construct new meanings by those tools.
Prodromou and Pratt (2006) discuss two perspectives on distribution in a simulation: The modeling and data-centric perspectives. The modeling perspective pays attention to
state that it may be possible to build an environment that allows the students to use their reasoning about causality at the same time begin to recognize its limitations in explaining local variation, and to use the parameters as causal agents. Prodromou and Pratt’s
pedagogical perspective is that pedagogy somehow enables students to appreciate the connection between the data-centric and modeling perspectives on distribution. In her later study, Prodromou (2012) states that the development of such pedagogy requires a research on designing tools that aim to facilitate the co-ordination of those two perspectives. The
development of such pedagogy, according to Prodromou, demands appropriate pedagogical designs that facilitate the coordination of experimental probability with theoretical
probability.
Abrahamson and Wilensky (2007) have considered the problem of coordinating two or more epistemologies in order to design activities that bring into close proximity the theoretical and empirical probability as elements of a conceptual composite. This allowed students to see both perspectives, thus encouraging connections to be made between them. Their approach to bridging tools inspired Prodromou to design a bridging tool, the Basketball Simulation (Prodromou & Pratt, 2006) and examine how students coordinated the two
In my opinion, the combination of modeling and data-centric perspectives creates another problematic situation. What I understand from modeling perspective is to let students
construct their own model by using a simulation tool. On the other hand, data-centric perspective intends students to focus on the shape of pre-collected data. However, I believe that, it is possible to let students have their own data, as well. Saying so, I mean the students could collect their own data and create their own model at the same time. According to Lee and Mojica (2008), teacher education efforts need to include experiences with authentic statistical inquiry, which includes the use of simulation tools, and modeling pedagogical practices that are useful to examine and discuss the data collected during the investigation. Thus, one of the questions I will try to answer in chapter 3 will be that is it possible to create such tasks where students will be able to collect their own data, create their own model by using the tool when the task will provide a chance to meet all key design constructs? In statistics education, it is important to both model the use of technology as a problem solving tool and to take advantage of the ability to automate calculations and graphics, facilitate explorations of statistical concepts by using dynamic, interactive, visual
practices to promote such relations. On the other hand, besides the main characteristics about statistical investigations, in the process of modeling probability tasks, Konold and Kazak (2008) suggest four characteristics in order to target four central ideas about probability that are model fit, distribution, signal & noise and law of large numbers. The authors see those four ideas as fundamental components of probability models and they list the characteristics of modeling as follows:
- Making and testing Initial Predictions: That is to motivate for exploration prepares to observe specifically serves to establish the purpose of understanding the activity. - Testing Predictions with simulated data: Students’ view the computer models they
build and run them.
- Using the sample space to explain distribution shape: It helps to explain the data students have previously collected either from the real situation and/or from the computer simulation.
- Seeing Signal & Noise in Empirical distribution: To see, when chance is involved, you do not get the same thing every time. It also helps them to see in data a noisy version of their expectation.
The method used by Konold and Kazak (2008) leads students to question their initial ideas and motivates the need to develop an alternative theory. This misfit likely helps
concepts signal-noise, sample space, LOLN (Law of Large Numbers) are not only conceptions; they are perceptions as well. Thus, the efforts for creating better education environments for probability subjects need a comprehensive psychology research, too. Indeed, it is misleading to consider conception and perception as two separate, cognitive processes, as they are highly interrelated.
According to Konold et al. (2007), teaching probability using a modeling approach has several advantages.Through modeling, students encounter and use probability in virtually the same way as practitioners do, with the purpose of better understanding some real
phenomenon.Where people have strong prior conceptions, this encounter has been shown to be a very powerful technique in fostering conceptual change in domain (Drier, 2000; Konold, 1994; Pratt, 2000). Unlike the majority of probability problems students encounter,
simulations generally focus on what happens in large samples, a perspective that is critical for forming or eliciting normative expectations about probabilities.
Reflection on research issues
conditional probability. The fundamental problems such as sample size, repeating several experiments and re-collecting those experiments in order to make the content more plausible are mostly fixed by the use of computer simulations. Nevertheless, I think that we have a problem in affordance of those tools. Even in the U.S. the actual classrooms are mostly not able to afford those technological tools. As it will further discussed in Chapter 4, there should be efforts to solve that problem.
CHAPTER 3
DESIGNING A FRAMEWORK AND TASKS
Considering information discussed in the previous chapter, I will further synthesize the literature to suggest several common characteristics for task questions and design principles. I will introduce simulations to help teachers and students for overcoming cognitive issues about conditional probability. The purpose of this chapter is to present a framework for those who want to design and use simulation tasks about conditional probability. The framework will then be illustrated with two simulation tasks.
The question being answered in this chapter is: How can the important characteristics of a task for learning conditional probability with simulation tools be synthesized into a
framework to guide task creation?
Actually, that is a difficult question, because the empirical studies on designing
appropriate tasks or models for overcoming the cognitive issues about conditional probability by using computer simulations are relatively recent. Because the short history of dynamic programs on probability simulations. However, we can set up a list of criteria based on the literature we have for answering this question. There is no doubt that more empirical studies will need to investigate the problem in the future.
based on data. Those principles (phases) are: posing a question, collecting data, analyzing data and interpreting results. While designing a task to investigate particularly the cognitive issues about conditional probability, one has to make sure that he or she follows those
phases, too. In order to create useful tasks and models for overcoming the cognitive issues about conditional probability, it is also important to consider the following questions to help define and narrow the focus of my framework:
- What are the important concepts in conditional probability to be included in the process of designing a model and creating a task?
- What is the target student level of a task that the framework can be used with? - How will the students get informed about the tool(s) used in a task?
- Is it necessary to use hands-on activities first to investigate the task questions? - How important is it for students to explain how the models represent the situation?
- How can the simulation motivate the purpose of the task that is overcoming the main misconceptions about conditional probability?
For the specific content focus of the framework, the difference between conditional
example one of the most common tasks in the research on conditional probability is the urn problem (Falk, 1986; Reaburn, 2013). In that problem using the situation where we continue to conduct an experiment without replacement, the students are expected to realize the
sample space changes (Fischbein & Gazit, 1984), and that is the situation where students face the cognitive issues first. Repeatedly investigating the independent situations could be
confusing. Hence, it is essentially important to include without replacement conditions in a good conditional probability task.
The target level of students for those tasks is an important problem. According to Watson and Kelly (2007), directly approaching the complex problem of conditional probability in lower ages may be a better decision. Even though there should be an introduction to the subject in younger ages, it is better to conduct simulation based conditional probability tasks to high school students. Because Fischbein and Schnarch (1997) showed that the evolution of probabilistic concepts by age and education is dramatically deteriorated. Thus, students need to be open to use complex tools when they try to solve complex problems. Starting to teach a problematic subject early could be a reason of keeping the subject problematic in later years. Further research should be needed for discussing this, though. Hence, the
problems before they actually begin the modeling process could be an essential part of the task.
As Lee and Hollebrands (2006) stated, design of technology tools can dramatically affect the students’ interaction with the tools and those interactions may affect students’
mathematical problem solving. It is also important to show the effectiveness of the
technology to students. By allowing them the chance of comparing using hands-on activities and computer-based simulations, students may see the difference simulations create. Hence in the framework I suggest, there has to be a room for hands-on activity before using computer simulations. Therefore student may realize how hands-on activities limit the sample size compare to computer-based activities (Chance & Rossman, 2008). However, the hands-on simulation can assist students in developing and understanding a model for a situation and potentially better understanding of the instantiation of that model in a computer environment.
Questions in a good conditional probability task have to be carefully chosen to examine how well a model fits to real scenarios (Pfannkuch & Ziedins, 2014). Students have to be convinced about the model fit. It could be done by giving examples from real world situations or using hands-on activities.
solving by subtracting the current sample size by one element. By doing this, the concept of causality, which is an essential actor in the study of conditional probability, could make more sense for students (Prodromou & Pratt, 2006). Moreover, one needs to make sure it is clear for students that the simulation tool is a good representation for conditional probability task. Since the real scenarios contain conditional probability take place dynamically instead of static
situations. Students can notice that the simulations are a good representation for those situations where they can spontaneously see the simulation as it runs. The virtual benefits of a computer simulation has to be well emphasized (Konold et al., 2007)
Questions in the task have to be well constructed to overcome main cognitive problems about conditional probability. The main issues such as representativeness heuristic (Tversky & Kahnemann, 1974), time-axis fallacy (Falk, 1986; Fischbein & Schnarch, 1997),
misconceptions of availability (Tversky & Kahnemann, 1972, 1974; Falk, 1986; Huerta, 2009) have to be addressed, since those misconceptions have not been solved without advanced technology for decades.
because of students’ incompetence, but the subject is already problematic (Abrahamson, 2009).
After posing the questions, it is essential to make students to state their assumptions about the situation (Lee & Lee, 2009) based on the problems. Therefore, introducing the tool elaborately first and showing them a pre-built model for a relatively similar problem would be beneficial. That way, students will be able to witness how important is the modeling and how a model could represent a problem. Also, it could be a good way to let students know how important is explaining how a model represents a problematic situation (Konold & Kazak, 2008). As students watch teachers’ modeling process and solving the problem with that model, they can get a sense of the effectiveness of explaining such representation in order to solve a problem.
considering it as a bridging tool (Abrahamson & Wilensky, 2007) as in the example of Basketball Simulation used by Prodromou and Pratt (2006).
The Framework
Summing up the elements of a good conditional probability task, the criteria presented here will be grouped into two categories; the first category is focused on task questions, and the second one is about the simulations to be used (Konold & Kazak, 2008). The framework is also organized as to what should be considered in task design during each of the four phases of a statistical investigation.
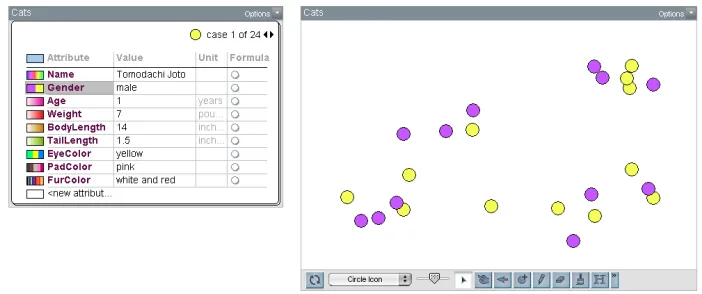
Table 1. Framework for Designing Conditional Probability Tasks with Simulation Tools Phase of Statistical Investigation Task Question Characteristics Simulation Tool Characteristics
Pose a Question
PQ-TQ-1: The questions need to address the main misconceptions about conditional probability, such as representativeness problem, time axis fallacy, positive and negative recency effects, and availability heuristic. (Tversky & Kahnemann, 1974; Falk, 1986; Shaugnessy, 1992; Fischbein & Schnarch, 1997; Huerta, 2009)
PQ-TQ-2: Students should be given the opportunity to make their
assumptions and predictions about the problem. (Girotto & Laird, 2004; Konold & Kazak, 2008; Lee & Lee, 2009)
PQ-TQ-3: The questions should motivate students to be able to ask their own questions based on the simulation, and need to get attention of students.(Abrahamson &
Wilensky, 2007; Abrahamson, 2009; Konold et al, 2011)
PQ-ST-1: Task scenarios should be posed that includes the use physical objects familiar to students as well as those that include unfamiliar contexts that require a modeling process.
(Abrahamson, 2009; Konold et al, 2011; Pfannkuch & Ziedins, 2014)
PQ-ST-2: Some questions need to represent situations where there is no possible model students can build with tools. (Falk, 1986;
Abrahamson, 2009; Konold et al, 2011)
Collect Data
CD-TQ-1: Students should have the opportunity to collect their own data. Thus, the questions need to be well explained and could be
represented by real world scenarios. For example, task questions should suggest how to collect data and sample size. (Konold & Kazak, 2008; Pfannkuch & Ziedins, 2014)
CD-ST-1: Students should have the opportunity of conducting hands-on activities before they use a
technological tool and students should be able to collect the data by using the tool. (Lee & Hollebrands, 2006; Chance & Rossman, 2008; Konold & Kazak, 2008).
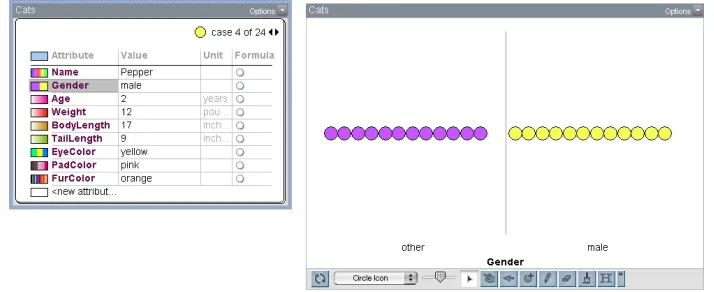
Table 1. Continued Analyze Data
AD-TQ-1: The questions should lead the students to discover how to analyze the data by informing them about each step through analysis. (Lee & Mojica, 2008; Abrahamson, 2009; Pfannkuch & Ziedins, 2014)
AD-TQ-2: The students have to be given the chance of
constructing new meanings, posing new questions and so, creating their own models. (Abrahamson & Wilensky, 2007; Abrahamson, 2009; Prodromou, 2012).
AD-ST-1: The simulation has to provide the opportunity for analyzing results. Students should be able to use tables and graphs. (Chance & Rossman, 2006; Lee & Hollebrands, 2006; Konold & Kazak, 2008)
AD-ST-2: The simulation needs to give the opportunity of creating bridging tools between theoretical and empirical probability, which stimulate the learner to construct a viable reconciliation of competing perceptions. (Abrahamson & Wilensky, 2007; Abrahamson, 2009; Pfannkuch & Ziedins, 2014).
Interpret Results
IR-TQ-1: The questions need to be open for interpretations and facilitate students making connections back to the context of the problem. (Batanero, 2005).
IR-ST-1: The tool affords multiple ways of summarizing data from simulations that can lead to multiple interpretations of results. (Batanero, 2005; Abrahamson, 2009; Pfannkuch & Ziedins, 2014)
The following part is a brief elaboration of each of the elements in the framework from Table A. Each characteristic is presented along with a rationale.
Phase 1: Pose a question
PQ-TQ-1: The questions need to address the main misconceptions about conditional
probability, such as representativeness problem, time axis fallacy, positive and negative recency effects, and availability heuristic. (Tversky & Kahnemann, 1974; Falk, 1986; Shaugnessy, 1992; Fischbein & Schnarch, 1997; Huerta, 2009)
In order to target the misconceptions of students about conditional probability, it is
necessary to pose questions that are constructed specifically to address those misconceptions. For example, instead of asking one single event’s probability, for aiming the misconception of negative recency effect, a question could be posed by giving a certain amount of outcomes of independent events and asking the proceeding event’s probability in the same model.
PQ-TQ-2: Students should be given the opportunity to make their assumptions and
predictions about the problem. (Girotto & Laird, 2004; Konold & Kazak, 2008; Lee & Lee, 2009)
In statistics and probability, we deal with an uncertain nature. Instead of having certain answers, we find the best predictions. Asking students their initial assumptions before they solve the problem would be helpful to show this fact.
PQ-TQ-3: The questions should motivate students to be able to ask their own questions
based on the simulation, and should get their attention to the problem. (Abrahamson & Wilensky, 2007; Abrahamson, 2009; Konold et al, 2011)
simulation tool flexible to play around, thus students would be able to discover the model on their own. And that could give an opportunity for easing the cognitive obstacles, which may come from the hard concreteness of mathematical problems.
PQ-ST-1: Task scenarios should be posed that include the use of physical objects familiar to
students as well as those that include unfamiliar contexts that require a modeling process. (Abrahamson, 2009; Konold et al, 2011; Pfannkuch & Ziedins, 2014)
Students may not feel comfortable with imagining the possible situations based on the model. Thus, it would be helpful for them to have scenarios given based on the task content before they begin work on their own. Those scenarios should have familiar and unfamiliar contexts that both require a modeling process.
PQ-ST-2: Some questions need to represent situations where there is no possible model they
can build. (Falk, 1986; Abrahamson, 2009; Konold et al, 2011)
Models are not the ultimate cure for the cognitive problems; they cannot answer all possible questions that can be asked. Sometimes it is just impossible to model a problematic situation. For example, since time does not go backward, a question investigating time axis fallacy (Falk paradox) cannot be answered by modeling. Telling students that a future event is given and they are expected to find a previous event’s probability may not be modeled.
Phase 2: Collect data
CD-TQ-1: Students should have the opportunity to collect their own data. Thus, the
Apart from the rest of mathematics, in statistical and probabilistic investigations, it is important to state that students deal with data, which mostly represents the real world. That can be overcome by having students collect their own data.
CD-ST-1: Students should have the opportunity of conducting hands-on activities before they
use a technological tool and students should be able to collect the data by using the tool. (Lee & Hollebrands, 2006; Chance & Rossman, 2008; Konold & Kazak, 2008).
It is important for students to know that simulations are not available in technological zone, but there is chance to have real world simulations as hands-on activities. However, it is also important to show how the data collection differs between two simulation methods. (i.e., in technological simulation tools, we are able to have large samples)
CD-ST-2: The tool should be flexible enough to allow students to collect large samples (Lee
& Hollebrands, 2006; Konold & Kazak, 2008).
One of the important issues in teaching and learning of statistics and probability is having large samples to have more convincing data in order to make statistical inferences.
Simulation tools should allow students to choose their sample size and be flexible to collect various amounts of data, particularly very large data sets (500 or above).
Phase 3: Analyze data
AD-TQ-1: The questions should lead the students to discover how to analyze the data by
Statistics learning process is distinctively different from mathematical learning process as it is discussed in Chapter 2. One of the reasons of that difference is the analyzing data phase of statistical investigation. Doing that without a guide could be very difficult for students who are not aware of that difference. Thus, informing students about analyzing data should be addressed in task design process.
AD-TQ-2: The students have to be given the chance of constructing new meanings, posing
new questions and so, creating own models. (Abrahamson & Wilensky, 2007; Abrahamson, 2009; Prodromou, 2012).
Students may be taught that statistical problems have a great potential for further
investigations. Having students to construct new meanings, pose new questions could open a door to create their own models.
AD-ST-1: The simulation has to provide the opportunity for analyzing the results. Students
should be able to use tables and graphs. (Chance & Rossman, 2006; Lee & Hollebrands, 2006; Konold & Kazak, 2008)
Having students to get opportunities for working on both static and graphical analysis of results would be helpful for them to comfortably focus on cognitively problematic sides of the subject, instead of spending time on imagining or drawing the results.
AD-ST-2: The simulation needs to give the opportunity of creating bridging tools between
It is important for students to realize that there is a connection between theoretical probability and empirical probability. Actually seeing the simulation runs and the data is collected in a result table; theoretical probability will be more convincing.
Phase 4: Interpret results
IR-TQ-1: The questions need to be open for interpretations and facilitate students making
connections back to the context of the problem. (Batanero, 2005).
The last phase of a statistical investigation is interpreting the results. Instead of asking students the probabilities of several events in which they only use their mathematical knowledge to answer, the questions need to be open for interpretations and discussions. Not only for cognitive issues about probability, but it also helps students to develop analytical thinking skills in other areas, like their scientific and social science investigations.
IR-ST-1: The tool affords multiple ways of summarizing data from simulations that can lead
to multiple interpretations of results. (Batanero, 2005; Abrahamson, 2009; Pfannkuch & Ziedins, 2014)
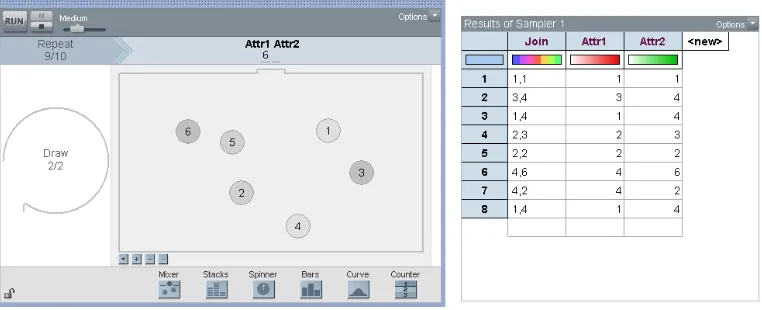
The tool should represent more than one way of summarizing data from simulations; therefore, students would be able to interpret the results in several ways. For example, The Sampler provides several different ways to see the ‘Results Table’, such as scatter plot, histogram, etc.
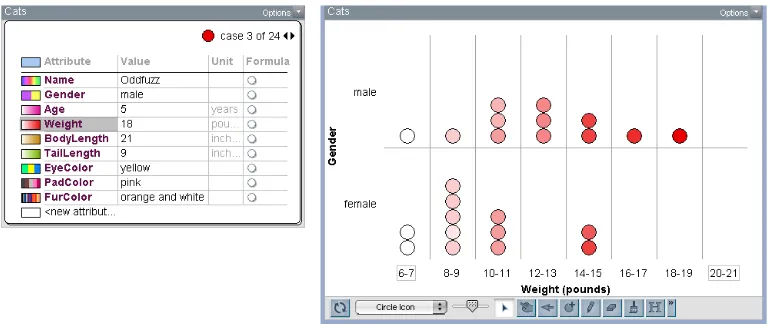
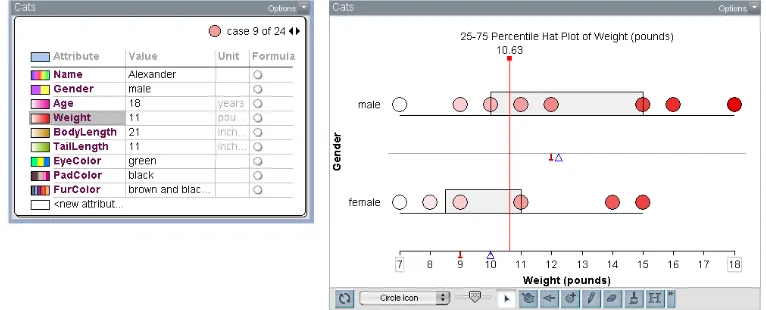
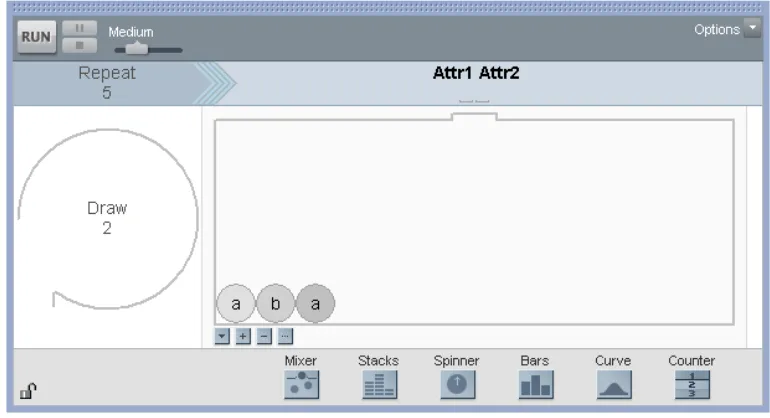
Using TinkerPlots as a Modeling and Simulation Tool