Copyright 0 1989 by the Genetics Society of America
Pheromones and Pheromone Receptors Are the Primary Determinants
of
Mating Specificity in the Yeast Saccharomyces cererrisiae
Alan Bender' and George
F. Sprague,
Jr.'Institute of Molecular Biology and Department of Biology, University of Oregon, Eugene, Oregon 97403 Manuscript received August 18, 1988
Accepted for publication November 25, 1988
ABSTRACT
Saccharomyces cereoisiae has two haploid cell types, a and a , each of which produces a unique set of proteins that participate in the mating process. We sought to determine the minimum set of proteins that must be expressed to allow mating and to confer specificity. We show that the capacity to synthesize a-factor pheromone and a-factor receptor is sufficient to allow mating by matal mutants, mutants that normally do not express any a- or a-specific products. Likewise, the capacity to synthesize a-factor receptor and a-factor pheromone is sufficient to allow a ste2 ste6 mutants, which do not produce the normal a cell pheromone and receptor, to mate with wild-type a cells. Thus, the a-factor receptor and a-factor pheromone constitute the minimum set of a-specific proteins that must be produced to allow mating as an a cell. Furthermore, the production of these two proteins dictates the mating specificity exhibited by that cell. Further evidence that the pheromones and pheromone receptors are important determinants of mating specificity comes from studies with mata2 mutants, cells that simultaneously express both pheromones and both receptors. We created a series of strains that express different combinations of pheromones and receptors in a mata2 background. These constructions reveal that mata2 mutants can be made to mate as either a cells or as a cells by causing them to express only the pheromone and receptor set appropriate for a particular cell type. Moreover, these studies show that the inability of matad mutants to respond to either pheromone is a consequence of two phenomena: adaptation to an autocrine response to the pheromones they secrete and interference with response to a factor by the a-factor receptor.
H
APLOID cells of the yeast Saccharomyces cerevis-iae exhibit either of two cellular phenotypes, the mating types a and a. These cells can reproduce vegetatively by a mitotic cell cycle. However, when cells of opposite mating type are co-cultured, they exit the cell cycle and participate in a mating process that results in cell and nuclear fusion to create an a / a
diploid cell (reviewed by SPRAGUE, BLAIR AND THOR- NER 1983). Mating occurs only between cells of op- posite type; each haploid cell type produces several unique proteins, including pheromones, receptors,
and agglutinins, that participate in the mating process and may contribute to the specificity of mating. T h e reciprocal action of cell-type-specific peptide phero- mones initiates mating. In particular, a cells secrete a factor, which binds to a receptor present only on the surface of a cells (JENNESS, BURKHOLDER and HAR-
TWELL 1983), and a cells secrete a factor, which interacts with a receptor present only on the surface
of a cells (HAGEN, MCCAFFREY and SPRAGUE 1986; BENDER and SPRAGUE 1986; NAKAYAMA, MIYAJIMA
and ARAI 1987). In response to pheromone, a cell changes its pattern of gene expression (HAGEN and
' Present address: Department of Biological Sciences, University of Mich- * To whom correspondence should be addressed.
igan, Ann Arbor, Michigan 48109. Genetics 121: 463-476 March, 1989.
SPRAGUE 1984; STETLER and THORNER 1984; HAR-
TIC et al. 1986; KRONSTAD, HOLLY and MACKAY 1987; VAN ARSDELL, STETLER and THORNER 1987),
increases production of agglutinin (FEHRENBACHER,
PERRY and THORNER 1978; BETZ, DUNTZE and MAN-
NEY 1978), prepares for cell and nuclear fusion (ROSE,
PRICE and FINK 1986; MCCAFFREY et al. 1987; TRUE- HEART, BOEKE and FINK 1987), arrests cell division in the GI phase of the cell cycle (BUCKING-THROM et al.
1973; WILKINSON and PRINGLE 1974), and projects part of itself toward its mating partner (projection formation) (AHMAD 1953; LEVI 1956; RINE 1979).
Cell and nuclear fusion of the mating partners then creates an ala zygote.
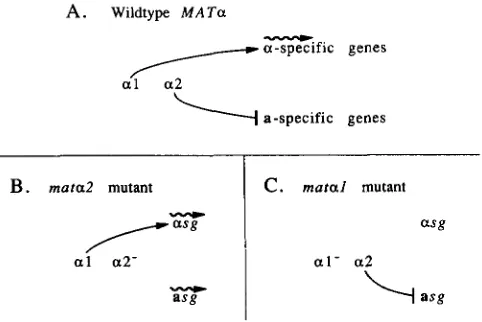
T h e differential production of pheromones, recep- tors, and agglutinins in a and a cells is achieved through the action of regulatory proteins encoded by the mating-type locus (MAT). Of the two MAT alleles, MATa and MATa, the latter is the determinant of whether a cell exhibits the a or a phenotype. MATa encodes two proteins, MATa1 and MATa2, that con- trol transcription of known a-specific and a-specific genes (Figure 1) (for review see SPRAGUE, BLAIR and
THORNER 1983; HERSKOWITZ 1986; NASMYTH and
464 A. Bender and G. F. Sprague, Jr.
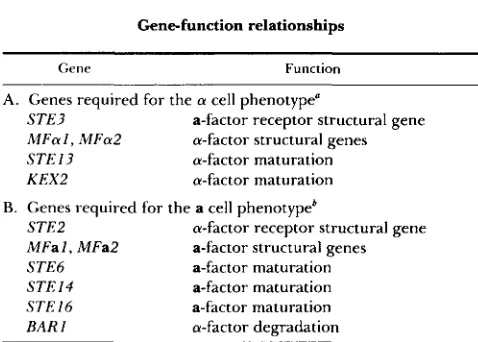
TABLE 1
Gene-function relationships
Gene Function
A. Genes required for the a cell phenotype”
STE3 a-factor receptor structural gene MFa I , MFa2 a-factor structural genes STE 13 a-factor maturation
K E X 2 a-factor maturation
B. Genes required for the a cell phenotypeb
S T E 2 a-factor receptor structural gene MFa1, MFa2 a-factor structural genes
STE6 a-factor maturation
STE14 a-factor maturation STE 16 a-factor maturation
BAR I a-factor degradation
a The references for the assignment of function to each of these genes are given in the text. Transcription ofSTE3 (SPRAGUE, JENSEN and HERSKOWITZ 1983) and MFal and MFa2 (FIELDS and HER- SKOWITZ 1985) is limited to the a cell type. STE13 and K E X 2 are
transcribed in all three cell types (LEIBOWITZ and WICKNER 1976; JULIUS et al. 1983; G . SPRAGUE and I . HERSKOWITZ, unpublished
observations).
The references for the assignment of function to each of these genes are given in the text. Transcription of STEZ (HARTIG et al. 1986), MFal and MFa2 (MICHEALIS and HERSKOWITZ 1988), STE6 (WILSON and HERSKOWITZ 1984), and BAR1 (KRONSTAD, HOLLY
and MACKAY 1987) is limited to the a cell type. STE16 ( R A M I ) is
expressed in all three cell types (POWERS et al. 1986). Expression of STE14 has not yet been examined.
tural genes and the a-factor receptor structural gene, whereas MATa2 represses transcription of the a-spe- cific gene set, which includes the a-factor structural genes and a-factor receptor structural gene. Thus, MATa cells express only the a-specific gene set. We presume that any as yet unidentified a- or a-specific genes will also be regulated in this fashion by M A T a l
or MATa2. Because MATa cells lack the two MATa- encoded regulators, they express only the a-specific gene set.
The importance of the particular a- and a-specific proteins in the mating process has been investigated through the use of structural gene mutations (see Table 1 for summary of gene functions). These studies reveal that the pheromones and receptors are re-
quired for mating: strains harboring mutations in STE3 (a-factor receptor)(MACKAY and MANNEY 1974;
HACEN, MCCAFFREY and SPRACUE 1986), STE2 (a-
factor receptor) (MACKAY and MANNEY 1974;
HARTWELL 1980; JENNESS, BURKHOLDER and HAR-
TWELL 1983; BLUMER, RENEKE and THORNER 1988;
MARSH and HERSKOWITZ 1988; KONOPKA, JENNESS
and HARTWELL 1988), M F a l and MFa2 (a factor)
(KURJAN and HERSKOWITZ 1982; SINCH et al. 1983;
KURJAN 1985), MFal and MFa2 (a factor) (MICHAELIS
and HERSKOWITZ 1988), STE13 or KEX2 (genes re- quired for maturation of a factor) (LEIBOWITZ and
WICKNER 1976; SPRAGUE, RINE and HERSKOWITZ
1981; JULIUS et al. 1983, 1984), or STE6, STE14, or STE16 (genes required for maturation of a factor)
(BLAIR 1979; RINE 1979; POWERS et al. 1986; WILSON
and HERSKOWITZ 1987) typically show a mating effi- ciency that is reduced by six orders of magnitude compared with wild-type strains. Surprisingly, the ag- glutinins do not have essential roles in mating. T h e structural genes for these proteins have not been identified with certainty, but the A G a l gene may encode the a-agglutinin. Strains harboring mutations in these gene show only a modest reduction in mating efficiency (two- to tenfold) compared with wild type
(SUZUKI and YANAGISHIMA 1985; J. KURJAN and P.
LIPKE, personal communication). In toto, these studies have identified some a- and a-specific components that are required for mating, but they leave unan- swered two questions. (1) What combination of a- or a-specific functions is sufficient to allow mating? That is, are there as yet unidentified a- or a-specific func- tions that are required for mating? (2) How is mating specificity achieved? Under standard mating condi- tions there are many a and a cells present that have prepared for mating by responding to the pheromone produced by the opposite mating type. Nonetheless, in this mix a and a cells only mate with cells of the opposite mating type. Given that the agglutinins ap- parently do not have essential roles in mating and that they are the only known proteins involved in cell contact, where does specificity arise? One possibility is that there are unidentified a- and a-specific functions that contribute to mating specificity. A second possi- bility is that the pheromones and receptors dictate specificity. For example, perhaps the sending and receiving of pheromone signals establishes directional cues that identify mating partners.
We have investigated these issues from several per- spectives. First, we determined whether the provision of known a-specific functions allows matal mutants to mate as a. These mutants fail to activate transcription of a-specific genes, but still repress a-specific genes, and hence express neither a- nor a-specific genes (Figure 1). It has been shown previously that expres- sion of receptor (from the heterologous GAL1 pro- moter) is sufficient to allow response to pheromone by these mutants (BENDER and SPRACUE 1986; NA-
Mating Specificity in Yeast 465
A . Wildtype M A T a
/
s l f i c genesa-specific genes
B . mara2 mutant
C.
m u r a l mutantFIGURE 1 .-Control of a- and a-specific gene expression. Expres- sion of genes that are controlled by the two products of M A T a is shown for wild-type MATa cells (A), mata2 mutant cells (B), and matal mutant cells (C). Wavy lines indicate gene expression, lines with arrowheads indicate stimulation of gene expression; lines with terminal bars indicate inhibition of gene expression. The terms a- specific genes (asg) and a-specific genes (asg) indicate genes whose transcription is limited to a or a cells. There are examples of genes that are required for mating by only one cell type but are nonethe- less expressed in both a and a cells (e.g., STEZ3 and STEZ6), but these genes are not a- or a-specific genes in the sense defined here. See text and Table 1 for further details.
s p o n d t o e i t h e r pheromone and in a defect in mating. T h i s view is derived in p a r t from the finding that
mata2 mutants that also carry a m u t a n t allele of STE3
mate efficiently as a cells (STRATHERN, HICKS and
HERSKOWITZ 198 1 ; SPRAGUE, RINE and HERSKOWITZ
1981). Apparently the a-factor receptor is a key com- p o n e n t in the antagonism of t h e a cell phenotype in
the setting of a mata2 mutant. To u n d e r s t a n d t h e roles that the pheromones and receptors play in de- termining the pheromone response and mating phe- notypes of mata2 mutants, we have engineered a series of isogenic strains that express various combinations o f CY- and a-specific products. Finally, we have deter- mined whether the specificity of mating can be per-
t u r b e d if the ability of an a cell to synthesize its normal p h e r o m o n e and receptor is disrupted, and instead it is made to synthesize the inappropriate pheromone and receptor.
MATERIALS AND METHODS
Plasmids, strains and media: Relevant strains are listed in Table 2. Appropriate alleles of mating-related genes were introduced by the one-step gene replacement method of ROTHSTEIN ( 1 983). mat&-A1 contains an Xbal deletion that removes 53 codons from the 3' end of mata2. (The sequence of mata2 is reported in ASTELL et al. 1981.) ste3::LEUZ is described in HAGEN, MCCAFFREY and SPRAGUE (1986).
bar1::LEUZ is described in KRONSTAD, HOLLY and MACKAY
(1987). stel3::LEUZ has approximately 1.6 kb of STE13 coding sequence replaced with LEU2 DNA (G. SPRAGUE and I. HERSKOWITZ, unpublished data). m a t a l - 1 8 9 is de- scribed in TATCHELL et al. (1981). T h e ura3 mutation in SY 1229 was selected using 5-fluoroorotic acid (BOEKE et al.
1987). The lys2 mutations in strains SY1240 and SY 1251 were selected using a-aminoadipic acid (CHATTOO et al. 1979). Strain SY1263 was made M A T a by HO-promoted mating-type interconversion using plasmid GALlO-HO
UEN-
SEN and HERSKOWITZ 1984).YCp50 contains CEN4 and ARSl on a URA3-based plas- mid (STINCHCOMB, MANN and DAVIS 1982). pSL602 con- tains a 4-kb Hind111 fragment of M A T a on YCp50 (kindly provided by J. MARGOLSKEE). pSL552 contains STE3 under
GAL1 promoter control on YCp50 (BENDER and SPRAGUE
1986). pSLl13 contains an inversion between the XhoI and Sal1 sites of YEp13, a LEU2 2 pm-based plasmid (BROACH, STRATHERN and HICKS 1979). Into this plasmid we cloned a 1.7-kb BglII-Sal1 fragment containing TPZ-MFal (kindly provided by V. MACKAY) and a 4.8-kb fragment containing LYSZ, to generate pSL801. The 4.8 LYSZ fragment was derived from pDA620-R (BARNES and THORNER 1986). A Hind111 LYSZ fragment from this plasmid was cloned into a version of pBR322 in which the HzndIII-EcoRI segment was substituted by the HindIII-EcoRI polylinker from M I 3 phage mp18. This manipulation enabled the LYSZ segment to be cloned into pSL 1 13 as a Sal1 fragment.
The media used were YPD (SHERMAN, HICKS and FINK 1982), YPG (YPD containing 3% galactose instead of 2% glucose), SD-His or SD-Ura (synthetic glucose medium sup- plemented with adenine, L-arginine, L-leucine, L-lysine, L- methionine, L-phenylalanine, L-threonine, L-tryptophan, L- tyrosine, L-lysine, and uracil or L-histidine) (SHERMAN, HICKS and FINK 1982), SD-Ura-Lys (SD-Ura medium that also lacks L-lysine) and SG-Ura-Lys (same as SD-Ura-Lys, but containing galactose instead of glucose). SD
+
X is synthetic glucose medium supplemented with the indicated amino acids. Plates contained 2% Bacto agar. Yeast cells were grown at 30".Quantitative matings: Quantitative mating were per- formed essentially as described by HARTWELL (1980). In particular, for the matings presented in Table 3, cells of mating-type tester strain SY 1229 were grown to stationary phase in YPD, pelleted by centrifugation, and resuspended at approximately 20 Klett units (KU; 1 KU (green filter) = lo5 cells/ml) in YPG. Simultaneously, plasmid-bearing cells whose mating efficiency was to be determined (matal-189, MATa, and MATa barl::LEU2 ste2-1O::LEUZ ste6::lacZ) were grown in galactose-containing plasmid-selective minimal me- dium (SG-Ura or SG-Ura-Lys) to approximately 100 KU, pelleted by centrifugation, resuspended in YPG at approxi- mately 15 KU, and allowed to double twice (approximately 7 hr). An aliquot of each culture was then plated on SD
+
His+
Leu to check for reversion and contamination. One milliliter (50 KU) of plasmid-bearing cells was mixed by vortexing with 1 ml (50 KU) of SY1229. One milliliter of each mating mix was filtered onto a nitrocellulose filter (Millipore, type HA 0.45 pm) and incubated for 6 hr on YPG plates. Cells from the filters were then resuspended in water, sonicated, diluted, and titered on SD+
His+
Leu and on YPD plates. T h e absolute mating efficiency was defined as the ratio of the titer of diploids (from the SD+
His+
Leu plates) to the titer of the total number of cells in the mating mix (from the YPD plates).In the matings involving W303-lb or YY 1154 with tester strains EGI 23, cells were prepared essentially as described above except glucose was always the carbon source. The cells were mated for 4.5 hr on YPD plates, resuspended in water, sonicated, and plated on SD-His (to titer diploids) and YPD plates (to titer the total number of cells in the mating mix).
466 A. Bender and G. F. Sprague, Jr.
TABLE 2
Strains
Strain
DC5 EG 123 246-1-1 2301-189 W303-lb T2-4d
SY 1229 SY 1263 SY1271
YY506 YY1154
SY925
SY987 SY1103 SY1153 SY1154 SY1156 SY1159 SY1164 SY 1167 SY 1169 SY1176 S Y l l 7 9 S Y l l 8 0 SY1184 SY1187 SY1195 S Y l l 9 7 SY1212 SY 1228 SY 1234 SY 1236 SY 1240 SY1241 SY 1242 SY1251 SY 1256 YY969 YY987 YY1059 YYllOl YY1102 YY1104 YY1121 YY1091 YY 1129 YYlllO YY1087
Genotype Source
MATa leu2-3,-112 his? canl gal2 J. STRATHERN
MATa leu2 ura3 trpl his4-519 canl Gal- K. TATCHELL
MATa leu2 ura? t r p l his4-519 canl Gal- K. TATCHELL
matal-189 (other markers as in 246-1-1) K. TATCHELL
M A T a leu2-?,-112 ura3-1 trpl-1 his?-11,-15 ade2-1 canl-100 J. KURJAN
M A T a mfal::LEU2C mfa2::LEU2C (other markers as in W303- J. KURJAN
M A T a leu2-3,-112 his? ura? canl gal2 ura3 derivative of DC5; D. HAGEN
M A T a leu2-?,-112 his3 ura? canl gal2 M A T a derivative of SY 1229
M A T a mfal::LEU2C mfa2::LEU2C lys2 (other markers as in lys2 derivative of T2-4d
M A T a ste?::LEU2 leu2-?,-112 his4 canl gal2 HAGEN, MCCAFFREY and SPRACUE (1 986)
TPI-MFal LYS2 LEU2 /MAT& mfal::LEU2C mfa2::LEU2C lys2 pSL801 (YEpl3)”/SY 1271
MATa steP-lO::LEU2 leu2 ura3 met14 trplam his6 adel ade2-loc BENDER and SPRAGUE (1986) 1 b)
W303-lb)
(other markers as in W303-lb)
cry1 or CRY1
All subsequent strains are isogenic to SY925*
M A T a steP-lO::LEU2 ste6::lacZ M A T a ste2-lO::LEU2 ste6::lacZ mata2-A1 steP-lO::LEU2 ste6::lacZ MATa
M A T a ste?::LEU2 MATa barl::LEU2
MATa barl::LEU2 ste2-lO::LEU2 ste6::lacZ mata2-A1 barl::LElJ2 steZ-lO::LEU2
mata2-A1 barl::LELJ2 ste2-lO::LEU2 ste6::lacZ mata2-A1 ste2-1O::LEl
’
mata2-A1 ste6::lacZ mata2-A1 ste?::leu2
mata2-A1 barl::LEU2 ste6::lacZ M A T a
mata2-A1 ste3::LEU2 barl::LEU2 mata2-A1 barl::LEU2
mata2-A1 stel?::LEU2
mata2-A1 stel3::LEU2 ste6::lacZ mata2-A1 ste3::LEU2 stel3::LEU2 M A T a ste?::LEU2 stel?::LEU2
M A T a bar1::LEUP ste2-lO::LEU2 ste6::lacZ lys2 matal-189
mata2-A1 ste3::LEU2 stel3::LEU2 ste6::lacZ matal-189 lys2
mata2-A1
M A T a URA? lmata2-Al ste2-lO::LEU2 ste6::lacZ MATa URA3 lmata2-Al barl::LEU2 ste6::lacZ M A T a URA3 lrnata2-AI stel?::LEU2
M A T a URA? lmatal-189 lys2 URA? l m a t a l - 1 8 9 lys2
GALl-STE? URA3 /matal-189 lys2
URA?, TPl-MFal LYS2 LEU2 lmatal-189 lys2
GALl-STE3 URA3, TPl-MFal LYSP LEU2 lmatal-189 lys2 URA? / M A T a
URA? IMATa bar1::LEUP ste2-lO::LEU2 ste6::lacZ lys2
GALl-STE3 URA3, TPI-MFal LYS2 LEU2 /MATa barl::LEU2 ste2-lO::LEU2 ste6::lacZ lys2
BENDER and SPRAGUE (1986) SY987 made M A T a
SY987 made mata2-A1
SY925 made STEP
SY 1 154 made ste?::LEU2
SY 1 154 made barl::LEU2
Segregant from YY969 X SY 1 159 Segregant from YY969 X SY 1 159 Segregant from YY969 X SY 1 159 Segregant from YY969 X SY 11 59 Segregant from YY969 X SY 1 159 Segregant from YY969 X SY 1 156 Segregant from YY969 X SY 1 159 Segregant from SYllO3 X SY1156 Segregant from YY987 X S Y l l 5 6 Segregant from YY969 X SY 1 159 SY1256 made stel3::LEU2
SY 1 179 made stel?::LEU2
Segregant from YY1059 X SY 1156 Segregant from YY 1059 X SY 1 156
lys2 derivative of SY 1 164 S Y l l 8 7 made matal-189
Segregant from YY969 X SY1236
lys2 derivative of SY 1241 Segregant from YY969 X SY 1 159 pSL602 (YCpSO)/SY1153 pSL602 (YCp5O)/SY 1184 pSL602 (YCp5O)/SY 12 12 pSL602 (YCp5O)/SY 125 1 YCp50/SY1251
pSL552 (YCp50)/SY1251 YCp50, pSL801 (YEpl3)/SY1251
pSL552 (YCpSO), pSL801 (YEpl3)/SY1251
YCp5O/SY 1240
pSL552 (YCp50), pSL801 (YEp13)/SY1240 YCp50/SY 1 154
a Whether the plasmid is a derivative of YCp50 or YEP13 is indicated in parentheses.
’
T h e genotype at the mating-type locus is given for all strains. For STEP, STE3, STE6, STE13 and B A R I , a designation is given only if the gene is mutant. In addition, newly introduced mutations in the LYSP gene are also noted. For the YY plasmids the chromosomal ura3Mating Specificity in Yeast 467
not mate because of a mutation in STE3, but that do secrete
a factor). In these experiments, YY506 cells were grown as the SY 1229 cells were grown and then filtered with an equal number of YY 1 129 and SY1229 cells. The matings were done as described above, except that the mating efficiency was defined as the ratio of the titer of diploids to 0.67X the total titer of cells.
In the matings described above that involved plasmid- bearing strains, the proportion of cells actually containing the plasmids was determined at the beginning of the mating by titering the number of cells able to form colonies on selective medium (e.g., SG-Ura) and comparing that value with the number of cells able to form colonies on nonselec- tive medium (e.g., SG-Ura
+
Ura). For YCp50-based plas- mids the proportion of plasmid-bearing cells was typically 0.7 to 0.9, and for YEpl3-based plasmids the proportion was typically 0.4 to 0.7. Mating efficiencies were not nor- malized to account for these proportions because the gen- eration in which the plasmids were lost is not known nor is the half-life of receptor activity or pheromone production in the plasmid-free cells.The matings for Table 4 were performed as follows. Cells from stationary phase YPD cultures were diluted to approx- imately 12 KU into YPD and allowed to double twice. Cells were plated on SD-His to assay for revertants and contami- nants. One milliliter (50 KU) of cells whose mating efficiency was to be determined was mixed by vortexing with 1 ml(50 KU) of the appropriate tester cells. The mating mixes were filtered through nitrocellulose filters and the filters were incubated 4.5 hr on YPD plates. Cells on the filters were then resuspended in water, sonicated, diluted, and plated on SD-His (to titer diploids) and on YPD (to titer the total number of cells in the mating mix).
Cell cycle arrest: Cells from stationary phase YPD cul- tures were diluted to approximately 12 KU in YPD and allowed to double twice. The cultures were then incubated with an equal volume of either cell-free filtrates obtained from stationary phase YPD cultures of strains DC5 (as a source of a factor) or 23a-189 ( m a t a l ; therefore no phero- mone present). In some instances the 23a-189 filtrate con- tained 2.5 rg/ml a factor (Sigma). After 90 min, aliquots of cultures were pelleted by centrifugation, resuspended by vortexing in 3% formaldehyde saline solution, and sonicated to separate clumped cells. At least 200 cells from each culture were scored for the presence or absence of buds using phase contrast microscopy. Cells in the GI phase of the cell cycle are unbudded.
Transcript analysis: Cultures prepared for cell cycle arrest were also used for transcript analysis. Cells were harvested 30 min after exposure to pheromone. RNA was isolated as described in SPRAGUE, JENSEN and HERSKOWITZ (1 983). FUSl and URA3 RNAs were probed as described in BENDER and SPRAGUE (1986). Quantitation of the RNAs was by densitometric scanning of autoradiograms.
RESULTS
The a-factor receptor and a factor are the only a-
specific products needed f o r mating: A m a t a l mu- tant expresses neither a- nor a-specific products (see Figure 1). To ask which a-specific products are needed for mating, m a t a l mutants engineered to ex-
press the a-factor receptor and/or a factor were tested for mating competence. To express the a-factor recep- tor in a m a t a l mutant, STE3 was placed under the control of the G A L l promoter on the single-copy
plasmid YCp50 (BENDER and SPRACUE 1986). TO produce a factor, M F a l was expressed under the
control of the TPZ promoter (triose phosphate isomer- ase) on a derivative of plasmid Y E p l 3 (TPZ-MFal was the gift of V. MACKAY). The mating ability of m a t a l
cells containing the G A L l S T E 3 and/or the TPZ-MFal
plasmid was compared with the mating ability of the
same cells harboring either YCp50 alone or YCp50 containing the wild-type M A T a l gene.
As shown in Table 3, m a t a l cells that contained the
M A T a plasmid, and therefore expressed all a-specific genes, mated efficiently, whereas m a t a l cells with the control plasmid, mated with a relative efficiency of 1O"j (strains YY 1 101 and YY 1 102). The expression
of STE3 alone did not increase the mating ability of
the m a t a l mutant, and the expression of M F a l alone increased mating by about one order of magnitude (strains YY 1 104 and YYl121). The expression of
both STE3 and M F a l , however, increased the mating efficiency more than four orders of magnitude to
about 6% (strain YY 1091). This mating efficiency, though substantial, should be further normalized to the efficiency observed when the STE3 or M F a l plas- mids were tested for the ability to restore mating to strains harboring defects in the receptor structural gene alone or in the a-factor structural genes alone.
The G A L l S T E 3 plasmid complemented a ste3 chro- mosomal mutation with 100% efficiency (data not shown), but the T P l - M F a l plasmid complemented an
mfal mfa2 double mutant only well enough to allow 30% of the cells to mate (Table 3). These data suggest that a more accurate estimate of the mating efficiency
of the matal mutants containing the GALl-STE3 and
TPZ-MFal genes is 20% (6+30%), nearly indistin- guishable from wild-type mating. We conclude that
the a-factor receptor and a factor are the only a-
specific products needed for mating, although other
a-specific products might make minor contributions to mating. In parallel experiments, J. KURJAN has reached the same conclusion (personal communica- tion).
Wild-type MATa cells can mate with MATa cells that express a-factor pheromone and a-factor recep- tor: T h e ability of m a t a l mutants containing G A L l - STE3 and TPZ-MFal to mate efficiently raises the question of how the specificity of mating is conferred, given that the pheromones and receptors are not
thought to be involved in cell contact. One possibility is that other a- or a-specific products may function to prevent mating between cells of the same mating type.
A second possibility is that the reciprocal detection of
468 A. Bender and G . F. Sprague, Jr.
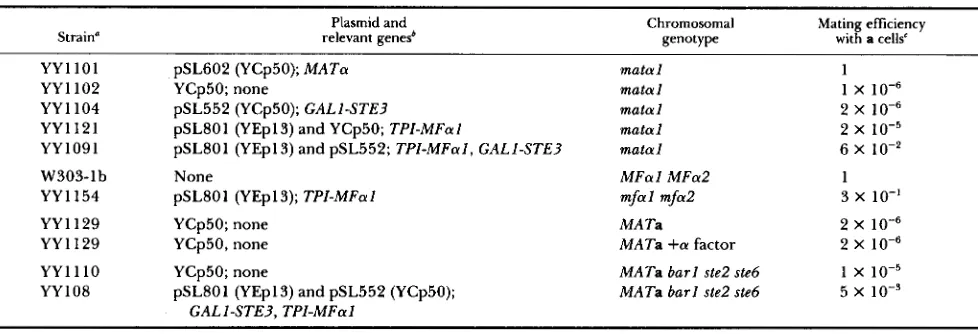
TABLE 3
Expression o f STE3 and m a l is sufficient to allow mating as a
Strain" relevant genes'
Plasmid and Chromosomal
genoty Pe
~ ~~~ ~ ~~~~
Mating efficiency with a cells'
YYllOl pSL602 (YCp50); MATa matal 1
YY1102 YCp50; none matal 1 x
YY1121 pSL801 (YEp13) and YCp50; TPI-MFal matal 2 X 1 0 - ~
YY1091 pSL801 (YEpl3) and pSL552; TPI-MFal, CALI-STE? matal 6 X lo-*
~~~ ~
YY1104 pSL552 (YCp50); CALI-STE? matal 2 x
W303-lb None MFal MFa2 1
YY1154 pSL801 (YEpl3); TPI-MFal mfal mfa2 3 x 10-I
YY1129 YCp50; none MA Ta 2 x
YY1129 YCp50, none MATa +a factor 2 x
YY1110 YCp50; none MATa barl ste2 ste6 1 X 1 0 - ~
YY108 pSL801 (YEp13) and pSL552 (YCp50); MATa barl ste2 ste6 5 x
CALI-STE?, TPI-MFal
All strains were isogenic except W303-16 and YY1154, which were isogenic to each other. Whether the plasmid is a derivative of YCp50 or YEpl3 is indicated in parentheses.
' Mating efficiencies were determined as described in MATERIALS AND METHODS. The a tester strain was SY1229 except for matings involving W303-lb and YYll54. For these two strains the a tester was EG123. The mating efficiency for W303-lb is the average of two experiments; for YY 1 102, YY 1 104, YY 1 12 1, YY 1 129
+
a factor, and YY 1 1 10, the qverage of three experiments; for YY 1 154, the average of four experiments; for YYllOl and YY1129, the average of six experiments; and for YY1091 and YY1087, the average of nine experiments. Mating efficiencies involving W303-lb and YY 1154 were normalized to the efficiency observed in the mating of W303-lb with EG123 (absolute mating efficiency of 2 X lo-'). Mating efficiencies for all other strains were normalized to the efficiency observed in the mating of YY 1 101 with SY 1229 (absolute mating efficiency of 4 X 10"*
a standard error of 1.5 X lo-').other a cells. We engineered an a strain to produce the species of pheromone and pheromone receptor normally expressed only in an a strain. T h e strain carries mutations in the a-specific STE2 and STE6 genes so that the a-factor receptor and active a factor would not be produced. In addition, the strain carries a mutation in BARl, which encodes an a-factor pro- tease (CIEJEK and THORNER 1979; SPRAGUE and HER-
so production of a factor would not be prevented. Plasmids containing GALl-STE3 and TPZ-MFal were introduced into the MATa ste2 ste6 barl strain, and the ability of this strain to mate with a wild-type a strain was determined.
Wild-type a cells mated with other a cells at a frequency of about (Table 3), even in the pres- ence of exogenous a factor (provided from helper, nonmating a cells, see MATERIALS AND METHODS). In contrast, the MATa ste2 ste6 barl strain carrying the STE3 and MFa1 plasmids mated with other a cells at a frequency of 5 X lo-', a substantial level of mating. T h e most relevant comparison is with the matal mu- tant harboring the same plasmids, which mated with a cells at a frequency of 6 x lo-' (Table 3). By this comparison, the a X a mating involving the engi- neered a strain is reduced only about tenfold from the expected maximum frequency. Thus, although there may be an a-specific product that partially inhib- its a x a mating, the ability to send and receive pheromone signals appears to be an important deter- minant for the specificity of mating.
Pheromones and pheromone receptors control the
SKOWITZ 1981; MANNEY 1983; MACKAY et al. 1988),
mating specificity of mata2 mutants: mata2 mutants express both the a- and a-specific gene sets (see Figure
1). Although the initial expectation might be that the mutants would be promiscuous and mate with both a and a cells, in fact they exhibit a nonmating phenotype and are unable to respond to either pheromone. As mentioned in the introduction, it has been proposed that antagonisms between a- and a-specific gene prod- ucts account for these phenotypes. T o determine what functions must be removed to restore the capacity to mate or to respond to pheromone in a mata2 back- ground, we have created mutations in the receptor structural genes and/or in genes required for phero- mone production. All strains used were isogenic; the mutations were introduced by substitutive transfor- mation (ROTHSTEIN 1983) using disrupted alleles of the appropriate genes. T h e ste2 and ste3 mutations abolish receptor function (HAGEN, MCCAFFREY and SPRACUE 1986; BENDER and SPRAGUE 1986; NAKA-
YAMA, MIYAJIMA and ARAI 1987), and strains harbor-
ing st86 or stel3 mutations secrete very little active a factor or a factor (WILSON and HERSKOWITZ 1987; SPRAGUE, RINE and HERSKOWITZ 198 1 ; JULIUS et al.
Mating Specificity in Yeast
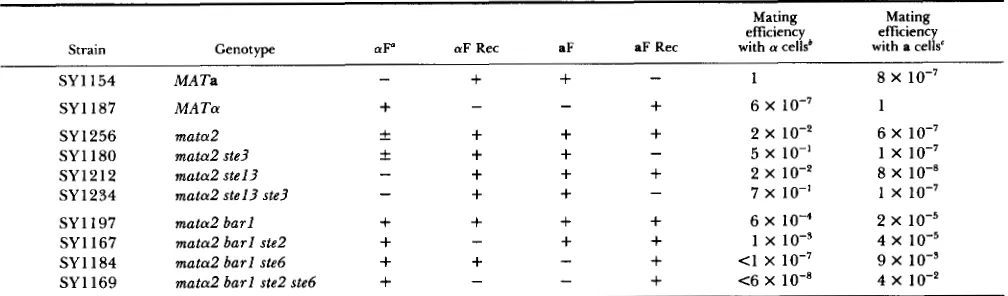
TABLE 4
Mating efficiencies of mata2 mutants and their derivatives
469
Mating Mating
Strain Genotype aF0 aF Rec aF aF Rec with a cells* with a cells' effkiency efficiency
SY1154 M A Ta
-
+
+
-
1 8 XSYll87 M A Ta
+
--
+
6 X 1SY 1256 m a t a 2
*
+
+
+
2 xlo+
6 XSY1180 mata2 ste3
*
+
+
-
5 x 10" I X 10-7SY 1234 mata2 stel3 ste3
-
+
+
- 7 x 10" 1 xSY1197 m a t a 2 barl
+
+
+
+
6 X 10" 2 X 10⁻⁵SY 1 167 m a t a 2 barl ste2
+
-
+
+
I X 1 0 - ~ 4 X 1 0 - ~SY1184 m a t a 2 barl ste6
+
+
-
+
<I X 1 0 - 7 9 X 10⁻³SY1169 m a t a 2 barl ste2 ste6
+
--
+
<6 Xlo-*
4 x 10⁻² SY1212 m a t a 2 s t e l 3-
+
+
+
2 x 10- 8 Xlo-'
a Abbreviations: aF, a factor; aF Rec, a-factor receptor; aF, a factor; aF Rec, a-factor receptor. f indicates the very slight amount of a
factor that is secreted by BAR1 strains that are otherwise competent to synthesize a factor.
*
The a-tester strain was 246-1-1. All mating efficiencies are normalized to the efficiency of mating of strains SY1154 and 246-1-1, which was 3.9 X 10" in one experiment and 4.8 X 10" in a second experiment (see MATERIALS A N D METHODS for details). The values reported are the average of two determinations. Matings with efficiencies less than 1 0-5 varied no more than 50% about the mean. Matings with efficiencies greater than varied no more than 20% about the mean.' The a tester strain was EG123. All mating efficiencies are normalized to the efficiency of mating of strains SYll87 and EG123, which was 6.1 X 10-I in one experiment and 7.8 X 10" in a second experiment. The values reported are the average of two determinations. Matings with efficiencies less than varied no more than 50% about the mean. Matings with efficiencies greater than varied no more than 20% about the mean.
Previous work had established the requirements to allow mata2 mutants to mate efficiently with a cells- the production of a-factor receptor must be prevented (by a ste3 mutation) (SPRAGUE, RINE and HERSKOWITZ
198 1 ; STRATHERN, HICKS and HERSKOWITZ 198 1).
mata2 mutants have an inherent capacity to mate more efficiently with a cells than with a cells, and the introduction of a ste3 mutation augments their ability to mate with a cells. In our genetic background, the mating efficiency of a mata2 mutant (SY1256) was about 2 X lo-' with a cells and 6 X 10" with a cells (Table 4). T h e mata2 ste3 double mutants mated with a cells at essentially the same frequency as wild-type a cells mate with a cells (Table 4). Thus, removal of a single a-specific function, the a-factor receptor, allows the mata2 mutant to mate as if it were a wild-type a cell. In contrast, removal of the capacity to produce a factor by the introduction of a mutant allele of
STE13 (a gene whose product is needed for a-factor maturation) had little effect on the mating ability of the mata2 mutant (Table 4).
Because introduction of a mutation in an a-specific gene (STE3) enabled mata2 mutants to mate as a cells, we sought to determine whether introduction of mu- tations in a-specific genes involved in pheromone me- tabolism and reception would enable mata2 mutants to mate as a cells. mata2 mutants mate as a cells with a frequency of about 6 X lo". Part of the explanation for this low mating frequency is that mata2 mutants do not secrete detectable levels of a factor due to the expression of the a-specific BARl gene (SPRAGUE and
HERSKOWITZ 1981). Indeed, the ability of the mata2
mutant to mate as a increased by one order of mag- nitude when a burl mutation was introduced (SY1197; Table 4). T h e introduction of a mutant allele of STE2 (a-factor receptor) had little effect on the mating ability of the muta2 burl strain (SY 1 167). This is a somewhat surprising result given the ability of ste3 mutations (a-factor receptor) to allow mata2
mutants to mate as a. On the other hand, the intro- duction of a mutant allele of STE6, which is required for a-factor maturation, allowed the mata2 burl strain to mate as a at a frequency of 9 X lo-' (SY 1 184). Finally, a mata2 burl ste6 ste2 quadruple mutant had a slightly better mating efficiency (4 X 1 O-2; SY 1 169, Table 4). Thus, a reasonable capacity to mate as a can be conferred to a mata2 mutant by allowing it to secrete detectable a factor and by disrupting its ability to produce a factor. T h e observed mating is not at wild-type levels, however. It appears that, as was true in the case of the a X a matings described above, an unidentified a-specific product partially interferes with the ability to mate with a cells. We conclude that the ability of mata2 mutants to mate either as a cells or as a cells can be unmasked by elimination of known
a- or a-specific functions.
mata2 mutants exhibit a partial response to the
pheromone they secrete: As noted in the introduc- tion, muta2 mutants express both pheromone recep- tors and both pheromones, although the amount of secreted a factor that can be detected is slight, due to
470 A. Bender and G.'F. Sprague, Jr.
a
b
c
d
e
f
g
h
i
j
FUSl
uRA3
genotype
a2-
a2-b-
pheromone
-
af af
-
af
af
inviable. Two explanations for their viability can be offered: the pheromone response pathway may have adapted to the continuous supply of pheromone (MOORE 1984) or the receptors may interfere with each other's function. In this and the subsequent section we present evidence for both phenomena.
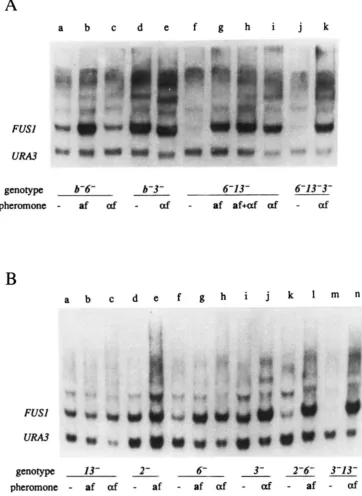
T o determine whether mata2 cells show any re- sponse to the pheromones they produce, we measured the amount of transcript from FUSI, a gene whose transcription is greatly enhanced in response to either pheromone (MCCAFFREY et al. 1987; TRUEHEART, BOEKE and FINK 1987). Figure
2
shows that the amount of FUSl transcript in a muta2 mutant (lane a) was intermediate to the basal and pheromone-inducedFUSl transcript levels found in isogenic, wild-type a or a strains (lanes g-j). Moreover, the amount of FUSl
transcript in the mata2 mutants did not change in response to added pheromone (lanes b and c). FUSl
transcript levels in a muta2 burl mutant, which se- cretes wild-type quantities of a factor (SPRACUE and HERSKOWITZ 1981) as well as a factor, were also comparable to those seen for the mata2 mutants (lanes d-f; summarized in Table 5).
Strains that do not produce either pheromone (e.g., mata2 s t e l 3 ste6) showed low FUSl transcript levels (Figure
3A,
lane f and Table 5,SY
1228), demonstrat- ing that the elevated FUSl levels seen in mata2 mu- tants indeed reflect an autocrine response. Thus, muta2 mutants have responded partially to the pher- omone they secrete, indicating that the receptors have at least some capacity to function.These data suggest that adaptation to the continu- ous supply of pheromone is part of the explanation for the viability of muta2 mutants. This suggestion was made more firm by examination of FUSl tran- script levels in mata2 ste2 and mata2 ste3 burl strains. These strains express one cognate receptor-phero-
a!
a
-
af
-
af
FIGURE 2.-FLSl transcript lev- els in wild-type cells and in mota2 mutants. R N A was isolated from strains SY 1256 (muta2; lanes a-c),
SY 1197 (muta2 burl; lanes d-9,
SY 1 1 87 (MATa; lanes g and h), and
S Y l l 5 4 (MATa; lanes i and j). The strains had been treated with a fac- tor, a factor, or no pheromone, as indicated. For each lane, 20 fig of total R N A was fractionated by aga- rose electrophoresis and transferred to nitrocellulose. FUSl and URA3 transcripts were visualized by hybrid- ization with radioactive R N A probes followed by autoradiography. The positions of the FUSl and URA3 tran- scripts are indicated.
mone set but do not express the other receptor, so
there is no possibility that interference between the receptors can contribute to the phenotype. Both strains showed levels of FUSl transcript similar to the induced levels seen for wild-type strains, and the FUSl
transcript levels did not change when pheromone was added (Figure
3A,
lanes d and e; Figure 3B, lanes d and e; summarized in Table5,
strainsSY
1 176 andSY
1 195). mata2 ste2 ste6 and mata2 ste3 stel3 strains, which no longer synthesize the cognate pheromone to the receptor they synthesize (STE6 is required for a- factor maturation and S T E l 3 for a-factor matura- tion), had low levels of FUSl transcript (Figure 3B, lanes k-n; Table 5, strains SY 1 153 andSY
1234),again demonstrating the autocrine nature of the in- termediate FUSl transcript levels.
The a-factor receptor interferes with response to a factor: If adaptation to pheromone is the explana- tion for the viability of mata2 mutants, and if there is not interference between a- and a-specific products, we expected that a mata2 mutant that did not itself produce either pheromone ought to be able to respond to either pheromone added exogenously. T o deter- mine whether this expectation proved true, we as- sayed two facets of the pheromone response of a mata2 ste6 s t e l 3 strain, namely transcriptional induc- tion of FUSl and cell cycle arrest.
As
shown in Figure3A (lanes f-i) and Table 5 (strain
SY
1228), the mata2 ste6 s t e l 3 mutant had a low basal level of FUSl tran- script that was greatly enhanced by the addition of either pheromone. However, although the mutant responded to both pheromones, it did not arrest fully in response to either pheromone, and it arrested rel- atively more poorly in response to a factor than to a factor (Table 5). Perhaps interference between the a-47 1
Mating Specificity in Yeast
TABLE 5
Response of mata2 mutants and their derivatives to pheromone
A. Response to a factor
Phenotype" FUSI/URA3' Percent unbudded' Strain Genotype a F a F Rec aF aF Rec Basal +aF Basal +aF
SY 1 187 MATa
+
SY 1 153 mata2 ste2 ste6 f
-
+
0.2 2 39 75) (41, (55, 37) 65SY 1228 mata2 stel3 ste6
-
+
-
+
0.1 3 63) (60, 62 32) 32 (31,SY 1 179 mata2 steb f
+
-+
0.4 2 33 (31, 63) (55, 35) 59SY 1 164 mata2 barl ste6
+
+
-
+
0.6 4 45 (51, 69) (72, 39) 71SY 1 176 mata2 ste2 f
-
+
+
1 0.9 52) (35, 44 46) (38, 42 SY 12 12 mata2 stel3-
+
+
+
1 0.9 43 52) (40, (41, 46 45) SY 1256 mata2 - ++
+
+
1 1 (78, 54) 40 46 (32, 48)SY 1 197 mata2 barl
+
+
+
+
1 1 45) (38, 42 43) (32, 37 --
+
0.1 2 32 (28, (72, 35) 78 83)-
B. Response to a factor
Phenotype FUSlIUR.43 Percent unbudded
Strain Genotype a F aF Rec aF aF Rec Basal +aF Basal +aF
SY 1 154 MATa -
+
+
SY 1242 mata2 stel3 ste6 ste3
-
+
-
-
0.3 9 40 (39, (84, 82) 40) 83SY 1234 mata2 stel3 ste3 -
+
+
0.1 8 81) (81, 81 34) (38, 36 SY1228 mata2 stel3 ste6-
+
-+
0.1 5 32 (31, (50, 32) 53) 51 SY 12 12 mata2 stel3 -+
+
+
1 2 43 (41, (45, 57) 45) 51SY 1 180 mata2 ste3 f
+
+
- 1 4 (76, 72) 45 (45, 74 46)SY 1 179 mata2 ste6 f
+
-
+
0.4 2 33 (31, 37 35) (31, 43)SY 1256 mata2
*
+
+
+
1 1 (42, 42) 40 (32, 42 48)SY 1 195 mata2 barl ste3
+
+
+
- 5 5 57 (54, 60) 53 (50, 56)SY 1 184 mata2 barl ste6
+
+
-
+
0.6 0.5 (51, (48, 45 39) 46 44)SYll97 mata2 barl
+
+
+
+
1 1 37 (32, 43) 39 (41, 36) - co.1 10 (32, 31 30) 79 (81, 77)-
Phenotype symbols are as defined for Table 4.
The ratio of FUSl to VRA3 transcript was determined as described in MATERIALS AND METHODS. Values presented are the average of
' T h e percent unbudded cells in a culture was determined with and without pheromone treatment as described in MATERIALS AND two determinations, which were in close agreement.
METHODS. The average of two determinations is presented, followed by the values for each experiment in parentheses.
onstrate that receptor interference contributes to the phenotype of mata2 mutants.
'To investigate more fully the relative contributions of pheromone adaptation and receptor interference to the phenotype of mata2 mutants, we used a com- plete set of isogenic mata2 mutants, each of which is deficient in the ability to produce one or both phero- mones and/or one or both pheromone receptors. T h e response of each strain to added pheromone was assayed, and the results are shown in Figure 3 and Table 5 .
For a mata2 mutant to respond to a factor, the only requirement (other than that it produces the a-factor receptor) is that the strain does not produce a factor:
mata2 steb, mata2 ste2 steb, and m a t a 2 s t e l 3 ste6 strains each responded to added a factor; but mata2, mata2 ste2, and mata2 stel3 strains failed to respond. Even a
mata2 barl ste6 strain, which secretes high levels of a factor and expresses the a-factor receptor (but does not produce a factor) responded to added a factor. This is a surprising finding because a simple expecta- tion would be that the strain has adapted to the a factor it secretes and that adaptation to one phero-
mone should result in adaptation to a heterologous pheromone. T h e ability of the mata2 barl ste6 strain to respond to a factor could indicate that adaptation can be pheromone-specific. For example, perhaps ad- aptation to a factor by mata2 cells requires a greater dose of pheromone than does adaptation to a factor. It is known that adaptation to a factor is dose depend- ent (MOORE 1984), but the dose response relationship
is not predictable in these autocrine situations. A second possibility is that the strain is not adapted even to a factor. Rather, the mata2 barl ste6 strain may not respond appreciably to the a factor it secretes due
to interference by an a-specific product, perhaps the a-factor receptor. Evidence that the a-factor receptor does indeed interfere with response to a factor emerges from our analysis of what is required for a
mata2 mutant to respond to added a factor.
Analysis of the data presented in Figure 3 and Table
5 leads to two generalizations concerning the require- ments for response to a factor. T h e first is that a
472
A
FUSl
URA3
B
a
b
c
d
e
b-6-
-
af
afa
b
c
FUSl
uRA3
genotype
13-
pheromone
-
af af
b-3-
-
af
A. Bender and G . F. Sprague, Jr.
f
g
h
i
j
k
FIGURE 3."FUSl transcript levels in isogenic derivatives of a
mata2 mutant. RNA was isolated
ure 2. (A) The strains used were: SY 1 184 (mala2 barl ste6, lanes a-
c), SY 1195 (mala2 barl ste3, lanes d and e), SY 1228 (mata2 ste6 stel3, lanes f-i), and SY 1242 (mala2 ste6 ste13 ste3, lane j and k). (B) The strains used were:
SY 12 12 (mata2 stel3, lanes a-c),
SY 1 176 (mata2 ste2. lanes d and
6-1
3-
6-13-3'
and analyzed as described for Fig--
af af+af
af-
af
e), SY 1 179 (mala2 ste6, lanes f-
d
ef g
h
i
j
k
1 h), SYI 180 (mala2 ste3, lanes iand j), SY 11 53 (nata2 ste2 ste6,
lanes k and I), and SY 1234 (mata2 ste3 stel3, lanes m and n).
2-
6-
"-
3- 2-6- 3-13-
-
af
-
af
af
-
ing response to a factor. T h e second generalization is that among pairs of isogenic strains differing at the
STE3 locus, response to a factor is more vigorous for the strain that carries the mutant allele of STE3. Two comparisons illustrate the point. (1) A mata2 ste3
mutant (SY 1 180) responded well to added a factor, whereas a mata2 mutant (SY1256) did not. (2) A
mata2 stel3 ste3 strain (SY 1234) responded to a factor much better than did a mata2 stel3 (SY 1212) strain. In each of these pairs, the inability of the STE3 strain to respond to CY factor could once again have two
explanations: the a-factor receptor could interfere with response to a factor or adaptation to a factor could also result in adaptation to a factor.
af
-
af
-
af
T w o other comparisons confirm that inability to show full response to a factor results from interfer- ence by the a-factor receptor, especially when re- sponse is assessed by the ability to arrest in the G1
phase of the cell cycle (Table 5B). (1) A mata2 stel3
ste6 strain (SY 1228) responded to added ct factor
better if it also carried a mutant allele of STE3
(SY 1242). (2) A mata2 ste3 mutant (SY1180) re- sponded more fully to a factor than did a mata2 ste6
strain (SY 1 179). In both these comparisons, the real- ization that removal of STE3 and STE6 functions is
not equivalent, even though both the ste3 and ste6
Mating Specificity in Yeast 473
mone adaptation accounts for the defect in response to a factor. To demonstrate that the incomplete re- sponse to a factor shown by mata2 ste6 cells is not a peculiar feature of the ste6 mutation, we also disrupted a-factor production via a mutation in S T E l 4 , a second gene that is required for a-factor maturation (WILSON and HERSKOWITZ 1987). T h e mata2 stel4 strain be- haved like the mata2 ste6 strain (data not shown).
A final and striking example of the a-factor receptor interfering with response to a factor is the contrast in the behavior of mata2 barl and mata2 barl ste3 mu- tants. mata2 barl mutants were indistinguishable from
mata2 mutants in the level of FUSl transcript de- tected, whereas the mata2 barl ste3 cells expressed
FUSl at a high level, nearly the level seen in wild-type a cells treated with a factor (Table 5, strains SY 1 197, SY1256, and SYll95). In addition, mata2 barl ste3
cells displayed extreme projection formation, reminis- cent of that shown by wild-type cells responding to
pheromone, and had a generation time 50% longer than mata2 cells (data not shown). T h e introduction of a ste3 mutation apparently allowed the mata2 barl
cells to respond more strongly to their own a factor; nonetheless the cells had adapted sufficiently to the a factor to be able to undergo cell division, albeit at a reduced rate.
DISCUSSION
Specificity of mating: To investigate the roles that the known a- and a-specific products play in the mating process, we engineered isogenic strains that express various combinations of the pheromones and pheromone receptors. We had previously shown that the a-factor receptor is the only a-specific product required for response to a factor (BENDER and
SPRAGUE 1986; see also NAKAYAMA, MIYAJIMA and ARAI 1987). In this work, we have shown that the a- factor receptor and a factor are the only a-specific products needed for mating: the expression of STE3
and M F a l allows m a t a l cells to mate with a cells at a normalized mating efficiency of 20%. The mating efficiency is similar to the mating efficiency of mutants defective solely in agglutination (SUZUKI and YANA-
GISHIMA 1985; J. KURJAN and P. LIPKE, personal
communication), implying that the a-agglutinin is the only a-specific function lacking in these matal cells. This interpretation further suggests that any as yet unidentified a-specific products that may exist do not play significant roles in mating.
These findings raise the issue of how mating speci- ficity is achieved. If the agglutinins are not needed for mating, what determines that a cells mate with a
cells but not with other a cells? Why do not two cells that are both responding to pheromone and in contact with each other mate? We imagined that there might exist a- and a-specific products (perhaps the agglutin-
ins) whose role is to prevent mating between cells of the same mating type. We found, however, that a cells can mate with other a cells to a modest extent if one of the mating partners expresses the a set of phero- mone and receptor instead of its normal (a) set. Thus, there are no a-specific products that create an absolute block to mating between a cells. It is interesting to note, however, that the expression of STE3 and M F a l
allows a m a t a l mutant to mate better
(-lox)
than it allows a MATa barl ste2 ste6 strain to mate with an a strain. It is likely that an a-specific product partially inhibits mating with a cells.Further evidence that the pheromones and recep- tors are important determinants of mating specificity comes from work with mata2 mutants, cells that ex- press both the a- and a-specific gene sets. By intro- ducing appropriate mutant alleles of a- and a-specific genes involved in pheromone metabolism and recep- tion, mata2 mutants can be made to mate either as a cells or as a cells. However, the mating efficiency of a cells is about 20-fold less than the mating efficiency of wild-type a cells, again implying that an a-specific product, present by virtue of the mata2 mutation, partially inhibits mating with a cells. We conclude that the species of pheromone and pheromone receptor that a cell makes are primary factors in determining with whom that cell with mate. The a- and a-specific products other than those involved in pheromone production and pheromone response do not preclude mating between cells of the same mating type.
These conclusions imply that the acts of emitting and receiving a pheromone signal establish cues that are essential if the mating process is to proceed effi- ciently. This suggestion is bolstered by the finding that exogenously-supplied pheromone does not fully complement pheromone-deficient mutants (CHAN et
al. 1983; KURJAN 1985; MICHAELIS and HERSKOWITZ 1988). Perhaps the geometry of pheromone presen- tation is important because a very high local concen- tration of pheromone is required for a late step in mating. O r perhaps there is direct cell surface inter- action between mating partners that is mediated by spatially oriented pheromones and receptors.
Phenotype of matar2 mutants: Because mata2 mu- tants express both the a- and a-specific gene sets, their phenotype presents two puzzles. First, an initial ex- pectation is that mata2 mutants would be capable of mating with both a and a cells. Instead, the mutants have a nonmating phenotype. Second, given that