Transactions of the 17th International Conference on Structural Mechanics in Reactor Technology (SMiRT 17)
Prague, Czech Republic, August 17 –22, 2003
Paper # K04-4
Study on Estimation of Basemat Uplift of PWR Reactor Building
Naohiro Nakamura 1), Yasuhiro Kasuga 1), Naoto Yabushita1), Sadatomo Onimaru 1), Akio Nakayama 2), Yousuke Murakami 2), Masahiko Ozaki 2) and Tomio Nakano 3)
1) Takenaka Corporation, Tokyo, Japan 2) Kansai Electric Power Co., Inc., Osaka, Japan 3) NEWJEC Inc., Osaka, Japan
ABSTRACT
In Japanese seismic designs of nuclear power plants, the uplift of the basemat of structures is a very important factor. In current design methods, the seismic behavior of structures is analyzed using lumped mass SR models, and the ground contact ratio is also calculated using these models. However, the shapes of some actual buildings are so complicated that it is more effective to use detailed 3-dimensiional models in order to evaluate the accurate seismic behavior of the structures. In this paper, uplift behavior of a PWR reactor building is analyzed using a 3-dimensional model. The result of the analysis is compared with that obtained using a SR model. It is shown that the uplift behavior estimated using the SR model is greater than that using the 3-dimensional FEM model and that the difference becomes greater with the increase in the input ground motion level.
KEYWORDS: basemat uplift, earthquake response analysis, sway-rocking model, 3D-FEM model, induced vertical
motion, ground contact ratio,
INTRODUCTION
In Japanese seismic designs of nuclear power plants, the uplift of the basemat of structures is a tremendously important factor. In current design methods, a lumped mass sway-rocking model (hereafter SR model) is used for seismic response analyses of structures. The ground contact ratio (minimum ratio of the area of basemat which is not raised from the ground) is also estimated by taking into account the nonlinear characteristics for the rotational soil spring of this model. When the uplift increases to a great degree, it is anticipated that a vertical motion of the reactor building induced by this uplift occurs. The ratio is limited in seismic design for the structures, due to the fact that with an increase in the uplift, the analysis accuracy for the vertical motion of the model decreases[1-3].
The authors have been investigating the seismic behavior of a PWR type nuclear reactor building during strong earthquakes using a 3-dimensional FEM model constructed as accurately as possible [4,5]. In this paper, the uplift characteristics of the SR model are investigated by comparing them with those of the 3-dimensional FEM model during strong earthquakes. The ground contact ratios, horizontal responses and the induced vertical responses are investigated and the cause of the differences are studied. Furthermore, the effects of the simultaneous action of the vertical seismic motion as well as the horizontal seismic motion upon the uplift characteristics are investigated.
ANALYSIS CONDITION
The response of the FEM model is compared to that of the SR model using the example ground motion of extreme design earthquake in order to investigate the uplift characteristics. The analysis models, input ground motion and the analysis cases are shown below.
Analysis Model ( 3 Dimensional FEM Model )
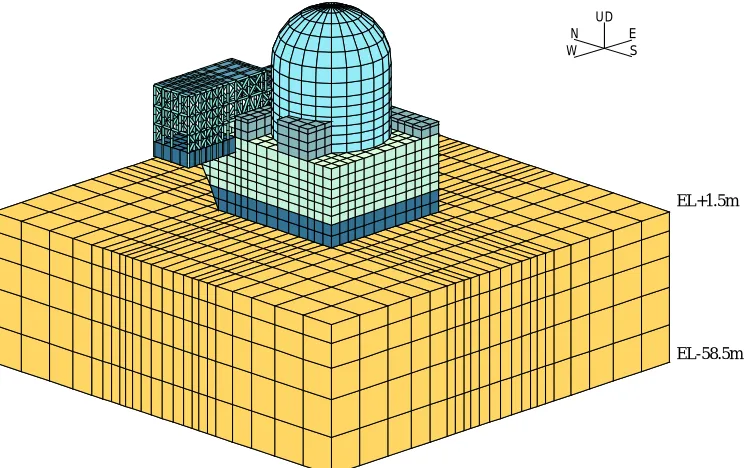
Fig.1 shows the exterior view of the FEM model for the PWR type nuclear reactor building. Fig.2 illustrates the inside of the building model. The building’s walls, steel and columns, and the basemat, are modeled using shell elements, beam elements and solid elements respectively. All of these are linear elements. This model consists of an outer shield building (O/S), a nuclear reactor containment vessel(C/V), a fuel handling building(FH/B), an exterior building(E/B), an inner concrete(I/C) and a new fuel handling building(NF/B). O/S, C/V, I/C and E/B are united on the concrete basemat at the bottom. Since each structure is separated by expansion joints at corridors and walls connecting structures, The nodes for these parts of the model are set as double nodes to separate these structures.
Table 1 Material Property
Concrete Rebar and Steel
Material
Part
Young’s modulus
(MPa)
Poisson’
s ratio Density (kg/m3)
Young’s modulus
(MPa)
Poisson’
s ratio Density (kg/m3)
Basemat 28822 0.1667 2400
O/S 28822 0.1667 2400 205800 0.3 7860
E/B 28822 0.1667 2400 205800 0.3 7860
FH/B 28822 0.1667 2400 205800 0.3 7860
I/C 39974 0.1667 2400 205800 0.3 7860
C/V 190120 0.3 7860
Table 1 shows the material’s constant for each part of the reactor building. The elastic modulus of the concrete except the I/C is set to correspond to the compression strength of the actual building. As for the I/C, the stiffness is regulated to correspond with the frequency of the maximum peak obtained from earthquake observation spectrum data. The damping ratios are set at 3% for the O/S, E/B and I/C, 2% for the FH/B and 1% for the C/V in order to compare with the SR model which is used for the current design. Rayleigh damping is used for the FEM model so that each damping ratio is determined at the horizontal primary natural frequency of 5.2Hz and at the vertical primary natural
Fig.1 Soil and Structure Model of 3 Dimensional FEM Analysis
Z (UD)
Y (NS) X (EW)
FH/B EL55.3m
O/S EL83.9m C/V EL81.1m
I/C EL41.3m
E/B EL32.8m NF/B EL55.3m
Fig.2 Inside of structure model NFH/
B
UD N
S E W
EL+1.5m
EL-58.5m
C/V O/S
I/C
E/B
FH/B 11
10
9
8
7
6
5
4
3
2
1
16
15
14 13 12
20 19 18 17 23
22 21 24 25 26 27 28 29 30 31 32
36 35 34 33 37
41
40
39
38 42 43
EL+16.7 EL+24.5 EL+30.4 EL+36.2 EL+43.4 EL+50.5 EL+56.6 EL+61.2 EL+71.2 EL+78.5 EL+81.2
EL+17.5 EL+21.0 EL+32.8 EL+38.0
EL+24.5 EL+24.5
EL+17.5 EL+20.9 EL+28.5 EL+32.8 EL+37.3 EL+45.3 EL+50.0 EL+56.6 EL+60.7 EL+66.6 EL+72.1 EL+76.8 EL+80.4 EL+82.7 EL+83.5
EL+20.4 EL+24.5 EL+32.8 EL+40.0 EL+47.3 EL+55.3
44 EL+7.08 EL+10.5
EL+1.5
In an analysis, the input ground motion is defined at the ground surface level (EL+1.5m). In the analysis for this model, the input ground motion at EL-58.5m needs to be defined. Therefore, the input ground motion of this level is calculated using the 1 dimensional wave propagation theory. Furthermore, the motion is corrected to assure the expected motion on the ground surface by canceling the effect of internal vibration modes of the soil caused by the viscous boundary.
Analysis Model ( SR Model )
Fig.3 shows the SR model used for the analysis. This model is a multi-axial model with a rigid body basemat . The C/V, I/C, O/S and FH/B are modeled as bending shear rods. The properties of the rods are determined based on the eigenvalue analysis of the 3-dimensional FEM model for each part. The values indicated in Table 1 are used for the material’s constant of each part of the building. Due to the fact that the lower parts of the O/S, E/B and FH/B are thought to behave as one united body, they are connected to each other using rigid springs. Table 2 shows the specifications of the basemat and the soil springs. The rotational soil stiffness is set as the uplift nonlinear spring corresponding to a curve shown in equation (1). The ground contact ratio η is computed using equation (2). The damping of the rotational spring is varied so that the value for the damping reduction ratio could be equivalent to the value for the stiffness reduction ratio. The induced vertical motion is taken into account using the method described in the paper[2].
(1)
(2)
Where M : Overturning moment, M0 : Uplift limit overturning moment (=WL/6), θ : Rotation angle,
θ0 : Uplift limit rotation angle, W : Total weight of the building, L : Foundation breadth of the building (=60.7m), Mmax : Maximum overturning moment obtained from seismic response analysis,
α : coefficient concerning soil reaction, 4.7 for rigid basemat and 6.0 for constant-triangle distribution ( This value is used in this paper)
Input Ground Motion
Fig.4 illustrates the input ground motion applied in this paper. In order to reduce CPU time of FEM analyses, the duration of the motion is minimized to 16 seconds without influence on the maximum response results. A horizontal ground motion is input in an NS direction only.
Analysis Cases
Both an analysis when a horizontal ground motion only is input (hereinafter referred to as NS analysis) and an analysis when horizontal and vertical motions are input simultaneously (hereinafter referred to as NS+UD analysis) are carried out. In order to investigate the varying behavior of the models caused by the input level, the maximum
acceleration of the input ground motion is set as three levels; the original amount, 2 times and 3 times the amount of the ground motion for both the NS and the NS+UD cases. Table 3 shows these analytical cases.
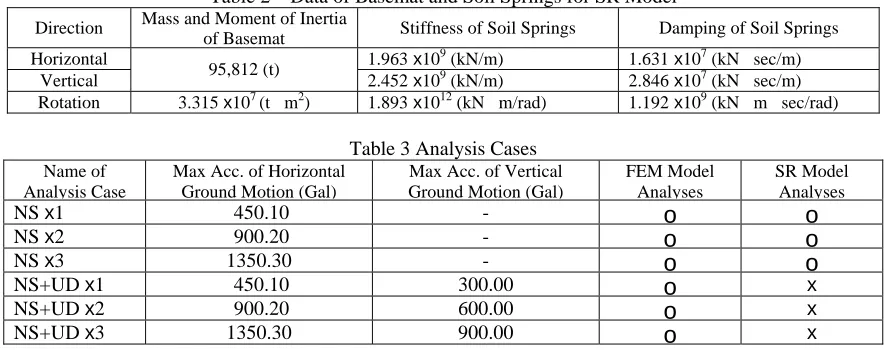
Table 2 Data of Basemat and Soil Springs for SR Model
Direction Mass and Moment of Inertia
of Basemat Stiffness of Soil Springs Damping of Soil Springs Horizontal 1.963 x10⁹ (kN/m) 1.631 x10⁷ (kN sec/m)
Vertical 95,812 (t) 2.452 x10⁹ (kN/m) 2.846 x10⁷ (kN sec/m) Rotation 3.315 x10⁷ (t m2) 1.893 x10¹² (kN m/rad) 1.192 x10⁹ (kN m sec/rad)
Table 3 Analysis Cases Name of
Analysis Case
Max Acc. of Horizontal Ground Motion (Gal)
Max Acc. of Vertical Ground Motion (Gal)
FEM Model Analyses
SR Model Analyses
NS x1 450.10 -
o
o
NS x2 900.20 -
o
o
NS x3 1350.30 -
o
o
NS+UD x1 450.10 300.00
o
xNS+UD x2 900.20 600.00
o
xNS+UD x3 1350.30 900.00
o
x2 2
0
0 2
2 2
−
− −
= α
θ
θ
α
α
M M
) 2
1 ( 2
2 max
WL M
− − =
In the NS cases, the response and the uplift behavior of the FEM model for the horizontal input is compared with those of the SR model. In the NS+UD cases, the analysis is carried out only for the FEM model. Through comparing the results in the NS+UD cases with those in the NS cases, the effects of the vertical input ground motion upon the uplift behavior are investigated.
RESULTS OF ANALYSIS
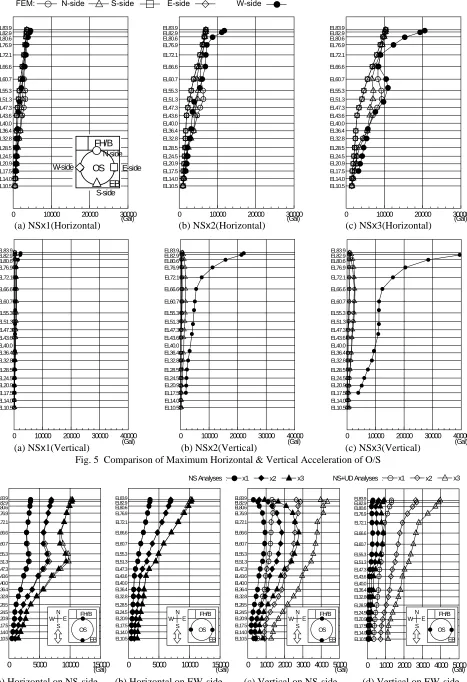
Comparison of Maximum Acceleration
Fig.5 shows the comparison between the maximum horizontal and vertical acceleration of the O/S in the NS cases for both the FEM model and the SR model. The response value of the SR model for the maximum horizontal
acceleration corresponds well to that of the FEM model as a whole. However, with a rise in the input level, the response of the SR model increases. In particular, at the highest part of the building the response value tends to be different from that of the FEM model. The response value of the FEM model for the maximum vertical acceleration increases nearly in proportion to the input level. On the other hand, the response value of the SR model tends to rapidly rise with the increase in the input level. It can be thought that these differences are caused by the uplift due to the linearity of the building.
Fig.6 shows the comparison of the maximum acceleration in the NS cases and the NS+UD cases for the FEM model at the flange sides (NS-side: envelope values of North and South side) and the web sides (EW-side: envelope values of East and West side). It can be seen that the difference in the maximum horizontal acceleration between the two models is small so that the effects of the vertical motion are thought to be slight. The response of the EW-side for the maximum vertical acceleration of the NS cases is thought to be caused by the induced vertical motion. This response is smaller than the response caused by the vertical input motion seen in NS+UD cases.
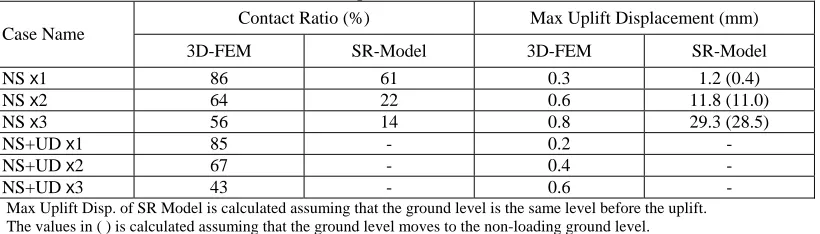
Comparison of Uplift Behavior
Table 4 shows the comparison between the maximum ground contact ratio of the FEM model and the SR model and the maximum relative displacement between the bottom of the basemat and the soil ( hereinafter referred to as uplift displacement ) at the corresponding time. As for the SR model, the ground contact ratio drops and the uplift
displacement increases rapidly with the increase in the input motion. On the other hand, the contact ratio of the FEM model is always larger than that of the SR model. Even when the input level increases, the ground contact ratio of the FEM model gently falls. The uplift displacement of the FEM model is always smaller than that for the SR model.
(c) Response spectrum of Horizontal Motion (d) Response spectrum of Vertical Motion Fig.4 Input Ground Motion
AC
C
EL
ER
AT
IO
N
(G
al
)
PERIOD (sec)
H=0.02 H=0.03 H=0.05
0.02 0.05 0.10 0.20 0.50 1.00 2.00 5.00 0
500 1000 1500 2000
AC
C
EL
ER
AT
IO
N
(G
al
)
PERIOD (sec)
0.02 0.05 0.10 0.20 0.50 1.00 2.00 5.00 0
250 500 750 1000 1250
1500 H=0.02 H=0.03 H=0.05
(a) Time History of Horizontal Ground Motion
AC
C
EL
ER
AT
IO
N
-600 0 600
TIME (sec) 10 15 5
0 1 2 3 4 6 7 8 9 11 12 13 14 16
MAX. -450.10 Gal ( 5.05 sec )
( Gal )
AC
C
EL
ER
AT
IO
N
TIME (sec) 10 15 5
0 1 2 3 4 6 7 8 9 11 12 13 14 16
-400 0
400 MAX. 300.00 Gal (10.06 sec )
( Gal )
(a) NSx1(Vertical) (b) NSx2(Vertical) (c) NSx3(Vertical) Fig. 5 Comparison of Maximum Horizontal & Vertical Acceleration of O/S
(a) Horizontal on NS-side (b) Horizontal on EW-side (c) Vertical on NS-side (d) Vertical on EW-side Fig. 6 Comparison of Maximum Horizontal & Vertical Acceleration of O/S
0 5000 10000 15000
EL83.9 EL76.9 EL82.9 EL80.6 EL72.1 EL66.6 EL60.7 EL55.3 EL51.3 EL47.3 EL43.6 EL40.0 EL36.4 EL32.8 EL28.5 EL24.5 EL20.9 EL17.5 EL14.0 EL10.5
0 5000 10000 15000
EL83.9 EL76.9 EL82.9 EL80.6 EL72.1 EL66.6 EL60.7 EL55.3 EL51.3 EL47.3 EL43.6 EL40.0 EL36.4 EL32.8 EL28.5 EL24.5 EL20.9 EL17.5 EL14.0 EL10.5
0 1000 2000 3000 4000 5000
EL83.9 EL76.9 EL82.9 EL80.6 EL72.1 EL66.6 EL60.7 EL55.3 EL51.3 EL47.3 EL43.6 EL40.0 EL36.4 EL32.8 EL28.5 EL24.5 EL20.9 EL17.5 EL14.0 EL10.5
0 1000 2000 3000 4000 5000
EL83.9 EL76.9 EL82.9 EL80.6 EL72.1 EL66.6 EL60.7 EL55.3 EL51.3 EL47.3 EL43.6 EL40.0 EL36.4 EL32.8 EL28.5 EL24.5 EL20.9 EL17.5 EL14.0 EL10.5
x1 x2 x3 x1 x2 x3
NS Analyses : NS+UD Analyses :
FH/B
OS EB N
S
W E FH/B
OS EB N
S
W E FH/B
OS EB N S W E FH/B OS EB N S W E (Gal) (Gal)
(Gal) (Gal)
(a) NSx1(Horizontal) (b) NSx2(Horizontal) (c) NSx3(Horizontal)
FEM: N-side S-side E-side W-side
0 10000 20000 30000 40000
EL83.9 EL76.9 EL82.9 EL80.6 EL72.1 EL66.6 EL60.7 EL55.3 EL51.3 EL47.3 EL43.6 EL40.0 EL36.4 EL32.8 EL28.5 EL24.5 EL20.9 EL17.5 EL14.0 EL10.5
0 10000 20000 30000 40000
EL83.9 EL76.9 EL82.9 EL80.6 EL72.1 EL66.6 EL60.7 EL55.3 EL51.3 EL47.3 EL43.6 EL40.0 EL36.4 EL32.8 EL28.5 EL24.5 EL20.9 EL17.5 EL14.0 EL10.5
0 10000 20000 30000 40000
EL83.9 EL76.9 EL82.9 EL80.6 EL72.1 EL66.6 EL60.7 EL55.3 EL51.3 EL47.3 EL43.6 EL40.0 EL36.4 EL32.8 EL28.5 EL24.5 EL20.9 EL17.5 EL14.0 EL10.5
0 10000 20000 30000
EL83.9 EL76.9 EL82.9 EL80.6 EL72.1 EL66.6 EL60.7 EL55.3 EL51.3 EL47.3 EL43.6 EL40.0 EL36.4 EL32.8 EL28.5 EL24.5 EL20.9 EL17.5 EL14.0 EL10.5
0 10000 20000 30000
EL83.9 EL76.9 EL82.9 EL80.6 EL72.1 EL66.6 EL60.7 EL55.3 EL51.3 EL47.3 EL43.6 EL40.0 EL36.4 EL32.8 EL28.5 EL24.5 EL20.9 EL17.5 EL14.0 EL10.5
0 10000 20000 30000
EL83.9 EL76.9 EL82.9 EL80.6 EL72.1 EL66.6 EL60.7 EL55.3 EL51.3 EL47.3 EL43.6 EL40.0 EL36.4 EL32.8 EL28.5 EL24.5 EL20.9 EL17.5 EL14.0 EL10.5 FH/B OS EB
W-side E-side
浮き上がり箇所 最大浮き上がり箇所
最大浮き上がり量0.563mm ( 9.26 sec ) 接地率64% 最大浮き上がり量0.811mm ( 9.25 sec ) 接地率56%
最大浮き上がり量0.179mm ( 8.87 sec ) 接地率85% 最大浮き上がり量0.446mm ( 8.86 sec ) 接地率67% 最大浮き上がり量0.567mm ( 4.09 sec ) 接地率43%
N
S E
W Excitation
最大浮き上がり量0.283mm ( 3.95 sec )接地率86%
(d) NS+UDx1 (e) NS+UDx2 (f) NS+UDx3
Fig. 7 Uplift Behavior of FEM Model
Uplift area of SR model
Contact Ratio = 61% (3.93sec)
Contact Ratio =86% (3.95sec), Max Disp=0.3mm Contact Ratio =64% (9.26sec), Max Disp=0.6mm Contact Ratio =56% (9.25sec), Max Disp=0.8mm
(a) NSx1 (b) NSx2 (c) NSx3
Contact Ratio =85% (8.87sec), Max Disp=0.2mm Contact Ratio =67% (8.86sec), Max Disp=0.4mm Contact Ratio =43% (4.09sec), Max Disp=0.6mm Uplift area of SR model
Contact Ratio = 22% (3.95sec)
Uplift area of SR model
Contact Ratio = 14% (8.70sec)
Ο:Uplifted Nodes, :Node of Maximum Uplift Disp.
0 2 4 6 8 10 12 14 16
100 0
0 50 50
0 2 4 6 8 10 12 14 16
100 0
0 50 50
0 2 4 6 8 10 12 14 16
100 0
0 50 50
(c) 3D-FEM ( NSx2, NS+UDx2) (d) SR Model ( NSx2 )
North
South
C
o
ntact R
a
ti
o(
%)
(a) 3D-FEM ( NSx1, NS+UDx1) (b) SR Model ( NSx1 )
North
South
C
ontact R
a
ti
o(
%)
(sec) (sec)
(sec) (sec)
100 50 0
0 2 4 6 8 10 12 14 16
0 50 100
100 50 0
0 2 4 6 8 10 12 14 16
0 50 100
100 50 0
0 2 4 6 8 10 12 14 16
0 50 100 North
South
Co
n
ta
c
t Ra
tio
(%)
North
South
C
o
ntact R
a
ti
o(
%)
North
South
C
ontact R
a
ti
o(
%)
North
South
Co
n
ta
c
t Ra
tio
(%)
Ο : Uplifted Nodes
(a) NSx1 (3.93sec) (b) NSx2 (3.95sec) (c) NSx3 (8.70sec)
(a) NSx1 (3.95sec) (b) NS+UDx1 (8.87sec)
(c) NSx2 (9.26sec) (d) NS+UDx2 (8.86sec)
(e) NSx3 (9.25sec) (f) NS+UDx3 (4.09sec)
Fig.9 Basemat Deformation of FEM Model ( Time of Minimum Ground Contact Ratio )
South North
10mm
10mm Disp. Scale
1.2mm 0.8mm
GL 11.8mm
2.1mm
29.3mm
GL
3.9mm
Center Line
East End Line Uplift Disp. 0.283mm
Uplift Disp.0.183mm
Center Line
East End Line Uplift Disp. 0.422mm
Uplift Disp. 0.563mm
Uplift Disp. 0.811mm
Uplift Disp. 0.563mm
Center Line
East End Line
Center Line
East End Line Uplift Disp. 0.175mm
Uplift Disp. 0.129mm
Uplift Disp.0.446mm
Uplift Disp.0.268mm Center Line
East End Line
Center Line
East End Line
Uplift Disp. 0.567mm
Uplift Disp. 0.341mm South North
Up
Down Cent
er Line
East
End Line
North
Table 4 Comparison of Contact Ratio
Contact Ratio (%) Max Uplift Displacement (mm) Case Name
3D-FEM SR-Model 3D-FEM SR-Model
NS x1 86 61 0.3 1.2 (0.4)
NS x2 64 22 0.6 11.8 (11.0)
NS x3 56 14 0.8 29.3 (28.5)
NS+UD x1 85 - 0.2 -
NS+UD x2 67 - 0.4 -
NS+UD x3 43 - 0.6 -
Max Uplift Disp. of SR Model is calculated assuming that the ground level is the same level before the uplift. The values in ( ) is calculated assuming that the ground level moves to the non-loading ground level.
Fig.7 illustrates the distribution of the uplift behavior of the FEM model both in the NS cases and in the NS+UD cases. In the SR cases, the distribution of the uplift behavior of the SR model is also indicated. The value for the ground contact ratio of the SR model is smaller than the value of the FEM model. Fig.8 shows the time history of the ground contact ratio for the FEM model and the SR model. The value of the ground contact ratio for the FEM model is larger than that for the SR model at almost all times. Compared with the result from the FEM model in the NS and NS+UD cases (x1 and x2), the difference between both models is slight on the whole. It can be said from this that the vertical ground motion exerts little effect upon the uplift behavior. However, the uplift direction in the NSx3 case is opposite to that in the NS+UDx3 case and the contact ratio in the US+UDx3 case is smaller. It can be thought that this is so due to the effects of the large value of the vertical input motion which is near 1.0G.
Fig.9 and Fig.10 show the comparison of deformation when the minimum contact ratio occurs. Both the soil and the basemat for the FEM model deform to a great degree. It is clear that the deformation behavior of the FEM model differs from that of the SR model and this is thought to be the principal reason of the difference of the response characteristics between these models. Furthermore, the deformation behavior of the FEM model in the NS cases is nearly equivalent to that in the NS+UD cases.
CONCLUSION
Compared with a 3-dimensional FEM model evaluating soil and a building in detail, the uplift behavior of an SR model can be described as follows:
1) The ground contact ratio of the SR model is evaluated smaller and has a tendency to rapidly decrease with the increase in the input ground motion. It is deduced that this is so because the SR model cannot evaluate the flexibility of the basemat and the dynamic behavior of the soil.
2) The induced vertical motion of the SR model is evaluated greater. The motion of the FEM model tends to increase in parallel to the input level, but that of the SR model shows a tendency to rapidly rise with the increase in the input level. It is thought that this is also caused by the aforementioned reason.
3) The effects of the basemat uplift upon the horizontal response acceleration are slight. The SR model can evaluate the uplift behavior with fairly good accuracy.
Furthermore, the following can be described by comparing the result obtained from the horizontal input and that from the simultaneous horizontal and vertical input.
1) The vertical ground motion has little effect on the uplift behavior. However, in cases where the input level of the vertical motion reaches near 1G, some effects occur.
2) Even in the case of the uplift of the basemat being taken into account, the effects of the vertical ground motion upon the horizontal response are slight.
REFERENCES
1. Japan Electric Association, Technical Guidness for Aseismic Design of Nuclear Power Plants- Supplement, JEAG4601-1991, 1991, pp.131-136 (In Japanese)
2. Tanaka, H., Maeda, I., Moriyama, K. and Watanabe, S., Study on Horizontal - Vertical SR Model for Basemat Uplift (Part-1:Formulation of non-linear characteristics of soil spring), 13th SMiRT, pp.43-48, 1995
3. Momma, T., Shirahama, K., Suzuki, K. and Ogihara, M., Study on Horizontal - Vertical SR Model for Basemat Uplift (Part-2:Non-linear response analysis and validation), 13th SMiRT, pp.49-54, 1995
4. Kasuga, Y., Kambayashi, A., Onimaru, S., Nanba, H., Kitano, T., Fushimi, M., Katayama, S. and Tsunashima, N., "Nonlinear seismic response of a PWR-type reactor building simulated by a 3-D FEM model",12th WCEE, Paper No.1091, 2000.