Forestry & Natural-Resource Sciences Last Correction: Sep. 3, 2013
QUANTITATIVE METRICS FOR ASSESSING PREDICTED
CLIMATE CHANGE PRESSURE ON NORTH AMERICAN TREE
SPECIES
Kevin M Potter
1, William W Hargrove
21
Department of Forestry and Environmental Resources, North Carolina State University, Research Triangle Park, NC, USA
2USDA Forest Service, Southern Research Station, Asheville, NC, USA
Abstract. Changing climate may pose a threat to forest tree species, forcing three potential
population-level responses: toleration/adaptation, movement to suitable environmental conditions, or local extirpation. Assessments that prioritize and classify tree species for management and conservation activities in the face of climate change will need to incorporate estimates of the risk posed by climate change to each species. To assist in such assessments, we developed a set of four quantitative metrics of potential climate change pressure on forest tree species: (1) percent change in suitable area, (2) range stability over time, (3) range shift pressure, and (4) current realized niche occupancy. All four metrics are derived from climate change environmental suitability maps generated using the Multivariate Spatio-Temporal Clustering (MSTC) technique, which combines aspects of traditional geographical information systems and statistical clustering techniques. As part of the Forecasts of Climate-Associated Shifts in Tree Species (ForeCASTS) project, we calculated the predicted climate change pressure statistics for North American tree species using occurrence data from the USDA Forest Service Forest Inventory and Analysis (FIA) program. Of 172 modeled tree species, all but two were projected to decline in suitable area in the future under the Hadley B1 Global Circulation Model/scenario combination. Eastern species under Hadley B1 were predicted to experience a greater decline in suitable area and less range stability than western species, although predicted range shift did not differ between the regions. Eastern species were more likely than western species, on average, to be habitat generalists. Along with the consideration of important species life-history traits and of threats other than climate change, the metrics described here should be valuable for efforts to determine which species to target for monitoring efforts and conservation actions.
Keywords: climate change; range shift pressure; risk assessment; multivariate clustering; human-assisted migration; niche occupancy; forest health monitoring; conservation.
1
Introduction
The forests of the United States are expected to expe-rience extensive ecological, social and economic effects as a result of climate change (Malmsheimer et al., 2008). Specifically, forest ecosystem functions and attributes are likely to be altered as a result of climatic changes (Stenseth et al., 2002) that are forecast to include an increase in mean surface temperatures of 2 ◦C to 4.5
◦C, longer growing seasons, and changes in temporal
and spatial precipitation patterns (International Panel on Climate Change, 2007). Climate change is likely to pose a severe threat to the viability of forest tree species themselves, which will be forced either to adapt to new
conditions or to shift their ranges to more favorable environments. Evidence suggests that tree species are currently exhibiting changes in distribution and phenol-ogy in response to climate change (Parmesan and Yohe, 2003; Root et al., 2003; Woodall et al., 2009; Zhu et al., 2012). As species move poleward or upslope in the face of climate change, some species will likely disappear or be restricted to isolated refugia, while others may ex-pand greatly (Iverson and McKenzie, 2013). Biologists have expressed concerns that species may be extirpated as their access to suitable habitat decreases (Thomas et al., 2004). The growth and survival of forest tree species will depend on the maintenance of suitable habi-tats and on the availability of genotypes for
tion of those habitats (Rehfeldt, 1999). Managers and decision-makers will need tools to assess the potential impacts of climate change on the broad diversity of for-est tree species across North America and elsewhere.
As environmental changes push the habitat of plant species out of their climatic tolerance limits, species may respond by adapting to the new conditions, by shifting via migration to suitable environmental conditions, or by becoming locally extirpated (Davis et al., 2005). Adap-tation via natural selection may be unlikely for forest tree species in many cases, given their long generation times (Rehfeldt et al., 1999; St. Clair and Howe, 2007), although some tree species may be able to evolve quickly in the face of new environmental conditions (Petit et al., 2004). Much innovative work has predicted the future distribution of habitat suitability for forest tree species under climate change (Iverson et al., 2004a, 2004b, 2008; Matthews et al., 2011; Rehfeldt et al., 2006; Schwartz et al., 2006), although the results of such efforts typically do not account for whether tree species can span, with-out human assistance, the distances expected between locations with suitable conditions currently and those with suitable conditions in the future. Indeed, many tree species successfully migrated long distances follow-ing the most recent cold period of the Pleistocene, but there is concern that these same species may not be able to match the much more rapid climate shifts expected in the near future (Davis and Shaw, 2001).
Areas within the distributions of forest tree species are likely to experience different degrees of climate change pressure. For example, the paleorecord suggests that populations at the trailing edge of a species’ shifting distribution were often extirpated, resulting in a lati-tudinal displacement of range rather than a simple ex-pansion into newly favorable region (Davis and Shaw, 2001). Already, a disproportionate number of popula-tion extincpopula-tions have been documented along southern and low-elevation range edges in response to recent cli-mate warming, resulting in contraction of species’ ranges at these warm boundaries (Parmesan, 2006). At the same time, these trailing edge populations appear to have played a key role for the maintenance of biodi-versity through the Quaternary, and Hampe and Petit (2005) argue that rear-edge populations are dispropor-tionately important for the long-term conservation of genetic diversity, phylogenetic history and evolutionary potential of species.
Assessments that prioritize and classify tree species for management and conservation activities in the face of climate change (e.g., Aubry et al., 2011; Devine et al., 2012; Matthews et al., 2011) need to incorporate es-timates of the risk climate change poses to each species. To assist in such assessments, we developed a set of four quantitative metrics of predicted climate change
pressure on forest tree species: (1) percent change in suitable area, (2) range stability over time, (3) range shift pressure, and (4) current realized niche occupancy. All four metrics are derived from climate change envi-ronmental suitability maps generated using the Multi-variate Spatio-Temporal Clustering (MSTC) technique (Hargrove and Hoffman, 2005). Combining aspects of traditional geographical information systems (GIS) and statistical clustering techniques, MSTC can be used to statistically predict environmental niche envelopes to forecast a species’ potential geographic range under al-tered environmental conditions such as those expected under climate change (Hargrove and Hoffman 2003). Global in scope, it incorporates 16 spatial climate, soils, and geomorphology variables, and generates maps at a resolution of 4 km2. The advantages of the MSTC technique include its capacity to easily generate climate change environmental suitability maps for a large num-ber of species, its relatively high-resolution results appli-cable at the population level, and its ability to predict suitable habitat globally (for species potentially moving from Mexico to the United States, for example, or from the United States to Canada).
As a part of the Forecasts of Climate-Associated Shifts in Tree Species (ForeCASTS) project (Potter et al., 2010), we calculated the climate change pressure met-rics for 172 North American tree species using occur-rence data from the USDA Forest Service Forest Inven-tory and Analysis (FIA) program as training occurrence locations. FIA data are an unparalleled source of tree location information in the United States because the FIA program maintains a national network of approxi-mately 125,000 fixed-area forested plots from which tree inventory data are collected in a consistent manner and on a regular basis (Woudenberg et al., 2010). Because of the large number of plots and because each plot rep-resents a little more than 2,400 ha of forest (Bechtold and Patterson, 2005), the FIA data reliably represent the general extent of common tree species.
2
Materials and Methods
To select climate change training data for each of our study species, we used coarsely georeferenced species occurrence data available from the USDA Forest Service Forest Inventory and Analysis (FIA) program (Woudenberg et al., 2010), available at http://www.fia.fs.fed.us/tools-data/. The FIA program is the primary source of information about the extent, condition, status, and trends of forest resources across all ownerships in the United States (Smith, 2002). FIA applies a nationally consistent sampling protocol using a quasi-systematic design to conduct a multi-phase inven-tory of all forested land ownerships; the national sam-ple intensity is approximately one plot per 2,428 ha of land (Bechtold and Patterson, 2005). It maintains a system of approximately 125,000 fixed-area (each ap-proximately 0.067 hectares) inventory plots on accessible forested land across the 48 conterminous United States and southeastern Alaska; field crews collect data on more than 300 variables, including forest type, tree species, tree size and tree condition (Smith, 2002; Woudenberg et al., 2010). The plots consist of four, 7.2-m fixed-radius subplots spaced 36.6 m apart in a triangular arrange-ment with one subplot in the center (Woudenberg et al., 2010). All trees with a diameter at breast height (dbh) of at least 12.7 cm are inventoried on forested subplots. The FIA system is designed so that field crews revisit plots in the eastern United States every five years, with 20 percent of all plots remeasured every year on a 5-year rotating basis. In the western United States, 10 percent of plots are remeasured every year on a 10-year rotat-ing basis. Initial annual inventory plots were established between 1999 and 2005. All inventory data are publicly available. By law, the exact coordinates of FIA plots are slightly altered to protect the privacy of forest landown-ers, with most of the adjusted coordinates located within 0.8 km (0.5 miles) and all within 1.61 km (1 mile) of the actual plot coordinates. Additionally, some private plot coordinates may be “swapped” with those of an-other private plot within the same county with similar attributes, such as forest type, stand-size class, latitude and longitude (Woudenberg et al., 2010). Obscuring the original plot coordinates should have little effect on the results of this study given the resolution of the analysis and measures undertaken to avoid overtraining the data.
In some cases, we combined multiple FIA species codes into a single species group when doing so was taxo-nomically justified (e.g., combining all hawthorn species, which are difficult to differentiate even by experts, into a single “Crataegus spp.” category). We excluded species which occurred on fewer than 10 FIA plots, to ensure adequate sampling. We wanted to include only plots where a given tree species has been able to attain repro-ductive maturity, so an FIA plot was used as a train-ing occurrence location for a large tree species if it
con-tained at least one tree greater than 25.4 cm dbh or 9.14 m in height (class 1), and for a smaller tree species if it contained a tree at least 12.7 cm dbh or 6.1 m in height (class 2). For the smallest tree species, includ-ing those that often occur in a shrubby form, such as Prunus americana andQuercus gambelii, plots were in-cluded if they contained an individual at least 6.35 cm dbh or 3.048 m in height (class 3). The same was true for American chestnut (Castanea dentata), a species that has been decimated by an exotic fungal disease caused by Cryphonectria parisitica (Loo, 2009; Russell, 1987), and which continues to exist in upland hardwood forests of the eastern United States in the form of sprouts from blight-killed trees (Stephenson et al., 1991). Each of the 172 species was classified as western or eastern, with eastern species subdivided into northern, southern and general species, as in Woodall et al. (2009).
2.2 Predictions of future habitat suitability
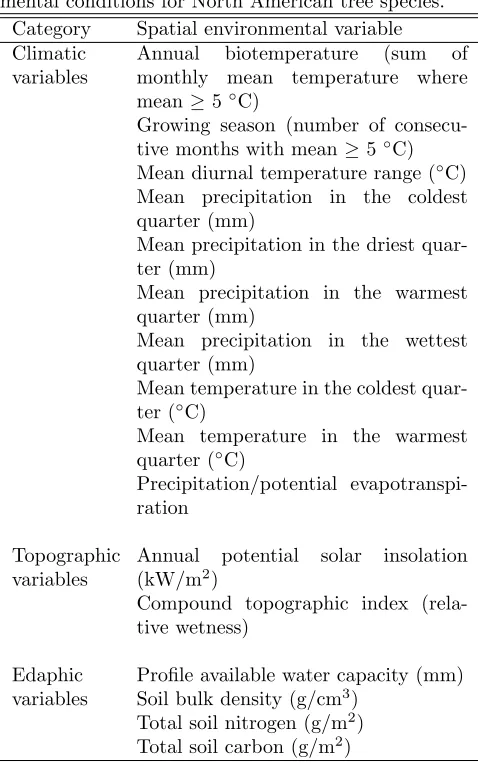
Global in scope, this MSTC analysis incorporates 16 spatial bioclimatic, topographic, and edaphic environ-mental variables (Tab. 1) and generates maps using geo-referenced occurrence information as training data for a given species (Potter and Hargrove, 2012). These vari-ables were used because they play an important role in determining the geographic distribution of plants across large areas (Lugo et al., 1999; Neilson, 1995; Prentice et al., 1992). Climatic data were custom downscaled from Hijmans et al. (2005), topographic variables were cus-tom downscaled from Moore et al. (1991), and edaphic data were custom downscaled from the Global Soil Data Task Group (2000). Saxon et al. (2005) and Baker et al. (2010) provide additional details about the variables used in the MSTC analysis, including how they were downscaled. Using the MSTC approach, it is possible to assign a different weight to each of the 16 environmental variables, but we gave them all equal weight to allow for a rapid assessment of climate change pressure across the 172 species and to maintain consistency across the species.
Because MSTC can track the same clustered combi-nation of environmental conditions at any location or date using future climatic forecasts, it has been ap-plied to identify potential climatic refugia predicted by global shifts in environmental conditions (Baker et al., 2010; Saxon et al., 2005), to determine quantitative zones for seed transfer that take climate change into account (Potter and Hargrove, 2012), and to statisti-cally model environmental niche envelopes to forecast suitable habitat conditions for species under altered en-vironmental conditions such as expected under global climate change (Hargrove and Hoffman, 2005; Potter et al., 2010). In such situations, future climate projections are used, while edaphic and topographic data are held constant over time. MSTC is an appropriate tool for the assessment of the potential genetic effects of climate change on forest tree species because it is able to rapidly predict changes in suitable habitat for a large number of species, it allows for flexible occurrence data inputs, it generates relatively high-resolution results applicable at the population level, it has the ability to predict suitable habitat beyond the borders of the United States, and it incorporates pertinent environmental variables asso-ciated with plant distributions (Potter et al., 2010).
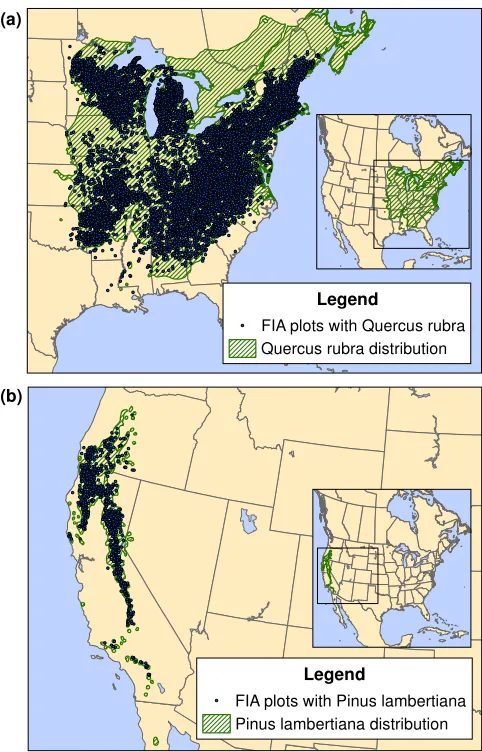
Using FIA plot training occurrence data (Fig. 1), we have produced maps that predict the location and suitability of current and future environmental conditions for North American tree species using the MSTC technique (Fig. 2). We generated these maps and associated climate change pressure metrics for the ForeCASTS project (Potter et al., 2010), which aims to assess how changing climate con-ditions could affect the genetic integrity of forest
Table 1: The Multivariate Spatio-Temporal Clustering technique employed 16 spatial environmental variables, collected at a resolution of 4 km2, to define the 30,000 quantitative global ecoregions used to predict the loca-tion and quality of current and future suitable environ-mental conditions for North American tree species.
Category Spatial environmental variable Climatic
variables
Annual biotemperature (sum of
monthly mean temperature where mean≥5◦C)
Growing season (number of consecu-tive months with mean≥5◦C) Mean diurnal temperature range (◦C)
Mean precipitation in the coldest quarter (mm)
Mean precipitation in the driest quar-ter (mm)
Mean precipitation in the warmest quarter (mm)
Mean precipitation in the wettest quarter (mm)
Mean temperature in the coldest quar-ter (◦C)
Mean temperature in the warmest quarter (◦C)
Precipitation/potential evapotranspi-ration
Topographic variables
Annual potential solar insolation (kW/m2)
Compound topographic index (rela-tive wetness)
Edaphic Profile available water capacity (mm) variables Soil bulk density (g/cm3)
Total soil nitrogen (g/m2) Total soil carbon (g/m2)
Legend
FIA plots with Quercus rubra Quercus rubra distribution
Legend
FIA plots with Pinus lambertiana Pinus lambertiana distribution
(a)
(b)
Figure 1: Forest Inventory and Analysis (FIA) plots used as Multivariate Spatio-Temporal Clustering occur-rence data for (a) northern red oak (Quercus rubra) and (b) sugar pine (Pinus lambertiana). The plot locations are approximate. Species distributions are digitized ver-sions of E.L. Little’s range maps (Little, 1971; United States Geological Survey, 1999).
(Crookston, 2013; Prasad et al., 2013) are included along with the ForeCASTS climate suitability maps.
To avoid overtraining the results because of relative differences in local species abundance, we selected ecore-gions in the current-time suitable environmental con-ditions map based on the geographic distribution and commonness of the species. For very common species, an ecoregion was included as suitable when it inter-sected with four FIA plots containing that species. For less common species, the threshold was three occur-rence plots per ecoregion, while it was two occuroccur-rence plots for uncommon species and one occurrence plot
Figure 2: Multivariate Spatio-Temporal Clustering re-sults for northern red oak (Quercus rubra), (a)Q. rubra predicted environmental suitability comparison for cur-rent conditions and for 2050 under the Hadley global cir-culation model, B1 emissions scenario, and (b)Q. rubra distance to nearest future suitable conditions under the Hadley B1 model-scenario combination.
for the rarest species. Species commonness was deter-mined by the number of ecoregions that intersect with two FIA occurrence plots containing that species; very common species encompassed 343 or more unique ecore-gions, common species encompassed 49 or more and less than 343 unique ecoregions, uncommon species encom-passed seven or more and less than 49 ecoregions, and rare species encompassed fewer than seven ecoregions. These training occurrence thresholds were determined by a simple first-order exponential function.
cen-troids of two ecoregion clusters, this ecoregion similarity is displayed on the maps as a grayscale ramp. Darker shades are given to cells belonging to ecoregions more similar to any of those that intersect with the training occurrence plots in current time, while lighter shades are given to those belonging to less similar ecoregions.
The MSTC approach assumes that trees are optimally adapted to the environmental conditions existing at their training data locations. This generally holds true for forest tree species (Johnson et al., 2004), although ex-ceptions also exist (Mangold and Libby, 1978; Wu and Ying, 2004). It is also important to note that, with some GCM/emissions scenario combinations, the set of environmental conditions equivalent to those present in an ecoregion in current time may not exist (Fitzpatrick and Hargrove, 2009). If this happens, MSTC will not be able to predict equivalent locations for that current ecoregion on the future projection maps (Hargrove and Hoffman, 2003, 2005). However, these maps may depict future locations with environmental conditions that are similar to the original current-time ecoregion.
2.3 Metrics of projected climate change pres-sure We used the MSTC mapped results to calculate, for each of the 172 tree species, four metrics of projected climate change pressure (percent change in range area over time, percent range stability over time, range shift pressure, and current realized niche occupancy). We used PROC GLM in SAS 9.2 (SAS Institute Inc., 2008) to assess whether the means of the metrics were signifi-cantly different by region and subregion, using a Tukey-Kramer test because of group size differences. We con-ducted a Wilcoxon signed rank test in PROC UNIVARI-ATE to assess to determine whether percent change in suitable habitat area over time was significantly differ-ent than 0 within each group of species (all species, re-gions, and subregions). We also used PROC CORR in SAS 9.2 to test for correlations between each pair of metrics, across the entire set of species and within re-gions. We calculated nonparametric Spearman correla-tions, because the variables were not typically normally distributed, and outliers were present in several cases. Pearson correlations are not likely to be robust in the presence of non-normality (Kowalski, 1972).
2.3.1 Percent change in suitable area This mea-sure of change over time in environmentally suitable area was determined by comparing, for each species, the per-cent change in area with suitable environmental con-ditions over time from current concon-ditions to those pro-jected in 2050 under the Hadley B1 GCM/emissions sce-nario combination.
2.3.2 Range stability over time This measure of range stability over time was determined by calculat-ing, for each species, the percent of currently suitable area that remains suitable over time under conditions projected in 2050 in the Hadley B1 GCM/emissions sce-nario combination.
2.3.3 Range shift pressure The projected mean shift distance in suitable habitat, or “Minimum Required Movement” (MRM) distance, was determined by cal-culating the mean non-zero straight-line distance (mea-sured in grid cells) from each currently suitable 4 km2 raster cell expected to become unsuitable to the nearest expected suitable habitat cell in 2050 under the Hadley B1 GCM/emissions scenario combination.
2.3.4 Current realized niche occupancy The breadth of niches occupied by a species is a strong pre-dictor of extinction risk, with species having narrow niches in general being at greater risk (Brook et al., 2008; Stork et al., 2009). Since the MSTC-derived ecoregions are quantitatively defined and have fixed environmental variability, and since FIA data are sampled in a con-sistent and systematic fashion (Bechtold and Patterson, 2005), we used the two in combination to generate a met-ric of current realized niche occupancy. It is calculated as the number of unique MSTC ecoregions that inter-sect with two or more FIA occurrence plots containing a given species.
3
Results
only one GCM/emissions scenario combination and from one time step, because our emphasis is to describe and illustrate metrics of climate change pressure rather than to present a range of potential climate change effects.
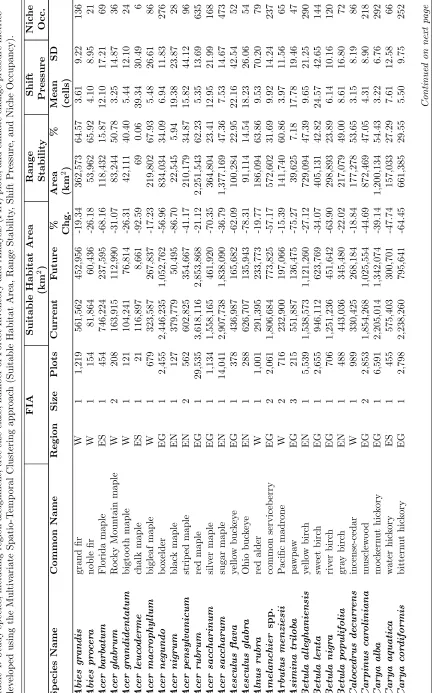
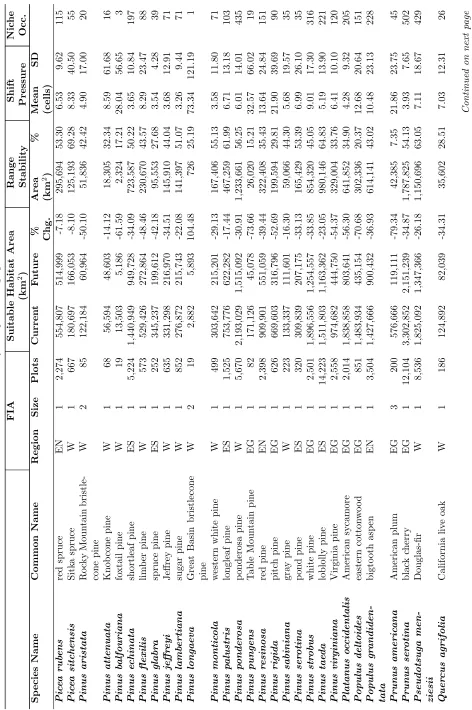
3.2 Percent range stability over time As with percent change in suitable habitat over time, the percent of currently suitable habitat expected to remain suit-able was higher, on average, for western species (47.58 %) than eastern species (33.66%) (Tab. 2), a difference that was statistically significant. Range stability was projected to be greater for southern and generally dis-tributed species in the East than for northern species, but these differences were not significant. Nationally, mean species range stability was 36.90%. Range stabil-ity values ranged from 0 percent in September elm and less than 2% in chalk maple, Delta post oak, and Ken-tucky coffeetree (Gymnocladus dioicus), to 67.93 percent in loblolly bay (Gordonia lasianthus), 67.9% in bigleaf maple (Acer macrophyllum), 69.28% in Sitka spruce (Picea sitchensis), and 84.82% in dwarf live oak (Ap-pendix A, Tab. 4).
3.3 Range shift pressure Mean minimum required movement (MRM) distance, a measure of range shift pressure, was projected to be somewhat greater for species in the East than in the West (12.62 map cells compared to 8.97 map cells), although the difference in these means was not significant. The variation across species was slightly greater in the West (Tab. 2). In the East, northern species were expected to have the greatest shift pressure, and generally distributed species to have the least, with southern species intermediate be-tween the two. Again, however, none of these differences was significant. Across all species, the mean shift pres-sure was 11.77 map cells. Expected range shift prespres-sure was the greatest for September elm (94.78 map cells), Great Basin bristlecone pine (73.34 map cells) and Ken-tucky coffeetree (61.28 map cells), and least for winged elm (Ulmus alata), post oak (Quercus stellata), cher-rybark oak (Quercus pagoda), and western larch (Larix occidentalis), all with a mean range shift pressure of ap-proximately 3 map cells or fewer (Appendix A, Tab. 4).
3.4 Current realized niche occupancy Mean re-alized niche occupancy in current time was greater for eastern species than for western species (149.38 unique ecoregions compared to 85.10, with the means being sig-nificantly different) (Tab. 2). This suggests that eastern species are more likely than western species, on average, to be habitat generalists. Not surprisingly, generally dis-tributed eastern species intersected with more unique ecoregions than either northern or southern species, with means significantly different among the subregions.
Southern species had a smaller mean realized niche oc-cupancy than northern species, but the difference was not significant. The mean across all species nationally was 134 unique ecoregions. The range across species was as low as 1 for Great Basin bristlecone pine and 2 each in Delta post oak and September elm, and as high as 502 for black cherry (Prunus serotina), 518 for green ash (Prunus pennsylvanica), 522 for American elm ( Ul-mus americana), and 635 for red maple (Acer rubrum) (Appendix A, Tab. 4).
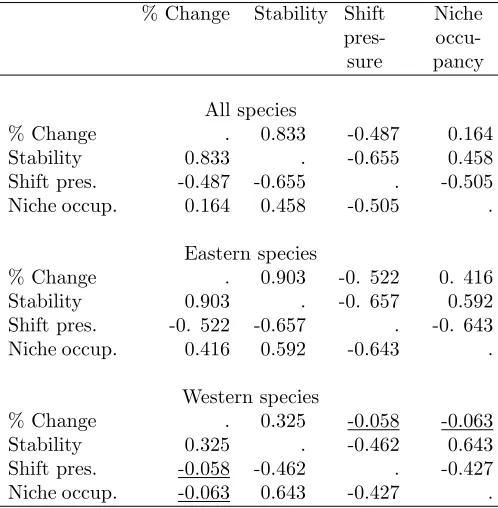
3.5 Relationship among metrics Nationally, all pairs of metrics were significantly correlated (Tab. 3). The strongest correlation was between percent change in suitable area and range stability (r = 0.833). Since nearly all species were projected to experience a decrease in suitable area, this shows that species with the smallest decrease in suitable area had the greatest range stabil-ity. The relationships both between shift pressure and percent change in suitable area (r = -0.487) and be-tween shift pressure and range stability were negative (r = -0.655); in other words, species were likely to experi-ence less climate change shift pressure (that is, distance to the nearest suitable projected habitat for 2050 under the Hadley B1 GCM-scenario combination) with less of a projected loss of habitat and with a greater amount of habitat remaining constant over time. Current realized niche occupancy, a measure of whether a species is a habitat generalist or a habitat specialist, was positively correlated with range stability (r = 0.458), but nega-tively correlated with shift pressure (r = -0.505). This suggests that habitat generalists, which have been found to exist in a wider variety of environmental niches and across large geographical ranges (Fridley et al., 2007), should be able to continue to exist across a broader area while not having to move as far to reach future suitable habitat.
Table 2: Mean across species values of the climate change pressure metrics developed using the Multivariate Spatio-Temporal Clustering approach, nationally and by region. Percent change is significantly different than 0 for all groups. Note: EG, eastern-general; EN, eastern-north; ES, eastern-south.
Suitable Area (km2)
Range Stability
Shift Pressure
Niche Occupancy
Region Species Current Future % Change Area (km2) % Mean SD
All 172 971,470 536,995 -44.33 403,500 36.90 11.77 20.80 134.43
East 132 1,144,327 613,065 -50.55 460,407 33.66 12.62 19.41 149.38
EG 54 1,761,160 899,699 -53.06 710,863 35.24 10.26 17.91 228.30
EN 25 878,119 441,224 -56.59 289,877 25.62 16.54 25.89 123.88
ES 53 641,203 402,071 -45.14 285,663 35.85 13.16 17.89 81.00
West 40 401,336 285,962 -23.82 215,706 47.58 8.97 25.36 85.10
Table 3: Spearman correlations between climate change pressure metrics among species, nationally and by re-gion. Correlations are significant at p < 0.05 except those underlined.
% Change Stability Shift pres-sure
Niche occu-pancy
All species
% Change . 0.833 -0.487 0.164
Stability 0.833 . -0.655 0.458
Shift pres. -0.487 -0.655 . -0.505
Niche occup. 0.164 0.458 -0.505 .
Eastern species
% Change . 0.903 -0. 522 0. 416
Stability 0.903 . -0. 657 0.592
Shift pres. -0. 522 -0.657 . -0. 643
Niche occup. 0.416 0.592 -0.643 .
Western species
% Change . 0.325 -0.058 -0.063
Stability 0.325 . -0.462 0.643
Shift pres. -0.058 -0.462 . -0.427
Niche occup. -0.063 0.643 -0.427 .
more broadly dispersed at more northerly latitudes) to have to move farther to reach an environmentally suit-able location in the future.
4
Discussion
Changing climatic conditions are expected to pose a threat to the viability of forest tree species, which may be forced either to adapt to new conditions or to shift
their ranges to more favorable environments (Aitken et al., 2008; Davis et al., 2005). Given the limitations in funding available for species-specific management and conservation activities, it will be necessary to compare the expected impacts of these environmental changes across multiple species in a region (e.g., Barazani et al., 2008; Coates and Atkins, 2001; Gauthier et al., 2010). We describe quantitative metrics developed for such comparative assessments. These are based on cli-mate change map products that combine esticli-mates of species’ edaphic and bioclimatic envelopes with down-scaled products of climate modeling, which can pre-dict the future spatial extent of those environmental envelopes and determine where species’ ranges might exist, disappear, move, grow or shrink under changed climatic conditions (Harris et al., 2006). Using these maps, the metrics describe the existing environmental variation across the range of a species (realized current niche occupancy), the degree to which the area of suit-able environmental conditions is predicted to decrease or increase over time (percent change in suitable area), the amount of currently suitable area that is expected to remain suitable (range stability over time), and the dis-tance that tree populations currently in areas expected to become unsuitable would have to travel to reach the nearest suitable location in the future (range shift pres-sure).
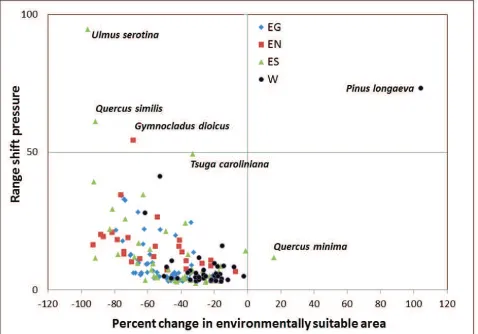
the Hadley B1 GCM/scenario combination, we found that nearly all of the 172 species in our analysis were expected to experience a loss of overall environmental suitable area and to need to move a relatively short dis-tance, on average, from newly unsuitable to the near-est future suitable locations (Fig. 3). Generating these metrics using other GCMs and scenarios might reveal different results.
Figure 3: The 172 species included in the analysis, plot-ted by percent change in environmental suitable area and range shift pressure (number of grid cells), based on the Hadley B1 global circulation model/scenario combi-nation. The labeled outlier species are discussed in the text. Note: EG, eastern-general; EN, eastern-north; ES, eastern-south; W-western.
In the current analysis, the species that are the ex-ceptions from the pattern of suitable area loss with rela-tively small climate change shift pressure are perhaps the most interesting from a monitoring, management and conservation perspective. For example, Great Basin bristlecone pine (Pinus longaeva), an extremely long-lived species which occurs in isolated mountain ranges in California, Nevada and Utah (Hiebert and Hamrick, 1984), is expected under Hadley B1 to experience an in-crease in suitable area that exceeds 100 percent, while retaining about 25 percent of its existing suitable habi-tat. The mean distance to suitable future environmental locations, from areas expected to become unsuitable, is greater than nearly all other species, however, at about 292 km (approximately 73 4-km2 map cells). This is because newly suitable locations for the species are pro-jected to develop in Canada, far from its current loca-tions, where much of its current habitat is expected to become unsuitable. At the same time, September elm (Ulmus serotina), a species scattered infrequently across a few southeastern states (Flora of North America
Edito-rial Committee, 1993+), is projected to lose nearly all its currently acceptable habitat, to maintain none of its cur-rently suitable habitat, and to need to shift an average of 379 km (approximately 95 4-km2 map cells) to reach suitable conditions in the future. Both species clearly need to be closely monitored, and may need to be consid-ered as candidates for facilitated migration (Pedlar et al., 2012; Vitt et al., 2010). Delta post oak (Quercus sim-ilis), Kentucky coffeetree (Gymnocladus dioicus), and Carolina hemlock (Tsuga caroliniana) are other species that may experience particularly intense climate change impacts. Meanwhile, dwarf live oak (Quercus minima), from central and northern Florida, is exceptional be-cause, under the Hadley B1 GCM/scenario, it is pro-jected to gain suitable area, maintain about 84 percent of its current suitable area, and need to move only a short distance from newly unsuitable to newly suitable locations.
both regions would need to span similar distances to reach future suitable environmental conditions.
It is important to note that the projected climate change pressure metrics we describe here represent only one set of inputs necessary for assessments comparing climate change risk across multiple tree species. The impact of climate change on species will vary across species based on such individualistic traits as seed dis-persal mechanism and life-history strategies (Parmesan, 2006; Parmesan and Yohe, 2003), which should be in-corporated into assessments of species susceptibility to climate change and other threats (Aitken et al., 2008; Myking, 2002; Sjostrom and Gross, 2006). These cli-mate change pressure statistics, along with considera-tion of species’ biological attributes, can allow for assess-ment of whether migrating species, for example, might be able to track appropriate environmental conditions over time and avoid the loss of extensive genetic vari-ation. A loss of important adaptive genetic variation may be a concern particularly for species that have nar-row habitat requirements, are located exclusively at high elevations, and/or are not able to disperse their propag-ules effectively across long distances. Even if not lo-cally extirpated outright, populations of these and other species could experience significant inbreeding, genetic drift, and decreased genetic variation as a result of re-duced population size. Such populations may then be-come more susceptible to mortality caused both by non-native pests and pathogens and by the environmental pressures associated with climate change. This suscep-tibility could generate a cycle of mortality, loss of genetic variation, and inability to adapt to change that could ul-timately result in population extirpation (Potter et al., 2010).
Along with the consideration of important species life-history traits and of threats other than climate change, such as pest and pathogen infestation (Dukes et al., 2009; Logan et al., 2003), we expect that the metrics we describe here will be valuable for scientists and pol-icymakers attempting to determine which forest tree species, in the face of climate change, should be targeted for monitoring efforts and forin situ andex situ conser-vation actions such as seed banking efforts, facilitated migration, and genetic diversity studies. These measures of predicted climate change pressure may be particularly helpful in multiple-species assessments across broad re-gional scales that take into account climate change risk to many species aggregated from relatively fine resolu-tion projecresolu-tion maps.
5
Acknowledgments
We thank Frank Koch for assistance with the Forest Inventory and Analysis data, Steve Norman and Carol
Aubry for helpful suggestions, and Julie Canavin for data organization. Forrest Hoffman was instrumental in developing the parallel MSTC code and ran the cluster-ing analysis. Barry Baker and Chris Zganjar prepared the input data sets used for the MSTC process. We thank the guest editors and the three anonymous review-ers for their helpful comments. This work was supported in part by the Eastern Environmental Threat Assess-ment Center; by the Forest Health Monitoring program of the United States Department of Agriculture (USDA) Forest Service; and by Cooperative Agreement 09-CA-11330146-078 and Research Joint Venture Agreement 10-JV-11330146-049 between the USDA Forest Service, Southern Research Station, and North Carolina State University.
References
Aitken, S.N., S. Yeaman, J.A. Holliday, T.L. Wang, and S. Curtis-McLane. 2008. Adaptation, migration or ex-tirpation: climate change outcomes for tree popula-tions. Evol. Appl. 1(1):95-111.
Aubry, C., W. Devine, R. Shoal, A. Bower, J. Miller, and N. Maggiulli. 2011. Climate Change and Forest Biodi-versity: A Vulnerability Assessment and Action Plan for National Forests in Western Washington. USDA For. Serv. Pacific Northwest Region. 308 p.
Baker, B., H. Diaz, W. Hargrove, and F. Hoffman. 2010. Use of the Koppen-Trewartha climate classification to evaluate climatic refugia in statistically derived ecoregions for the People’s Republic of China. Clim. Change 98(1-2):113-131.
Barazani, O., A. Perevolotsky, and R. Hadas. 2008. A problem of the rich: Prioritizing local plant genetic resources for ex situ conservation in Israel. Biol. Con-serv. 141(2):596-600.
Bechtold, W.A., and P.L. Patterson. 2005. The En-hanced Forest Inventory and Analysis Program: Na-tional Sampling Design and Estimation Procedures. USDA For. Serv. Gen. Tech. Rep. SRS-GTR-80. 85 p.
Brook, B.W., N.S. Sodhi, and C.J.A. Bradshaw. 2008. Synergies among extinction drivers under global change. Trends Ecol. Evol. 23(8):453-460.
Coates, D.J., and K.A. Atkins. 2001. Priority setting and the conservation of Western Australia’s diverse and highly endemic flora. Biol. Conserv. 97(2):251-263.
at http://forest.moscowfsl.wsu.edu/climate/; last ac-cessed June 25, 2013.
Davis, M.B., and R.G. Shaw. 2001. Range shifts and adaptive responses to Quaternary climate change. Sci-ence 292(5517):673-679.
Davis, M.B., R.G. Shaw, and J.R. Etterson. 2005. Evolutionary responses to changing climate. Ecology 86(7):1704-1714.
Devine, W., C. Aubry, J. Miller, K.M. Potter, and A.D. Bower. 2012. Climate change and forest trees in the Pacific Northwest: Guide to vulner-ability assessment methodology. USDA For. Serv. Pacific Northwest Region. 49 p. Available online at http://ecoshare.info/projects/ccft/; last accessed Aug. 15, 2013.
Dukes, J.S., J. Pontius, D. Orwig, J.R. Garnas, V.L. Rodgers, N. Brazee, B. Cooke, K.A. Theoharides, E.E. Stange, R. Harrington, J. Ehrenfeld, J. Gurevitch, M. Lerdau, K. Stinson, R. Wick, and M. Ayres. 2009. Re-sponses of insect pests, pathogens, and invasive plant species to climate change in the forests of northeast-ern North America: What can we predict? Can. J. For. Res. 39(2):231-248.
Fitzpatrick, M.C., and W.W. Hargrove. 2009. The pro-jection of species distribution models and the problem of non-analog climate. Biodivers. Conserv. 18(8):2255-2261.
Flora of North America Editorial Committee. 1993+. Flora of North America North of Mexico. Available online at http://floranorthamerica.org/; last accessed June 25, 2013.
Fridley, J.D., D.B. Vandermast, D.M. Kuppinger, M. Manthey, and R.K. Peet. 2007. Co-occurrence based assessment of habitat generalists and specialists: a new approach for the measurement of niche width. J. Ecol. 95(4):707-722.
Gauthier, P., M. Debussche, and J.D. Thompson. 2010. Regional priority setting for rare species based on a method combining three criteria. Biol. Conserv. 143(6):1501-1509.
Global Soil Data Task Group. 2000. Global Gridded Sur-faces of Selected Soil Characteristics (International Geosphere-Biosphere Programme - Data and Informa-tion System [IGBP-DIS]). Oak Ridge NaInforma-tional Labo-ratory Distributed Active Archive Center, Oak Ridge, Tennessee.
Hampe, A., and R.J. Petit. 2005. Conserving biodiver-sity under climate change: the rear edge matters. Ecol. Lett. 8(5):461-467.
Hargrove, W.W., and F.M. Hoffman. 2003. An analytical assessment tool for predicting changes in a species dis-tribution map following changes in environmental con-ditions. In Proceedings of the 4th International Con-ference on Integrating GIS and Environmental Mod-eling (GIS/EM4): Problems, Prospects and Research Needs, September 2-8, 2000, Parks, B.O., K.M. Clark, and M.P. Crane (eds.). Cooperative Institute for Re-search in Environmental Sciences; NOAA National Geophysical Data Center, Ecosystem Informatics; and US Geological Survey, Center for Biological Informat-ics, Banff, Alberta, Canada.
Hargrove, W.W., and F.M. Hoffman. 2005. Potential of multivariate quantitative methods for delineation and visualization of ecoregions. Environ. Manage. 34((Suppl. 1)):S39-S60.
Harris, J.A., R.J. Hobbs, E. Higgs, and J. Aron-son. 2006. Ecological restoration and global climate change. Restor. Ecol. 14(2):170-176.
Hiebert, R.D., and J.L. Hamrick. 1984. An ecological study of bristleone pine (Pinus longaeva) in Utah and eastern Nevada. Great Basin Nat. 44(3):487-494.
Hijmans, R.J., S.E. Cameron, J.L. Parra, P.G. Jones, and A. Jarvis. 2005. Very high resolution interpolated climate surfaces for global land areas. Int. J. Climatol. 25(15):1965-1978.
Hoffman, F.M., W.W. Hargrove, D.J. Erickson, and R.J. Oglesby. 2005. Using clustered climate regimes to an-alyze and compare predictions from fully coupled gen-eral circulation models. Earth Interact 9(10):1-27.
International Panel on Climate Change. 2007. Climate change 2007: The physical science basis. Contribution of working group I to the fourth assessment report of the intergovernmental panel on climate change. Cam-bridge University Press, CamCam-bridge, United Kingdom and New York, NY, USA. 996 p.
Iverson, L.R., and D. McKenzie. 2013. Tree-species range shifts in a changing climate: detecting, mod-eling, assisting. Landscape Ecol. 28(5):879-889.
Iverson, L.R., A.M. Prasad, S.N. Matthews, and M. Pe-ters. 2008. Estimating potential habitat for 134 east-ern US tree species under six climate scenarios. For. Ecol. Manage. 254(3):390-406.
Iverson, L.R., M.W. Schwartz, and A.M. Prasad. 2004b. Potential colonization of newly available tree-species habitat under climate change: an analysis for five east-ern US species. Landscape Ecol. 19(7):787-799.
Johnson, G.R., F.C. Sorensen, J.B. St Clair, and R.C. Cronn. 2004. Pacific Northwest forest tree seed zones: A template for native plants? Native Plants J. 5(2):131-140.
Kowalski, C.J. 1972. On the effects of non-normality on distribution of sample product-moment correlation co-efficient. J. R. Stat. Soc. Ser. C-Appl. Stat. 21(1):1-12.
Little, E.L. 1971. Atlas of United States Trees. Volume 1. Conifers and Important Hardwoods. USDA For. Serv. Misc. Pub. 1146. 9 p., illus. [313 maps, folio].
Logan, J.A., J. Regniere, and J.A. Powell. 2003. As-sessing the impacts of global warming on forest pest dynamics. Front. Ecol. Environ. 1(3):130-137.
Loo, J. 2009. Ecological impacts of non-indigenous inva-sive fungi as forest pathogens. Biol. Invasions 11(1):81-96.
Lugo, A.E., S.L. Brown, R. Dodson, T.S. Smith, and H.H. Shugart. 1999. The Holdridge life zones of the conterminous United States in relation to ecosystem mapping. J. Biogeogr. 26(5):1025-1038.
Malmsheimer, R.W., P. Heffernan, S. Brink, D. Cran-dall, F. Deneke, C. Galik, E. Gee, J.A. Helms, N. McClure, M. Mortimer, S. Ruddell, M. Smith, and J. Stewart. 2008. Forest management solutions for mit-igating climate change in the United States. J. For. 106(3):115-173.
Mangold, R.D., and W.J. Libby. 1978. Model for re-forestation with optimal and suboptimal tree popu-lations. Silvae Genet. 27(2):66-68.
Matthews, S.N., L.R. Iverson, A.M. Prasad, M.P. Pe-ters, and P.G. Rodewald. 2011. Modifying climate change habitat models using tree species-specific as-sessments of model uncertainty and life history-factors. For. Ecol. Manage. 262(8):1460-1472.
McLaughlin, S.P. 1995. An overview of the flora of the sky islands, southeastern Arizona: Diversity, affini-ties, and insularity. P. 60-70 in Biodiversity and Man-agement of the Madrean Archipelago: The Sky Is-lands of Southwestern United States and Northwest-ern Mexico, DeBano, L.H., P.H. Ffolliott, A. Ortega-Rubio, G.J. Gottfried, R.H. Hamre, and C.B. Edmin-ster (eds.). USDA For. Serv. Gen. Tech. Rep. RM-GTR-264. 669 p.
Moore, I.D., R.B. Grayson, and A.R. Ladson. 1991. Dig-ital terrain modeling: A review of hydrological, ge-omorphological, and biological applications. Hydrol. Process. 5(1):3-30.
Myking, T. 2002. Evaluating genetic resources of forest trees by means of life history traits - a Norwegian ex-ample. Biodivers. Conserv. 11(9):1681-1696.
Neilson, R.P. 1995. A model for predicting continental-scale vegetation distribution and water balance. Ecol. Appl. 5(2):362-385.
Parmesan, C. 2006. Ecological and evolutionary re-sponses to recent climate change. Annu. Rev. Ecol. Evol. Syst. 37:637-669.
Parmesan, C., and G. Yohe. 2003. A globally coherent fingerprint of climate change impacts across natural systems. Nature 421(6918):37-42.
Pedlar, J.H., D.W. McKenney, I. Aubin, T. Beardmore, J. Beaulieu, L. Iverson, G.A. O’Neill, R.S. Winder, and C. Ste-Marie. 2012. Placing forestry in the as-sisted migration debate. Bioscience 62(9):835-842.
Petit, R.J., R. Bialozyt, P. Garnier-Gere, and A. Hampe. 2004. Ecology and genetics of tree invasions: From recent introductions to Quaternary migrations. For. Ecol. Manage. 197(1-3):117-137.
Potter, K.M., and W.W. Hargrove. 2012. Determin-ing suitable locations for seed transfer under climate change: A global quantitative model. New Forest. 43(5-6):581-599.
Potter, K.M., W.W. Hargrove, and F.H. Koch. 2010. Predicting climate change extirpation risk for cen-tral and southern Appalachian forest tree species. P. 179-189 in Proceedings from the Conference on Ecol-ogy and Management of High-Elevation Forests of the Central and Southern Appalachian Mountains, Snow-shoe, West Virginia, May 14-15, 2009, Rentch, J.S., and T.M. Schuler (eds.). USDA For. Serv. Gen. Tech. Rep. NRS-P-64. 242 p.
Prasad, A.M., L.R. Iverson, S. Matthews,
and M. Peters. 2013. A Climate Change
Atlas for 134 Forest Tree Species of the
Eastern United States. Available online at http://www.nrs.fs.fed.us/atlas/tree/tree atlas.html; last accessed June 25, 2013.
Rehfeldt, G.E. 1999. Systematics and genetic structure of Ponderosae taxa (Pinaceae) inhabiting the moun-tain islands of the Southwest. Am. J. Bot. 86(5):741-752.
Rehfeldt, G.E., N.L. Crookston, M.V. Warwell, and J.S. Evans. 2006. Empirical analyses of plant-climate rela-tionships for the western United States. Int. J. Plant Sci. 167(6):1123-1150.
Rehfeldt, G.E., C.C. Ying, D.L. Spittlehouse, and D.A. Hamilton. 1999. Genetic responses to climate inPinus contorta: Niche breadth, climate change, and refor-estation. Ecol. Monogr. 69(3):375-407.
Root, T.L., J.T. Price, K.R. Hall, S.H. Schneider, C. Rosenzweig, and J.A. Pounds. 2003. Fingerprints of global warming on wild animals and plants. Nature 421(6918):57-60.
Russell, E.W.B. 1987. Pre-blight distribution of Cas-tanea dentata (Marsh.) Borkh. Bull. Torrey Bot. Club 114(2):183-190.
SAS Institute Inc. 2008. The SAS System for Windows, Version 9.2. Cary, North Carolina.
Saxon, E., B. Baker, W. Hargrove, F. Hoffman, and C. Zganjar. 2005. Mapping environments at risk under different global climate change scenarios. Ecol. Lett. 8(1):53-60.
Schwartz, M.W., L.R. Iverson, A.M. Prasad, S.N. Matthews, and R.J. O’Connor. 2006. Predicting ex-tinctions as a result of climate change. Ecology 87(7):1611-1615.
Sjostrom, A., and C.L. Gross. 2006. Life-history charac-ters and phylogeny are correlated with extinction risk in the Australian angiosperms. J. Biogeogr. 33(2):271-290.
Smith, W.B. 2002. Forest inventory and analysis: a na-tional inventory and monitoring program. Environ. Pollut. 116:S233-S242.
St. Clair, J.B., and G.T. Howe. 2007. Genetic maladap-tation of coastal Douglas-fir seedlings to future cli-mates. Glob. Change Biol. 13(7):1441-1454.
Stenseth, N.C., A. Mysterud, G. Ottersen, J.W. Hurrell, K.S. Chan, and M. Lima. 2002. Ecological effects of climate fluctuations. Science 297(5585):1292-1296.
Stephenson, S.L., H.S. Adams, and M.L. Lipford. 1991. The present distribution of chestnut in the upland
for-est communities of Virginia. Bull. Torrey Bot. Club 118(1):24-32.
Stork, N.E., J.A. Coddington, R.K. Colwell, R.L. Chaz-don, C.W. Dick, C.A. Peres, S. Sloan, and K. Willis. 2009. Vulnerability and resilience of tropical forest species to land-use change. Conserv. Biol. 23(6):1438-1447.
Thomas, C.D., A. Cameron, R.E. Green, M. Bakkenes, L.J. Beaumont, Y.C. Collingham, B.F.N. Erasmus, M.F. de Siqueira, A. Grainger, L. Hannah, L. Hughes, B. Huntley, A.S. van Jaarsveld, G.F. Midgley, L. Miles, M.A. Ortega-Huerta, A.T. Peterson, O.L. Phillips, and S.E. Williams. 2004. Extinction risk from climate change. Nature 427(6970):145-148.
United States Geological Survey. 1999. Digital rep-resentation of ”Atlas of United States Trees” by Elbert L. Little Jr. Available online at http://esp.cr.usgs.gov/data/atlas/little/; last ac-cessed June 25, 2013.
Vitt, P., K. Havens, A.T. Kramer, D. Sollenberger, and E. Yates. 2010. Assisted migration of plants: Changes in latitudes, changes in attitudes. Biol. Con-serv. 143(1):18-27.
Warshall, P. 1995. The Madrean sky island archipelago: A planetary overview. P. 6-18 in Biodiversity and Management of the Madrean Archipelago: The Sky Islands of Southwestern United States and Northwest-ern Mexico, DeBano, L.H., P.H. Ffolliott, A. Ortega-Rubio, G.J. Gottfried, R.H. Hamre, and C.B. Edmin-ster (eds.). USDA For. Serv. Gen. Tech. Rep. RM-GTR-264. 669 p.
Woodall, C.W., C.M. Oswalt, J.A. Westfall, C.H. Perry, M.D. Nelson, and A.O. Finley. 2009. An indicator of tree migration in forests of the eastern United States. For. Ecol. Manage. 257(5):1434-1444.
Woudenberg, S.W., B.L. Conkling, B.M. O’Connell, E.B. LaPoint, J.A. Turner, and K.L. Waddell. 2010. The Forest Inventory and Analysis Database: Database Description and Users Manual Version 4.0 for Phase 2. USDA For. Serv. Gen. Tech. Rep. RMRS-GTR-245. 336 p.
Wu, H.X., and C.C. Ying. 2004. Geographic pattern of local optimality in natural populations of lodgepole pine. For. Ecol. Manage. 194(1-3):177-198.