Automatic Detection& Classification of
Riceusing Computer Vision- A Survey
Daljeet Kaur
Assistant Professor, Dept. of ECE, UIET, Panjab University, Chandigarh, India
ABSTRACT: Human being for the quality inspectionof various food articles are being used for so long. Human being was assigned a duty to recognize fruits, grains,flowers and many other agriculture and products. Even Face recognition of a person , birds and animal identification and classificationbased on theirshape, size, color and patterns was being done manually by human being. However manual evaluation is very difficult and tiring ,there is a lot of wastage of time as well. Thedecision-making power of human-inspectors are subjected to be influenced by various factors such as tiredness, bias , loss of interest etc. So thesejobs need automation,in this context Machine Vision System is used successfully for automated identification and classification of images of various Rice Grains
KEYWORDS :Rice grain classification , Neural Networks, Machine vision System, Automatic Quality Checking of rice grain
I .INTRODUCTION
There are five main constituents of an automatic machinevision system which include illumination, camera, an image acquisitionboard ,computer hardware and software. Illumination system has a great effect on the quality of image and has a significant role in performance and precision of the system. A good illumination system can improve image processing by highlighting various image features like contrast and brightness. Proper lighting can reduce reflection and shadow. Important things to be taken care of while designing a illumination setup to be used in food industry includeslocation of the camera, type of lamp and color quality[2].
The procedure used to changeimages into mathematical form is called digitization. To do this an image is divided into a 2D space of very small portions known as pixels by using a digitizer or frame grabber. There aremany analogue to digital converters (ADC) available but for real time applicationsa different type is needed, this is called as a flash ADC [3]
Low level image processing is responsible for capturing of the image and itspre-processing. Image acquisition is basically capturing the image by using the sensing device and converting it into the mathematical form. Pre-processing is done to improve image quality either by filtering out the unwanted data i.e noise or by highlighting the important portions of the region of intrest. [4] .
II. METHODS USED FOR DETECTION AND CLASSIFICATION
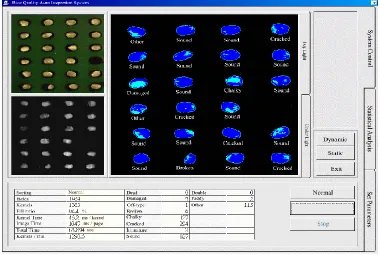
Y.N.Wanet al [12] uesd16 parameters which areclassified into 3 basic groups: (1) Morphological characteristics are rice area, perimeter, compactness , L/B ratio ; (2) Color characteristics of a rice grain includes average gray-levels of red, green, and blue color (3) Characteristics of image illuminated from below: maximum gray-level difference (MGLD) between adjacent blocks on a rice grain, to categories 1200 samples of brown rice into 13 categories such as sound kernels, green mature kernels, chalky kernels (white, green), cracked kernels, broken kernel, immature kernels (green, white), deadkernels (white, green), damaged kernels (including rusty, discolored, abnormal, and insect-damaged kernels), off-type kernels and paddy.
Firstly rice grains were placed and then scattered on matrixsheet which is placed on a conveyer belt of the machine. Two CCD (charge-coupled device) cameras connected to the image processing unit of the system were used to capture the image of the rice grains moving on the conveyer belt.Histogram and threshold methods were used to separate each rice grain from its background.
The neural network with three-layer error back-propagation (EBP) model using normalizedinput parameters, sigmoid activation function, and dlearning method with initial learning constant0.5 and fixed moment constant 0.4. The learning cycle was 50,000 iterations. The advantage of using neural network method was that it did not require time-consuming tests and modifications to increase the inspection accuracy.
Fig. 1 Grain quality inspection windows
The recognition accuracy was about 75.9%. Combining appearance-alike rice categories such as white dead, immature and chalky kernels; green dead, immature, and chalky kernels; damaged and off-type kernels; cracked and sound kernels, could increase the recognition accuracy to 92.7%. The hybrid method continued the process using the range selection method to separate the appearance-alike rice kernels. The average inspection accuracy of the hybrid method was 86.4%.
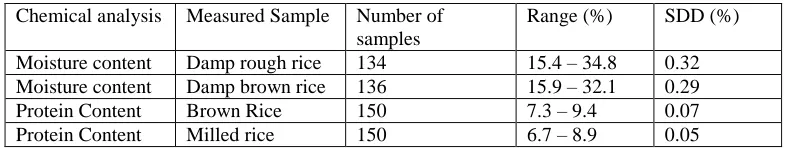
Shuso Kawamura et al [9]used a near-infrared (NIR) transmission Instrument and a visible light segregator (VIS) to determine sound whole kernel of brown rice. The NIR instrument and the VIS segregator were found to be very good to determine moisturecontent , protein content and sound whole kernel ratio due to their high precision and accuracy .The major chemical ingredients of milled rice are moisture (15%), protein (7%) and starch (77%). The major quality aspect of the milled rice (the rice grain ready to be cooked) is protein content. Protein content decides the extent up to which the rice can absorb water when rice is cooked and it also affects the quality of cooked rice. Rice which has fairly good amount of protein is considered good from health point of view and tasty as well because they are less sticky. The objective was to make an automatic rice-quality detection system using a near-infrared (NIR) instrument and a visible light (VIS) segregator. The instrument scanned 33 wavelengths between 825 and 1075 nm. Rice were poured into the hopper of the instrument .A silicon detector captured the NIR light that was passed through the rice grainsandconverted thatinto the electrical signals. The value of SDD is measured for the moisture content and protein content and is given in Table 1.
Table No1. Precision of chemical analysis
Chemical analysis Measured Sample Number of
samples
Range (%) SDD (%)
Moisture content Damp rough rice 134 15.4 – 34.8 0.32
Moisture content Damp brown rice 136 15.9 – 32.1 0.29
Protein Content Brown Rice 150 7.3 – 9.4 0.07
Protein Content Milled rice 150 6.7 – 8.9 0.05
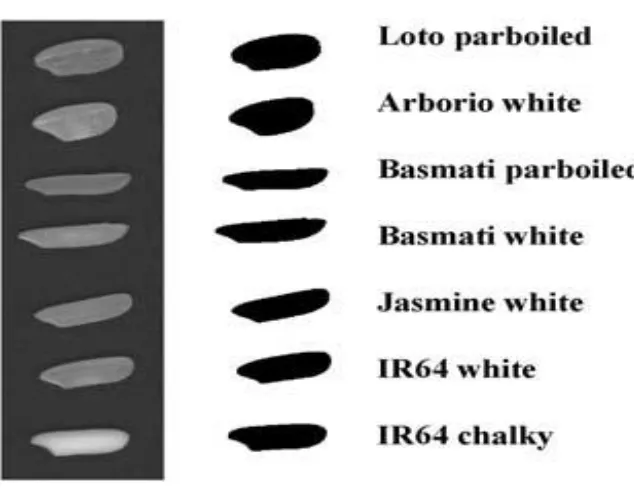
G.van Dalen et al [10] presents an image analysis (IA) method using flatbed scanner (FBS) for the classification of the rice grain after its size determination. A flatbed scanner, also known as desktop scanner was used to take the images of the rice grains. The rice is placed on the glass plate of the FBS scanner and covered with a black sheet of paper. Because of its cost effectiveness , robustness and it does not depend on the external light conditions so FBS scanners are the most commonly used scanners. The scanner was used with the resolution of 200 dpi . Analysis was made using the Scion Image software.
Fig. 2 Various types of rice grains
Image processing has various methods to distinguish connected objects. In these the layer of pixels are removed one by onefrom the outer surface of the image. The purpose of this process is to separate the touching objects without the lose of any information . Dilation is done after erosion. Here two different software’s Scion and Qwin were used and whose results were compared at the end to check the classification accuracy. None of the software gave a satisfactory result to separate the connected objects. The accuracy of software for calculating the parametersof rice was tested by comparing the results obtained by manual analysis using a sliding caliper which resulted in an error.The length of the rice grain observed with the two software and the manual determination was under acceptable level of only 3%. However, the widths were quite larger than manual analysis.
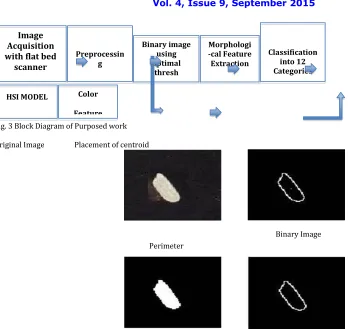
D. M. Hobson, R.M Caetwr,Y.Yan et al[11]To identify the features eight most widely used type of rice were used. The features werelength and aspect of the rice. Compactness and texture featurewere also identified and played very important role here in classification.Features are extracted by applying unsupervised clustering techniquesfor theappropriate identification. Image of the rice grains is taken through a CCD camera. The next step is to remove noise from the image then thresholding the original image leaving us withbinary form of the image. Minor problems are removed by using various morphological functions, then filtering is done after that. Edge detection is done on the perimeter of the of the rice grains.
Fig. 3 Block Diagram of Purposed work
Original Image Placement of centroid
Fig. 4 Placement of centroid in the perimeter image
Table No.2 Classification of rice grains based on L/B ratio
Rice No. Length in Pixels (*0.127mm) Breadth in Pixels(*0.127mm) L/B Ratio Class
1 2 3 4 5 6 7 8 9 10
44 pixels *0.127 =5.5880mm 27 pixels *0.127 =3.429mm 48 pixels *0.127 =6.096mm 42 pixels *0.127 =5.3340mm 26 pixels *0.127 =3.3020mm 36 pixels *0.127 =4.5720mm 40 pixels *0.127 =5.0800mm 41 pixels *0.127 =5.2070mm 12 pixels *0.127 =1.5240mm 30 pixels *0.127 =3.8100mm
13 pixels *0.127=1.6510mm 16 pixels *0.127 =2.032mm 15 pixels *0.127=1.4050mm 11 pixels *0.127=1.3970mm 16 pixels *0.127=2.0320mm 13 pixels *0.127=1.6510mm 14 pixels *0.127=1.7780mm 13 pixels *0.127=1.6510mm 7 pixels *0.127 =0.8890mm 13 pixels *0.127=1.6510mm
3.38 1.68 4.33 3.81 1.62 2.76 2.85 3.15 1.71 2.30 Full Size Small Broken Full Size Full size Small Broken Full size Full size Full size Small Broken Big Broken
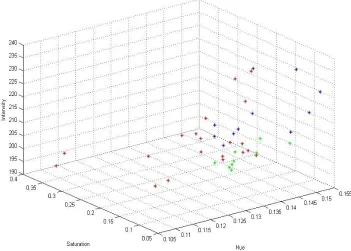
Table no.2 shows the Length and breadth calculations of few rice grains.The calculations have been done for180 grains.Then value of Hue, Saturation and Intensity parameters of each rice which are necessary to classify the rice on the bases of color have been calculated.
Color Feature Extraction HSI MODEL Classification into 12 Categories Morphologi -cal Feature Extraction Binary image using optimal thresh holding Preprocessin g Image Acquisition with flat bed
scanner
Figure No.5 Three Dimensional Plot for Hue, Saturation and intensity
Table no.3Color Classification on the bases of Saturation and Intensity
Rice no. Saturation Intensity Hue Class
1 2 3 4 5 6 7 8 9 10
0.1076 0.1311 0.2347 0.1180 0.1005 0.1025 0.1085 0.0742 0.0994 0.1060
215.48 190.02 182.17 235.49 191.52 198.50 190.60 192.12 230.98 191.98
0.1358 0.1200 0.1220 0.1550 0.1714 0.1480 0.1390 0.1670 0.1530 0.1480
Chalky Discolored Discolored Chalky
Good Good Good Good Chalky
Good
III. CONCLUSION
Various methods and techniques of calculating the morphological parameters of rice like Length, Breadth , Area , Perimeter, L/B ratio ,Texture features and color features have been discussed on the bases of which rice can be classified into varies categories like Full rice, big broken rice , small broken, organic ,discolored rice , damaged rice and chalky rice etc. Advantages and disadvantages of image acquisition devices like Flat Bed Scanner and CCD cameras have also been discussed. Accuracy and speed of classification of rice can further be enhanced by using fuzzy logic along with neural network and image procession as a combination.
REFRENCES
1. Jamieson V (2002). Physics raises food standards. Physics World, 1, 21–22.
2. Gunasekaran S (2001). Non-destructive food evaluation techniques to analyse properties and quality. Food Science and Technology, vol. 105, New York: Marcel Decker.
3. Davies E R (1997). Machine vision: Theory, algorithms, practicalities. London: Academic Press.
4. Park B and Chen YR (1994). Intensified multispectral imaging system for poultry carcass inspection. Transactions of the ASAE, 37(6): 1983– 1988.
5. Sonka M, Hlavac V, and Boyle R (1999). Image Processing, Analysis, and Machine Vision.PWS publishing, California, USA.
6. Gerrard DE, Gao X and Tan J (1996). Beef marbling and colour score determination by image processing. Journal of Food Science, 61(1): 145-148.
7. Tarun Pal Singh, Manish Kumar Chatli, Parminder Singh and PavanKumar(2013).Advances in computer vision technology for foods of animal and aquatic origin- a review. Journal Of Meat Science and Technology.Vol 1,issue 2 page no.40-49
8. Dr.AshaGowdaKaregowda, Samreen S, Pushpalatha.K.R(May 2015). Automated Detection and Classification of Images using Color and Texture Features-A Survey. International Journal Of Innovative Research in Computer and Communication Engineering.Vol. 3, issue 5, pagr248-253.
9. ShusoKawamura ,MotoyasuNatsuga ,Kazuhiro Takekura , Kazuhiko Itoh (2003).Development of an automatic rice-quality inspection system. Computers and Electronics in Agriculture.
10. G. van Dalen (2004).Determination of the size distribution and percentage of broken kernels of rice using flatbed scanning and image analysis. Food Research International 37 (2004) 51–58
11. D. M. Hobson, R. M. Carter, Y. Yan(2007).Characterisationand Identification of Rice Grains through Digital Image Analysis. Instrumentation and Measurement Technology Conference - IMTC 2007.
12. Y.-N. Wan. Automatic Grain Quality Inspection with Learning Mechanism.
13. Wan, Y.-N. 2002. Kernel handling performance of an automatic grain quality inspection system. Trans. ASAE 45(2):369-378.
14. Wan, Y.-N., C.-M. Lin, and J.-F. Chiou. 2002. Rice quality classification using an automatic grain quality inspection system. Trans. ASAE 45(2):379-388.