RSS
RPV
CS
CUD COP RCS
Sensitivity Analysis of the PBMR Reactor Unit Seismic Model
Francois du Plooy
Pebble Bed Modular Reactor (Pty) Ltd, South Africa
ABSTRACT
A sensitivity of the PBMR Reactor Unit (RU) seismic model is presented. The purpose of this study is to quantify the sensitivity of important response values such as restraint forces to various design inputs. For this purpose a simplified beam finite element (FE) model is used. The response of the RU is solved in the time domain and includes nonlinearities due to gap supports. Sensitivities are calculated using the design of experiments method.
INTRODUCTION
The PBMR seismic design has many challenges due to, for example, the height to diameter ratio of the reactor as well as the requirements for thermal design. The thermal expansion is handled by the introduction of gap supports. The FE model presented here handles the gaps by attempting to model its physical characteristics of gap size and closed stiffness to a level of accuracy that still allows for fast run times. In this way it is possible to calculate sensitivities that will assist in an improved design. In the first part of this paper the seismic design is discussed. This is followed by a description of the FE model. Lastly the results of the sensitivity analysis is presented.
SEISMIC DESIGN
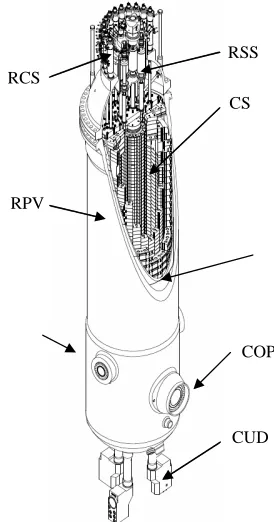
The RU design was described by Venter et al. [1] and consists of the Reactor Pressure Vessel (RPV), Core Barrel (CB) and Core Structures Ceramics (CSC). In Fig. 1 the physical layout of the various components are shown. The figure also shows the location of the Core Inlet Pipe (CIP), Core Outlet Pipe (COP), Core Unloading Device (CUD), Reactivity Control System (RCS) and the Reserve Shutdown System (RSS). The CB is the support for the Core Structures (CS). The CS consist of ceramic blocks, pebble fuel and metallic components which include the restraints.
Fig. 1: RU components
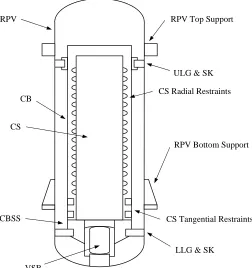
The restraints that are important for the modelling of the seismic behaviour of the RU can be summarised schematically as shown in Fig. 2. All the supports are designed to satisfy the various thermal loading conditions in the first instance. To aid in this requirement tangential restraints are used where possible to reduce the gap size.
Fig. 2: Schematic layout of the RU seismic supports
The RPV Bottom Support reacts vertical, horizontal and moment loads to the building. The RPV Top Support is designed to transfer horizontal loads only. These supports have the additional requirement to reduce the heat transfer from the RPV to the building. The Vertical Support Bearing (VSB) allows horizontal displacement of the RPV through rolling motion. The support is stable and will return to the centre position if disturbed, but the force transferred through this motion is small compared to the Seismic Key (SK) and is neglected. The Core Barrel Support Structure (CBSS) is a very stiff structure which supports the CS vertically and is additionally keyed to the RPV through a small gap to transfer the horizontal seismic load. There is also a spring parallel to the SK termed the Lower Lateral Guide (LLG) the purpose of which is to transfer loads other than seismic loads. The LLG consists of 9 springs loaded tangentially, has a relatively low stiffness and is modelled. The Upper Lateral Guide (ULG) and Seismic Key’s method of operation is the same as the LLG and SK. The CS can transfer loads to the CB through the radial restraints, tangential restraints as well as shear and vertical loads at the bottom of the CS through the CBSS interface.
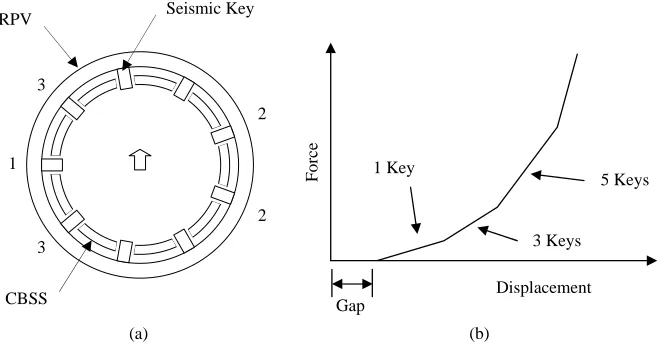
The action of all the keyed supports can be explained with reference to Fig. 3. A cross section of the Lower Seismic Key (LSK) assembly is shown in Fig. 3(a). The inner ring represents the CBSS skirt and the outer ring the RPV. A small gap exist between the key and the CBSS skirt. If motion perpendicular to one restraint is considered as indicated by the arrow in the figure the force vs. displacement curve for the key assembly can be approximated by the relationship shown in Fig. 3(b). The relationship can be explained by noting that the distance each restraint has to travel until gap closure grows as the angle with the horizontal restraint increases. The change in slope of the curve is therefore the result of more keys making contact. The sequence in which the restraints will make contact is indicated by the numbers on Fig. 3(a). This motion is purely translational which ignores rotation of the CB about its vertical axis as well as the effect of friction.
RPV
RPV Bottom Support CS
CS Radial Restraints ULG & SK
LLG & SK CB
VSB CBSS
RPV Top Support
CS Tangential Restraints
Fig. 3: Force vs. displacement for the Lower Seismic Keys
The CS are supported to the CB with radial restraints. There are 18 restraints arranged around the circumference of the CS and this is repeated at 29 positions along its height. As with the SK the relative motion needed to close the gaps between the restraint and the CB is a function of the angle between the direction of motion and the restraint. The force vs. displacement characteristic of the CS radial and tangential restraints will therefore be similar to that shown in Fig. 3(b) as is explained by the horizontal section through the CB and CS in Fig. 4. The figure shows that the gap size is larger for gap 4 than for gap 1. The gap is calculated by considering the CS, CB and restraint as rigid.
Fig. 4: CS radial restraint gap definition (horizontal section through CB and CS)
FINITE ELEMENT MODEL
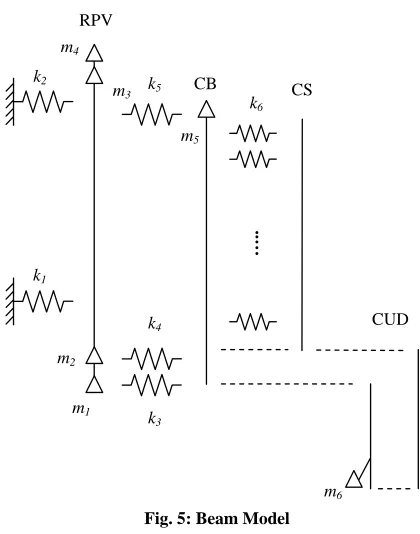
The various RU components are modelled with beam elements and concentrated masses ( ) for heavy components as shown in Fig. 5. The CS is a complex structure with thousands of contacts between blocks, keys and dowels as well as hundreds of thousands of spherical fuel elements. The bending behaviour of this structure will be difficult to calculate and conservative assumptions will be used to account for this uncertainty.
δ1 δ4
CS CB
RPV
CBSS
Seismic Key
Gap
Displacement
Fo
rc
e
1 Key
3 Keys
5 Keys 1
2
2 3
3
(b) (a)
Fig. 5: Beam Model
Table 1: Description of spring and mass elements in Fig. 5
Description Symbol
RPV Bottom Support k1
RPV Top Support k2
RPV Bottom Head k3
LLG & SK k4
ULG & SK k5
CS Radial Restraints k6
VSB interface with the RPV Bottom Head m1
Seismic Key m2
RCS and RSS feeder bin m3
RSS valve block m4
CB Top Plate m5
CUD m6
Local effects, such as the deformation of the CB due to a radial load cannot be represented by a constant section beam element, and was taken into account using springs with properties calculated using a 3D shell FE model. A typical scaled displacement result for a load applied close to the top of the CB is shown in Fig. 6(a) and the resulting curve of the stiffness as a function of height is shown in Fig. 6(b). It should be noted that the gap size between the CS and CB is also a function of height due to difference in temperature and this is taken into account. Other local stiffnesses calculated in this way is that of the RPV bottom head and the RPV bottom support. The different damping values for the CSC and metallic components are taken into account using Rayleigh damping. The input motion to the model is calculated using SASSI. The resulting motion of the RPV bottom and top supports are applied as enforced displacement to take account of the relative displacement between the top and bottom supports.
…..
RPV
CB CS
CUD k2
k1
k4
k3 k5
k6
m1 m2
m3 m4
m5
m6
Fig. 6: Stiffness as a function of height for one radial restraint in contact with the CB
The gaps are defined as radial gaps since it will result in a more accurate approximation of the contact condition than if it were defined in a Cartesian coordinate system. This can be explained by noting the difference between Fig. 7(a) and (b). The radial gap is implemented in MSC.Nastran [2] as a force calculated using the supplied force vs. penetration and gap size as well as the relative displacement of the previous time step. This method of handling the nonlinearities leaves the left hand side of the equation of motion linear which results in significant time savings in the solution. The disadvantage is that a small time step must be used to ensure stability and accuracy. The accuracy is verified using time step convergence.
Fig. 7: Difference between (a) radial and (b) Cartesian gap
SIMULATION RESULTS
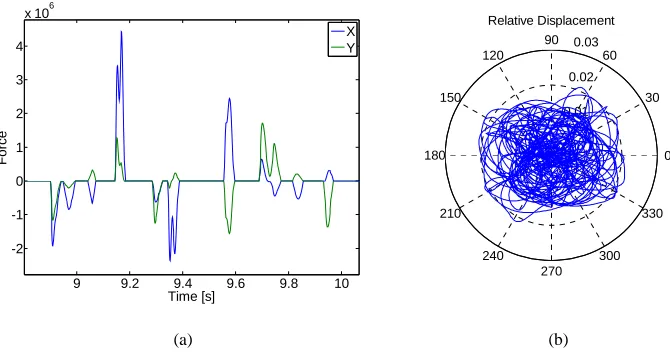
The simulation generates a large amount of data that must be processed efficiently to extract the data of interest. As an example consider that the impact force on the radial restraint assembly is output at 16400 time steps in a Cartesian coordinate system. A typical impact sequence is shown in Fig. 8(a), where the result of interest is only the maximum radial force. Other results that are calculated include shear force and bending moments at the CB and CBSS interface, relative displacement between the CB top plate and the top of the CSC for control rod insertion and the acceleration of the RCS. A typical example of the relative displacement between parts of the model is shown in Fig. 8(b). The runtime for a load case is ~3 min for the solution of the equations of motion and another ~3 min for post-processing of the results which made this model suitable for uncertainty and sensitivity analyses where large numbers of runs are required.
log(k)
Hei
gh
t
(a) (b)
δ
δ
(a) (b)
9 9.2 9.4 9.6 9.8 10 -2
-1 0 1 2 3 4
x 106
Time [s]
Force
X Y
0.01 0.02
0.03
30
210
60
240 90
270 120
300 150
330
180 0
Relative Displacement
(a) (b)
Fig. 8. Typical (a) impact sequence on a restraint (b) relative displacement
SENSITIVITY ANALYSIS
The sensitivities are now calculated by varying the inputs using the design of experiments method. An optimal Latin Hypercube method [3] was used to calculate the design matrix with 25 variables and 150 runs. The variables can be categorised as:
1. Open and closed stiffness of restraints as well as gaps sizes 2. Local stiffnesses
3. Concentrated mass elements 4. Modulus of elasticity of materials
An example of how the force vs. displacement of the Upper Seismic Key (USK) was handled is explained in Fig. 8. It is possible to consider each of the slopes and distances to gap closure as indicated by the dotted line as a variable, but in order to reduce the number of input variables this was not done. Instead an analytical relationship is used to calculate the change in slope as a function of the stiffness of one key (k) and the initial gap (δ).
Fig. 9: Gap stiffness for the Upper Seismic Key δ
Displacement
Fo
rce k
f1(k,δ)
f2(k,δ)
The analysis was automated using commercial software by Engineous to modify the input parameters, submit the job, post process the results using Matlab to extract the required responses and to interpret the sensitivities. A typical Spearman correlation is shown in Fig. 10 where the x-axis is the response quantity under consideration and the bar graphs describe the Spearman correlation of inputs which had a significance level of 0.05. The inputs listed on the figure represent (from top to bottom) the gap at the USK, the CSC Modulus of Elasticity, the mass of the CUD, closed stiffness of the USK and the translational stiffness of the RPV bottom head. Some of these correlations would certainly have been high on the list of suspects of any engineer, for instance the gap size and the closed stiffness of the USK. The effect of the CUD mass and the RPV bottom head stiffness is certainly surprising and requires further investigation.
-0.2 -0.1 0 0.1 0.2 0.3
RPV_CB_VS_HS[0] ULG_SK[0] MASS[1] CSC_MAT[0] ULG_SK[1]
FORCE_ULG_SK[0]
Fig. 10: Spearman correlation for the impact force on the USK
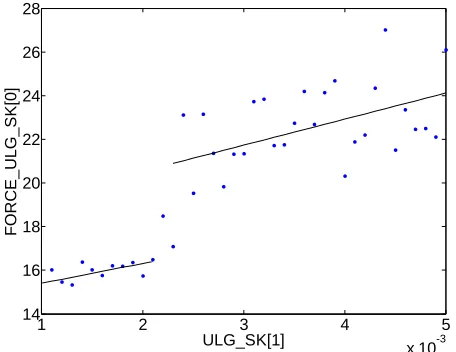
To calculate the sensitivity of the USK force to the gap size the gap size was varied over a large range of values independent of all other variables. The results of this analysis are shown in Fig. 11. A linear regression curve is fitted to both the lower and higher range of results. From the figure it can be seen that there is a sudden change in sensitivity at a gap size of ~0.002. In addition there is more scatter at the larger gap sizes.
1 2 3 4 5
x 10-3 14
16 18 20 22 24 26 28
F
O
R
C
E_
U
L
G
_
SK
[0
]
ULG_SK[1]
Fig. 11: Sensitivity of the impact force on the USK to the gap size
CONCLUSIONS
The sensitivity of the PBMR RU seismic beam model has been presented. The design of experiments method was applied to a nonlinear beam model solved in the time domain. Important sensitivities such as the effect of support gap size on the restraint force was calculated. This analysis aided in understanding the RU model and consequently will aid in improving the seismic design.
REFERENCES
1. Venter, P. J., Mitchell M.N. and Fortier, F., “PBMR reactor design and development”, SMiRT-18, Beijing, pp 4452-4466, 2005.
2. MSC.Software, MSC.Nastran 2004: Reference Manual, p. 315-318, MSC.Software Corporation, Santa Ana, 2004. 3. Engineous Software, iSight-FD 2.5 User’s Guide, Engineous Software Inc., 2005.