The Effects of Selection on Linkage Analysis for Quantitative Traits
Margaret
J. Mackinnon* and Michel A. J. Gorgest
* C U R 0 Division of Tropical Animal Production, Molecular Animal Genetics Centre, Level 3, Gehrmann Laboratories, University of Queensland, St. Lucia, Queensland 4072, Australia, and TGenmart, Inc., Salt Lake City, Utah 84108
Manuscript received October 2, 199 1 Accepted for publication August 14, 1992
ABSTRACT
The effects of within-sample selection on the outcome of analyses detecting linkage between genetic markers and quantitative traits were studied. It was found that selection by truncation for the trait of interest significantly reduces the differences between marker genotype means thus reducing the power to detect linked quantitative trait loci (QTL). The size of this reduction is a function of proportion selected, the magnitude of the QTL effect, recombination rate between the marker locus and the QTL, and the allele frequency of the QTL. Proportion selected was the most influential of these factors on bias, e.g., for an allele substitution effect of one standard deviation unit, selecting the top 80%, 50% or 20% of the population required 2 , 6 or 24 times the number of progeny, respectively, to offset the loss of power caused by this selection. The effect on power was approximately linear with respect to the size of gene effect, almost invariant to recombination rate, and a complex function of QTL allele frequency. It was concluded that experimental samples from animal populations which have been subjected to even minor amounts of selection will be inefficient in yielding information on linkage between markers and loci influencing the quantitative trait under selection.
D
ETECTION of major genes influencing quanti-tative traits is now feasible because of the avail- ability of large numbers of genetic markers covering
the genome (BECKMANN and SOLLER 1983; SOLLER
and BECKMANN 1983; PATERSON et al. 1988; LANDER
and BOTSTEIN 1989; FRIES et al. 1989; GEORCES et al.
1990). These randomly scattered markers can be used to screen the genome for genes with significant effects on traits of economic importance through linkage analysis between marker genotypes and phenotypic trait values.
In plants, suitable experimental populations for linkage analysis are the F2 or backcross progeny of an
F1 population created from a cross between two inbred lines which differ in mean quantitative trait value (SAX 1923; SOLLER, GENIZI and BRODY 1976). In animals, it is more feasible to use large half-sib families of progeny from a single or few sires which are heterozygous at both the marker locus and the
quantitative trait locus (QTL) (NEIMANN-S~RENSEN
and ROBERTSON 1961; GELDERMANN 1975). In this
case the analysis is performed within families thus obviating the need to know a priori linkage phase between the marker and QTL. In both designs the Q T L is detected by a difference in mean quantitative trait value of groups of progeny inheriting alternative marker alleles from their parents by virtue of the fact that they also inherit alternative alleles of a linked QTL.
TO obtain reasonable statistical power to detect QTLs with alleles of medium to small effect (less than
Genetics 132: 1177-1 185 (December, 1992)
half a phenotypic standard deviation), hundreds, or even thousands of progeny must be scored (SOLLER,
GENIZI and BRODY 1976; SOLLER and GENIZI 1978).
Because obtaining suitably large experimental samples will often necessitate sampling from existing commer- cial populations (especially in animals), and/or from field populations exposed to environmental stresses, it is likely that some degree of selection will have occurred within the population prior to trait measure- ment and genotyping, thus introducing bias into the
experimental sample. (Here the term “population”
refers to the progeny derived from a common parent, i,e., the half-sib progeny in animal experiments, or the F2 or backcross progeny in plant experiments. Hence selection pertains to the current generation only, and not to previous generations). An example of where selection can severely bias experimental samples is the
“granddaughter design” (WELLER, KASHI and SOLLER
A.
mortality due to disease or other environmental stresses in plant or animal field populations. It is therefore relevant to determine what effects selection in the experimental sample will have on the outcome of a linkage analysis targeting QTLs influencing the trait under selection.
In qualitative terms the following four effects of within-sample selection are expected. First, selection will increase the frequency of the favorable Q T L allele in the sample. Second, the frequency of the marker linked to the favorable Q T L allele will increase. Third, the relative frequency of recombinants among the favorable QTL-marker genotypes will decrease and among the unfavorable QTL-marker genotypes will increase. Fourth, selection will reduce the total amount of variation in the sample. In this paper a quantitative analysis of the effects of selection on the estimation of Q T L effects and the power with which they are detected is given.
THEORY
The theory described below is developed for the particular case of the half-sib design commonly used in animals. However, the framework is easily adapted to suit the crossed inbred lines design used in plants. I t is also described for the case when the marker and QTL are both diallelic, although the general form of the notation used allows ready expansion to suit mul- tiallelic systems.
Definitions and assumptions: Consider a quanti- tative trait locus with two alleles Q and q where the values of genotypes QQ, Qq and qq are a, d and -a,
respectively. Adjacent to this QTL, at a distance de- fined by a recombination fraction, r, is a codominant marker locus with alleles M and m which have zero direct effect on the quantitative trait. T h e relative frequencies of alleles Q and M in the dam population are
p
and s, respectively, and frequencies of alleles q and m are 1-
p
and 1-
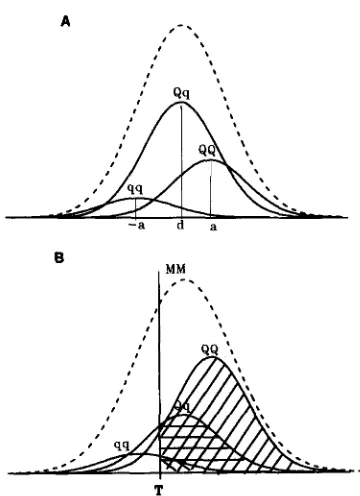
s. Also controlling this quantitative trait are a large number of other genes of small effect acting independently of the QTL. The distribution of the sum of these polygenic effects and random environmental effects, termed polyphenic ef- fects from here on, is assumed to be normal with a mean denoted p and variance denoted v . Thus the distribution of total phenotypic effects is a mixture of three normally distributed subpopulations with differ- ent means, as illustrated in Figure 1A.Now consider that the individuals in this mix of subpopulations are the progeny of a single sire with genotype MQlmq and polyphenic value equal to p . These offspring are divided into three marker geno- type groups, MM, M m and mm for the purposes of linkage analysis. Within each marker group is a mix of the three QTL genotype subpopulations. T h e areas under each Q T L genotype curve represent the fre-
0
M M I
”.
T
FIGURE 1 .-(A) Distribution of quantitative trait showing under- lying Q T L subpopulations. (B) Q T L subpopulations within the MM marker genotype group showing different proportions selected above truncation point, T .
quencies of each marker-QTL genotype. These fre- quencies are functions of recombination fraction, r, and dam Q T L and marker allele frequencies,
p
and s, as shown in Table 1. T h e mix of Q T L genotypes within marker genotype group is illustrated in Figure1B for the M M genotype only.
T h e effects of selection on the means, frequencies and variances of the marker genotype groups, and the resultant effects on power of the experiment are de- scribed in the following sections.
Effects on means and frequencies: In the absence of selection, the expected mean of the jth marker genotype group X,, is the average of the Q T L geno- typic values weighted by their frequencies, viz:
whereJj denotes the frequency of the ith Q T L geno- type ( i = 1,2,3, for QQ, Qq, qq, respectively) within the j t h marker genotype ( j = 1,2,3 for MM, Mm, mm,
respectively) (Table 1) and g, denotes the genotypic value of the ith Q T L genotype where gl = p
+
a, g2= k + d a n d g s = p - a .
TABLE 1
Frequencies of marker-QTL genotypes
Marker genotype QTL
genotype M M M m m m Total
a2
% ( I-
r)ps %rps +%( 1-
r)p( 1 - s) %rp( 1 - s) ‘ / 2 p(24 %( 1 - r)( 1
-
p ) s+
%rps %s[( 1 - r)$+
r( 1-
p ) ] %( 1-
r)p( 1-
s)+
%r( 1 - p)( 1-
s) %+
%(I-
s)[(l - r)(l -P)
+ rPl44 %r( 1
-
p ) s %(1 -r)(l-p)s+Yzr(l %(I - r ) ( l - p ) ( l -s) % ( I-
p )- P ) ( l
-
s)Total %S % %( I - s) 1
Progeny are from a sire with haplotype QM/qm mated to dams at linkage equilibrium with respect to the marker and QTL. p = frequency of QTL allele Q in dam population; s = frequency of marker allele M in dam population; r = recombination rate between the loci.
new genotypic frequencies for the ith Q T L genotype within the jth marker genotype,
f;,
are given by:where w, is the probability from the standard normal distribution that a random variable z exceeds the value
of x,; that is, wi = P ( z
>
xJ. Here the values of x, arex, = ( T
-
a ) / d v , xq = ( T-
d ) / d u and x3 = ( T+
a ) / J u . T h e mean of each of the selected subpopulations is the selection differential, i i , or average deviation from the mean of the individuals with values greater than xidu. The mean of the jth marker genotype group in the selected population,x;,
is then the aver- age of the means of the subpopulations weighted by these frequencies:T h e denominator in Equation 1 represents the total proportion selected i.e. the probability of an animal being in the selected sample relative to the probability
of being in a randomly chosen sample. T h e total proportion selected is denoted h’ from here on and is equal to:
T h e denominators in Equations 1 and 2, denoted hj
and
hi’
in the cases of no selection and with selection, respectively, represent the frequencies of the jth marker genotype relative to an unselected population. By comparing Equations 1 and 2 it can be seen that selection causes a bias, A,, to the jth marker genotype mean which is equal to:Both terms in this equation are always negative when w,
<
1, gl 1 g2 2 g3 and is 2 i2 2 i l>
0. That is, A, isnegative whenever there is selection and thus there is always an upward bias to the marker genotype means caused by selection. Furthermore, it can be shown that the bias is less in the higher means than in lower means so that the contrast between means is reduced. For example, the contrast between marker groups M M and m m , assuming that r = 0, is equal to:
x,’
-
573’ = a [ p w ,+
(1-
p)w3] d W p ( l-
2 p )
which, when there is some selection, i.e., w,
<
1, is less than the contrast when there is no selection which is:x,
-
573 = a+
d(1-
2 p )T o understand the various causes of this bias it is useful to break down the above equations into their components. From Equation 2 it can be seen that there are two influences of selection on the marker genotype means which can be considered independ- ently. First, selection influences the means of the Q T L genotype subpopulations by acting on the polyphenic component to cause positive selection differentials, ii. Thus selection causes the random variation due to polygenes or environment, which is not able to be accounted for by the model under analysis, to become confounded with the Q T L genotype effects. Higher selection differentials in the low-value Q T L genotypes than in the high value Q T L genotypes reduces the difference between the mean quantitative trait value of the group. T h e bias caused is a function of the relative value of the selection differentials, iC which are functions of the relative truncation point, T
-
g,, in each QTL subpopulation.where k denotes only those frequencies involving re- combinant types, as indicated by the coefficient r in the terms given in Table 1. For example,
rIpw2
+
(1-
$)us] r l ’ =[( 1
-
r ) p w+
(1-
r-
p
+
2rp)wz+
r( 1-
p)w 3]‘From this equation it can be seen that whenever wz is greater than w3 , which will occur if there is selection and there is incomplete dominance, the effective re- combination rate in the MM genotypic group is less than the true value of r . Similarly, it can be shown that r3’ becomes greater than r with selection, and r2‘ becomes greater or less than r depending on the values of
p
and s. Overall, the effective recombination ratei n the whole sample, r’, is:
which can be shown to equal r .
Similarly, the effective QTL allele frequency after selection within each marker genotypic group, pj’, is:
where k denotes those frequencies in Table 1 with coefficients of
p .
If wi>
wi-l then p,‘ is always greater thanp .
Some of this increase inp
within marker groups can be reconciled with the changes in recom- bination frequency within groups described above. That is, in the MM group recombinant gametes from the sire ( M q ) are selected against, and in the mm group recombinant gametes ( m Q ) are favored by selection thus producing an increase inp
in all groups. How-ever, most of the increase in
p
is independent of changes in rj’ as can be seen by solving Equation7
with r = 0 and from the equation for overall frequency in the selected sample,
p ‘ ,
viz:I - p w ,
+
pwz-
p w,+
w2+
( 1-
p)w3’T h e frequencies of the marker genotypes after selec- tion, oJ’, are given by:
Although these frequencies do not have an influence o n the marker genotypic means as r and
p
do, the influence of selection on them is still of interest for the following reason. In the absence of selection (it?., wi = 1, i = 1,2,3) the values of 0,’ equal %s, I/z andI h ( 1
-
s) for the M M , M m and rnm groups, respectively. Departure of observed frequencies from expected frequencies indicates that the sample has been selected with respect to t h e QTL, assuming that there is no other reason for such distortion. The value of s canbe estimated either from an independent unselected sample of the population, or from the dams if they are selected with respect to the general population. Then a chi-squared statistic
(xs2)
can be calculated from the observed and expected genotype frequencies which takes the following expected value:Because one expected genotype frequency is always estimated from the other genotype frequencies, the value is tested on 2 d.f. T h e power of this test (1
-
P)
to detect a segregating Q T L for a given type 1 error of CY is:1
-
P
= 1-
P(x:<
x
:
)
where P(x:
<
xa’)
is the probability from a noncentral chi-squared distribution with noncentrality parameterxs2
of getting a value less thanxa2
which is the chi- squared value for a type 1 error of CY on 2 d.f.Testing for distortion at the marker locus (termed here “selection distortion” to distinguish it from “seg- regation distortion” which implies that sire gametes segregate unevenly) is one way to test for linkage to a
QTL. The alternative and more conventional method
is to compare the variance generated by differences between means of marker genotypic groups with the unexplained or residual variance, i e . , perform an F- test. Thus we return to consider the effects of selec- tion on the variances between and within the marker genotypic groups.
Effects on variances: First, the variance due to the QTL, or the between-marker variance, when there has been selection, V‘, is:
where
x’
is the overall mean of the selected sample. Because the contrasts between the means are reduced by selection, V’ is also reduced relative to the corre- sponding between-marker variance when there is n o selection, V.Second, the residual or within-marker genotype variance is affected by selection in two ways. First, truncation selection acts to reduce the random poly- phenic variance within the ith QTL subpopulations by a factor (1 - k,) where k, = ii(ii
-
x i ) (FALCONER1989) so that the polyphenic variance within the j t h marker genotype groups, vj’, ignoring heterogeneity of variances between the subgroups is:
Selection Bias in Linkage Analysis
which is always less than v when there is selection. There is an additional source of variation which contributes to the residual variance within marker groups. This extra variance is due to the mixture of
non-recombinant and recombinant genotypes, and
hence mixture of QTL genotypes, within marker
subgroups. Here it is termed the recombination vari- ance, is denoted c,‘ for a selected population, and is calculated as follows:
I n the presence of selection cj’ is always less than the recombination variance when there is no selection, denoted cJ.
The total residual variance in a selected sample, e‘, is then:
which in the presence of selection is always less than the residual variance when there is no selection, de- noted e .
Thus all components of variance, V , v and c, are reduced by selection, although to different degrees. Thus power is expected to be affected by selection in a complex way. This will now be examined.
Effects on power: For an unselected population the F-test statistic is F, = V / e and for a selected population is F,’ = V‘/e’. Since the number of progeny required to yield a given level of power is proportional to these variance ratios, the relative number of progeny from a selected population, RN, required to yield equivalent power to an unselected population is:
R N = - F,
F, ”
T h e power (1
-
P)
of the F-test to detect the Q T L with a type 2 error ofp
is:1 -
P
= 1-
P(Fs<
(18)where P(F,
<
F u / 2 ) 2 , n is the probability from a non- central F-distribution with a noncentrality parameter,F,,
of getting a value of less than F n / 2 where Fa/2 is the central F-value for a type 1 error of a on2
and ndegrees of freedom, and n is the number of progeny in each marker genotypic group.
Efficiency of selection: T h e above theory has as- sumed that selection occurs by truncation only, i e . , that all animals above the truncation point comprise the sample. In practice, however, the mode of selec- tion will usually be based on multiple criteria and
9
i
l m 1 -g
0.6 -0 )
1.0
-
c,0
h Q,
2
0.0 -z
(d-0.1 -
‘\
‘
mm‘
\
-1.0
1
I I I I I I I 1 I 10.0 0.8 0.4 0.0 0.0 1 .o
Proportion selected
FIGURE 2,”Means of marker genotype groups as functions of proportion selected for a QTL with parameters a = 1, d = 0.2, r = 0.1 and p = 0.2.
consequently selection will be less severe. When the efficiency of selection, denoted b, is less than loo%, the selection differentials, ii, will be reduced to bii. The equations above can thus be modified to account for selection efficiency by replacing all ii terms with bi,.
NUMERICAL RESULTS
The equations described above were solved for values of the proportion selected, h’, ranging from 0 to 1 a n d f i x e d v a l u e s o f v = 1 , a = I , d = 0 . 2 , r = O . l ,
p
= 0.2 and s = 0.7. Simulated data were used to check that these theoretical predictions were correct. Figure 2 shows that as the proportion selected de- creases (;.e., selection intensity increases) the differ- ence between the means of the marker genotypicgroups decreases considerably. When 50% are se-
lected the difference between
M M
and m m is reduced to about one quarter of this difference when there is no selection, and when only 10% are selected this reduction is about 12-fold. Thus the size of the Q T L effect estimated from the difference between marker means is severely biased downwards by selection.Figure 3 shows how the relative frequencies of the marker genotypes alter with selection. As selection intensity increases, the frequencies of the homozy- gotes deviate further from their expected values (0.35, 0.5 and 0.15 for M m and mm, respectively) thus producing selection distortion. When the proportion selected is 50%, the deviations of observed genotype frequencies from their expected frequencies for
M M ,
J.
01
a
4 h
0 0.3
4
L, 0.2 -
0,
2
mm""
2
0.1-
""
" " - *
"_""
_"""
."
0.0 I I I I I I I I I I
0.0 0.2 0.4 0.6 0.8 1 .o
Proportion selected
FIGURE 3.-Marker genotype frequencies as functions of pro- portion selected for a Q T L with parameters a = 1, d = 0.2, r = 0.1
and p = 0.2.
I
.
.
.
.
.
.
0.2
-
.
.
Mm
.
.
.
-
"-
.
.
.
"
-
.
.
"
0.1
-
.-""""""."""
I I I I I I I I 1
0.0 0.2 0.4 0.6 0.8 1 .o
Proportion selected
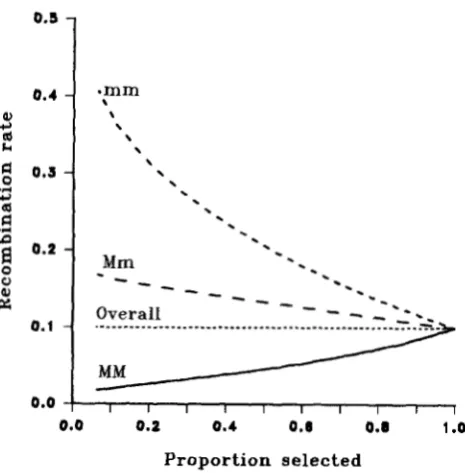
FIGURE 4.-Effective recombination rates within marker geno- type groups and over the whole population as a function of propor- tion selected for a Q T L with parameters a = 1 , d = 0.2, r = 0.1 and p = 0.2.
proportion selected is approximately linear.
Figure 4 shows the effective recombination frac- tions within the marker genotype groups, rj', and in the whole selected population, r', as a function of the proportion selected. Within the M M group, which is
in coupling phase with the most favorable Q T L gen- otype, r2(2, the effective recombination rate is reduced with selection, whereas in the m m group, recombi- nants are favored by selection thus increasing this group's effective recombination rate. In this particular
n
1
0.5 0.6 0.7 0.8 0.9 1 .o
Proportion aalected
5
2
1 .o
<
z.
a m 0.5
0.0
FIGURE 5.-Components of variance (right axis) and relative number (left axis) for 100% selection efficiency (-) and 50% selection efficiency (- - -) as functions of proportion selected for a QTL with parameters a = 1 , d = 0.2, r = 0.1 andp = 0.2. example the effective recombination rate in the
Mm
group increases as selection intensity increases, but will decrease for different marker allele frequencies. Even though the effects on effective recombination rate within marker groups do not cancel out, after weighting these r','s by their respective marker gen- otype frequencies to calculate the overall effective recombination rate, r', there is no net effect of selec- tion on recombination rate in the total sample (Figure 4, Equation
7 ) .
Figure 5 shows the effects of selection (ranging from
50% selected to 100% selected) on the polyphenic variance, v ' , the recombination variance, c', and the major gene variance, V', relative to the total variance (right axis). Also shown (left axis) is the corresponding relative number of offspring ( R N ) to achieve equiva- lent power to that of an unselected sample when efficiency of selection is 100% or 50%. As selection intensity increases, the proportion of variance ac- counted for by the marker decreases relative to the residual variance so that R N increases. For 100% efficiency of selection, when the proportion selected is 80%, 50% and 20% (not shown) the corresponding values of RN are 2.0, 5.7 and 24. These figures are approximately halved when efficiency of selection is only 50%. When more than 50% are selected the relationship is approximately linear, but below this RN increases dramatically as proportion selected de- creases (data not shown). T h e results shown in this figure highlight the fact that even small amounts of
selection can significantly increase the required size of an experiment designed to deliver a given level of
power.
selected is 50%. For each parameter varied, other parameters were fixed at 0 or a constant in order to isolate the effects of each parameter. Thus when r was varied,
p
was set to 0 and gene effects to u = 1 and d = 0.2. Whenp
was varied, r was set to 0 and gene effects to a = 1 and d = 0.2. T o vary ii, the additive component of the gene effect, a, was varied from 0 to 1, d was set to 0.2 and r andp
were both set to 0. T h e figure illustrates that r has relatively little influence on RN,p
has a relatively large influ- ence, and additive gene effect, a, has a moderate influence over the range examined. The positive re- lationship with the size of gene effect, a, can be explained by the fact that as the difference between the means of the QTL genotypes increases, the value of the selection intensity in the unfavorable genotype, is, becomes larger relative to the selection intensity in the favorable genotype, i,, thus causing a greater reduction in the difference between the genotype means. T h e variation in R N withp
arises from the fact that whenp
is low, the higher selection intensity in the unfavorable genotype, is, has greater influence because of the higher frequency of this genotype. Asp
increases, the proportion of the favorable genotype increases so that the influence of its lower selection intensity, i l , on the means is increased. At some point the combined effect of differential selection intensities and the frequencies of the Q T L genotypes comprising the mix produces a minimum difference between the means and hence a maximum R N . This maximum will depend on proportion selected and the size of the gene effects, a and d . T h e parameters discussed above will also influence RN through their effects on the residual variances, but these are likely to be relatively small compared to their influences on the between- marker variance and so were ignored for this exercise.0.0
4
0.0 0.8 0.4 0.6 0.8 1 .o
Proportion releckd
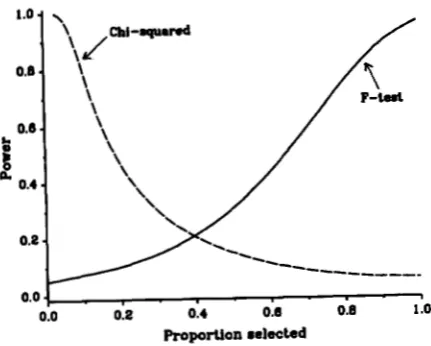
FIGURE 6.-Power of the F-test and chi-squared test to detect a Q T L with parameters a = 1 , d = 0.2, r = 0.1 and p = 0.2 using 200 progeny from one sire.
7 1
0.0 0.2 0.4 0.6 0.8 1 .o
Parameter value
FIGURE 7.-Relative number as a function of QTL allele fre- quency, p . (-), recombination rate, r, (--) and size of allele effect, a, (- - -) when the proportion selected is 50%.
ence between the marker genotype means regardless of selection. T h e total sample size, N , used for these calculations was 200 which gives 96% power to detect the QTL with effects a = 1 and d = 0.2 for r = 0.1 and
p
= 0.2 when there is no selection in the sample. T h e figure shows that as selection intensity increases, the power of thex2
test increases and the power of the F-test decreases. In this example, when the pro- portion selected is less than 40% thex2
test is more powerful and is the preferred choice of test, although in practice both tests would be performed. As the sample size or the magnitude of the gene effect in- creases, the F-test becomes relatively more powerfulso that the point of equivalent power is shifted left- ward, i.e., to a point of higher selection intensity. Thus when sample size or the magnitude of the gene effect
is large enough, two powerful, though not completely independent tests can be used to detect linkage.
Figure 7 shows the effects on R N of each of the parameters determining the magnitude of the selec- tion bias, namely r,
p
and ii, when the proportionDISCUSSION
two forms of disequilibria is to erode the complete disequilibrium which the design of the experiment deliberately creates and exploits, and thereby reduce the power of the experiment to yield information on QTLs.
Selection bias in large samples of animals or plants obtained from commercial or field populations col- lected for the purpose of detecting QTL through linkage analysis is likely to be prevalent. This study has shown that selection within the experimental sam- ple severely biases the magnitude of the QTL effects and reduces the power with which they are detected. Thus where selection is a typical feature of the popu- lation, experimenters must sample to avoid these se- lection effects. For dairy populations, when the grand- daughter design is used, this would mean ensuring that enough semen for genotyping from all progeny tested young bulls was retained by the artificial insem- ination organizations. If the daughter design is being used, i e . , quantitative trait evaluation is done directly on the cows, then if selection on milk production throughout life is appreciable, only records from first lactation cows should be used, unless lifetime evalua- tions are adjusted for selection and material for gen- otyping is collected prior to any culling. Similarly, in any population where the experimenter is unable to eliminate artificial or natural selection, steps should be taken to collect material for genotyping and eval- uate phenotypes before selection has occurred.
T h e study showed that the power of the F-test when there is selection is reduced and that the extra number of progeny required to counteract the loss of power is large. Thus calculations of experimental size re- quired to deliver a given power must take into account this loss of efficiency. On the other hand, the power of the chi-squared test to detect linkage through dis- tortion of marker frequencies increases as selection intensity increases, thus providing an alternative test. ideally, the two tests could be combined to give an overall higher power than the single most powerful test. However, because these tests are not independ- ent, the theoretical expectations of type 1 and type 2 errors for a combined test are difficult to derive. An alternative approach is to find the power empirically
using computer simulated data under a maximum
likelihood model which combines information on fre- quencies and means. The predicted power of the chi- squared test presented here is an overestimate to empirical power because when diallelic markers are used, marker frequencies must be estimated from the population and thus contain some error. When po- lyallelic markers are used, the segregation of the sire’s alleles can be determined unambiguously in the ma- jority of the progeny thus giving a more accurate measure of selection distortion.
The study also showed that the effective value of
the Q T L parameters in the selected sample were biased from the true values. Thus QTL estimation procedures used on selected data must account for this bias. This can only be done if the degree of selection is already known from an independent analy- sis. If the truncation point and efficiency of selection is known, the likelihood models used to estimate Q T L effects and recombination fractions (e.g., LANDER and
BOTSTEIN 1989; KNAPP, BRIDGES and BIRKES 1990) could be modified to incorporate these parameters. Further work is required to determine whether se- lected samples contain enough information to feasibly estimate these parameters in sample sizes commonly used in linkage experiments.
T h e unfavorable effects of selection on marker- Q T L linkage analyses share the same basis as the favorable effects which two-tailed selection or “selec-
tive genotyping” exploit (LEBOWITZ, SOLLER and
BECKMANN 1987; LANDER and BOTSTEIN 1989; DAR- VASI and SOLLER 1992). Selective genotyping causes
positive associations or disequilibrium between marker-QTL genotypes and polyphenotypes, whereas one-tail selection causes negative associations. An analysis of the power of selective genotyping by DAR- VASI and SOLLER (1992) showed that almost 100% of
the information used in a linkage analysis is obtained from the top 25% and bottom 25% tails of the distri- bution. In the light of their result, the observation in the present study of a dramatic loss of power when the bottom tail of the distribution is eliminated is not surprising.
This study has considered the effects of selection occurring only within the experimental sample. There are other forms of selection operating in the popula- tion that may also affect the sample which should be considered. For example, what are the effects of se- lection among the dams and sires of the progeny in the sample, and what influence does information from relatives in the selection criterion have on the results described here? These issues will now be briefly dis- cussed.
With time, selection will simultaneously increase the average polygenic value of the population and the frequency of favorable QTL alleles thus potentially introducing bias through the dams and sires of prog- eny used in the linkage experiment. When there is a
genetic trend in the dam population, progeny from younger dams will have higher frequencies of both the favorable QTL allele and high value polygenes than progeny from older dams. T h e group of progeny which inherit the favorable Q T L allele from their dams will therefore have on average higher polygenic value than the group of progeny which inherits the unfavorable Q T L allele. Unless this trend is ac- counted for in the analysis, the value of the Q T L in
QUINTON and VAN ARENDONK
1992).
On the other hand, selection will generate negative linkage disequi- librium between the QTL and polygenes which will reduce the apparent QTL effect (SAEFUDDIN and GIB-SON 1991 ; J. GIBSON, personal communication). How- ever, both of these conclusions are relevant only when analyses are done at the population level. In most linkage experiments in animals, Q T L effects are meas- ured within sire families. Since dam alleles segregate independently of sire alleles and the analysis involves contrasts only between progeny inheriting alternative sire alleles, the bias to dam allelic effects has no net effect. Thus selection in the dams will not influence the power of the linkage analysis.
There is, however, another source of bias from the dams that was not accounted for in this study. Linkage disequilibrium between the marker locus and QTL within the dam population will increase the sire allele contrasts when disequilibrium is in the same direction as the phase of the sire, and will reduce the contrasts if it is in the opposite direction. Such disequilibrium may arise through selection, but may also result from random genetic drift or a recent hybridization event. With the small effective size and the high intensities of selection characteristic of many commercial animal populations, significant amounts of disequilibrium be- tween QTLs and markers are expected, and thus selection trend in the dams may have significant influ- ences on the power of half-sib linkage experiments.
Selection among the sires will not influence the estimates of Q T L effects within sire. However, it will indirectly influence the power of linkage experiments through its influence on QTL allele frequency which determines the probability that the sires used in the experiment are heterozygous at the QTL and there- fore informative.
Selection of progeny on the basis of predicted ge- netic merit based on ancestors' information only, e.g., preselecting young bulls for entry into a progeny- testing scheme, will also have no effect on the outcome of a within-sire linkage analysis. This is because selec- tion decisions contain no information on which QTL allele the progeny inherited from the sire. However, if the selection criterion contains information on either the descendants of the progeny in the sample o r on the progeny itself, there will be selection bias for the reasons described in this study.
The authors acknowledge the contributions of M. SOLLER, A. DARVASI and H. BOVENHUIS through useful discussions on the study. T h e work was undertaken while MJM was on study leave with the support of Commonwealth Scientific and Industrial Research Or- ptnization, Division of Tropical Animal Production, Australia, and the Australian Meat and Livestock Research and Development Corporation.
LITERATURE CITED
BECKMANN, J. S., and M. SOLLER, 1983 Restriction fragment length polymorphisms in genetic improvement: methodologies, mapping and costs. Theor. Appl. Genet. 67: 35-43.
BULMER, M. G . , 1971 The effect of selection on genetic variabil- ity. Am. Nat. 105: 201-211.
DARVASI, A,, and M. SOLLER, 1992 Selective genotyping for de- termination of linkage between a marker locus and a quanti- tative trait locus. Theor. Appl. Genet. 70: 2000-2012. FALCONER, D. S., 1989 Introduction to Quantitative Genetics, Ed. 3.
Longman, New York.
FRIES, R., J. S. BECKMANN, M. GEORGES, M. SOLLER and J. WOMACK, 1989 The bovine gene map. Anim. Genet. 20: 3-29.
GELDERMANN, F., 1975 Investigations on inheritance of quanti- tative characters in animals by gene markers. 1. Methods. Theor. Appl. Genet. 4 6 319-330.
GEORGES, M., A. MISHRA, L. SARGEANT, M. STEELE and X . ZHAO, 1990 Progress towards a primary DNA marker map in cattle. Proc. 4th World Congr. Genetics Appl. Livest. Prod. Edin- burgh 13: 107-112.
KENNEDY, B. W., M. QUINTON and J. A. M. VAN ARENDONK,
1992 Estimation of effects of single genes on quantitative traits. J. Anim. Sci. 7 0 2000-2012.
KNAPP, S. J., W. C. BRIDGES and D. BIRKES, 1990 Mapping quantitative trait loci using molecular marker linkage maps. Theor. Appl. Genet. 7 9 583-592.
LANDER, E. J., and D. BOTSTEIN, 1989 Mapping Mendelian factors underlying quantitative traits using RFLP linkage maps. Ge- netics 121: 185-199.
LEBOWITZ, R. J., M. SOLLER and J. S. BECKMANN, 1987 Trait- based analyses for the detection of linkage between marker loci and quantitative trait loci in crosses between inbred lines. Theor. Appl. Genet. 73: 556-562.
tion between blood groups and several production character- istics in three Danish cattle breeds. Acta Agric. Scand. 11: 163-
196.
PATERSON, A. H., E. S. LANDER, J. D. HEWETT, S. PETERSON, S. E. LINCOLN and S. D. TANKSLEY, 1988 Resolution of quantita- tive traits into Mendelian factors using a complete linkage map of restriction fragment polymorphisms. Nature 335: 721-726. SAEFUDDIN, A,, and J. P. GIBSON, 1991 Selection response in
populations with a transgene (abstr.). J. Anim. Sci. 69 (Suppl. 1):215.
SAX, K . , 1 9 2 3 T h e association of size differences with seed-coat pattern and pigmentation in Phaseolus vulgaris. Genetics 8: 552-556.
SOLLER, M., and J. S. BECKMANN, 1983 Genetic polymorphisms in varietal identification and genetic improvement. Theor. Appl. Genet. 67: 25-33.
SOLLER, M., and A. GENIZI, 1978 T h e efficiency of experimental designs for the detection of linkage between a marker locus and a locus affecting a quantitative trait in segregating popu- lations. Biometrics 3 4 47-55.
SOLLER, M., A. GENIZI and T. BRODY, 1976 On the power of experimental designs for the detection of linkage between marker loci and quantitative loci in crosses between inbred lines. Theor. Appl. Genet. 47: 35-39.
WELLER, J. l., Y. KASHI and M. SOLLER, 1990 Power of daughter and granddaughter designs for determining linkage between marker loci and quantitative trait loci in dairy cattle. J. Dairy Sci. 73: 2525-2537.
NEIMANN-SeRENSEN, A., and A. ROBERTSON, 1961 The associa-