An in-vitro evaluation of the capacity of
local Tanzanian crude
clay and ash based materials
in binding aflatoxins in solution
1,3
Ayo E. M;
2G. H. Laswai;
1A. Matemu;
1M. E. Kimanya*
1 The Nelson Mandela African Institution of Science and Technology, P.O. Box 447, Arusha.
Tanzania
E-mails:
ayoe@nm-aist.ac.tz
;
matemu.athanasia@nm-aist.ac.tz
:
kimanya.martin@nm-aist
2 Sokoine University of Agriculture, P.O. Box 3004, Morogoro. Tanzania, E-mail:
laswaig@sua.ac.tz
3 Institute of Rural Development Planning, P.O. Box 138, Dodoma, Tanzania, E-mail:
eayo@irdp.ac.tz
*The corresponding author, email:
kimanya.martin@nm-aist
Corresponding author: Prof Martin E. Kimanya (Associate Professor of Food safety and Nutrition Sciences)
P.O. Box 447, Arusha. Tanzania
; e-mail: martin.kimanya@nm-aist.ac.tzAbstract
Aflatoxins in feeds cause great health hazards to animals and in advance, to human. Potential of crude clays designated AC, KC, CC and MC and ashes VA and RA were evaluated for their capacity to adsorb aflatoxins B1 (AFB1), B2 (AFB2), G1 (AFG1) and G2 (AFG2) relative to a commercial binder
MycobinderR (Evonik Industries AG) using in-vitro technique. On average, CC, VA, KC, MC, AC, RA and
MycobindR adsorbed 39.9%, 51.3%, 61.5%, 62.0%, 72.6%, 84.7% and 98.1% of the total aflatoxins in
buffered solution, respectively. The capacity of AC and RA was statistically (p<0.05) better in binding aflatoxins next to MycobindR. Capacity of the TBM and MycobindR to bind aflatoxins, seemed to follow
the trend of their cation exchange capacity (CEC). The CEC (meq/100g) of CC, MC, KC, VA, AC, RA and MycobindR were 7.0, 15.4, 18.8, 25.4, 27.2, 27.2 and 38.9, respectively. On average 96.3%, 42.7%,
80.8% and 32.1% of AFB1, AFB2, AFG1 and AFG2 were adsorbed, respectively. Binding capacity of the clays and ashes relative to MycobindR was about 100% for AC and RA, 50% for KC, MC and VA
and 33.3% for CC. The AC and RA seem to be promising resources in binding aflatoxins in solution.
Keywords: Clays, Ashes Aflatoxins, Binding capacity, In-vitro and Contaminated feeds
1.0Introduction
Aflatoxins are natural toxins produced in foods and feeds, primarily, by certain species of fungi, specifically Aspergillus flavus and Aspergillus parasiticus, when conditions are favourable for fungal growth and subsequent toxin formation. Aflatoxins exist in four forms of health, agricultural and economic importance, namely aflatoxin B1 (AFB1), B2 (AFB2), G1 (AFG1) and G2 (AFG2) (1, 2, 3). The most toxic and abundant aflatoxins is AFB1 (4). Almost all feed resources contain certain levels of naturally occurring aflatoxins and any level of dietary aflatoxins poses a certain level of health risk (5). Studies show that aflatoxins in feeds depress growth and production performance of animals (6, 7). When animals are fed naturally aflatoxin-contaminated feeds, the toxins (mostly AFB1) are secreted in cow milk or retained in hen eggs as aflatoxin M1 (AFM1) (8, 9, 10).
and treatment of the feeds with acidic or alkaline solutions, ozone treatment and ammoniation as chemical techniques and detoxification by microbial agents as biological techniques (11, 12). These techniques are mostly applied in the animal industry and are reported to have some limitations including costs implications, requirement of some complicated facilities, reduction of dietary palatability and nutritional values, also creating danger of unsafe chemical residual (13). Techniques involving toxin binders (also called adsorbents or sequesters) have been employed owing to their economic feasibility, applicability and nutritional safety.
Many types of crude or refined materials including clays, cellulose products, yeast cell wall products and activated charcoal products are envisaged to have ability to sequester or bind aflatoxins (14, 15, 16). The potential binding capacity of these materials are known to vary depending on their nature and source (17). According to Kannewischer et al. (18); Vekiru et al., 2007(cited by Vekiru et al. (17) there is no existing clear generic linear relationship between binding effectiveness and specific adsorbent properties, such as elemental and mineralogical content, cation exchange capacity (CEC) and pH levels of materials. The binding potential of some materials particularly clays seems to be the function of their chemical composition, such as Ca+
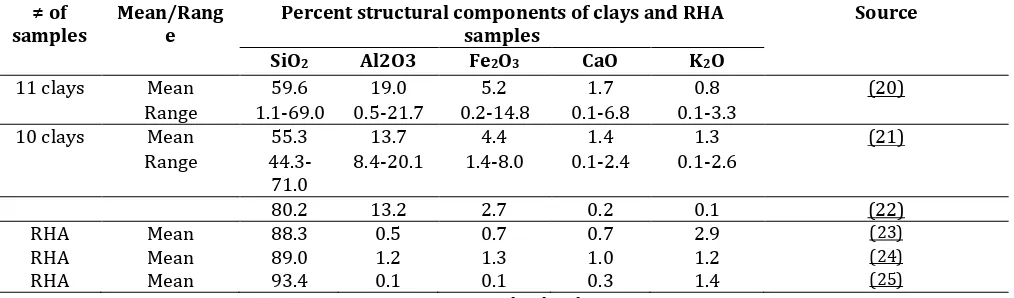
and K+ ions present in the framework configured by Silicon, Aluminium and Iron oxide. Studies
show that Alumino-silicates have wide variation of these elements (Table 1). In South American countries, ashes such as soda ash and wood ash have been used in some food processes such as in niztamalization for corn tenderization where dietary aflatoxins load is also reduced owing to breakage of aflatoxin lactone-ring by the ash alkalinity (19). In Tanzania farmers are using an imported binder that has proven to be useful in terms of protecting livestock from aflatoxin exposure. However, the imported binders are expensive; the high cost of importing these products which are clay-based materials can be avoided if local resources and sources with similar potential are identified. Our experience in animal husbandry in Tanzania shows that there is a number of clay and ash based materials directly eaten by human or added to feeds and foods for various purposes.
Table 1: Percent structural components in clay samples and Rice-husk ashes
collected from various locations
≠ of samples
Mean/Rang e
Percent structural components of clays and RHA samples
Source
SiO2 Al2O3 Fe2O3 CaO K2O
11 clays Mean 59.6 19.0 5.2 1.7 0.8 (20)
Range 1.1-69.0 0.5-21.7 0.2-14.8 0.1-6.8 0.1-3.3
10 clays Mean 55.3 13.7 4.4 1.4 1.3 (21)
Range 44.3-71.0
8.4-20.1 1.4-8.0 0.1-2.4 0.1-2.6
80.2 13.2 2.7 0.2 0.1 (22)
RHA Mean 88.3 0.5 0.7 0.7 2.9 (23)
RHA Mean 89.0 1.2 1.3 1.0 1.2 (24)
RHA Mean 93.4 0.1 0.1 0.3 1.4 (25)
RHA: Rice-husk ash
The clay based materials are sold for geophagia purposes, mostly demanded by some groups of women especially pregnant ones. Ashes have been used in traditional cookery of some local foods such as corn recipes and in feeds as ration improvers or appetisers.
The objective of the study was therefore to evaluate the chemical composition and the capacities of the above mentioned materials in binding aflatoxins.
2.0 Results
2.1 Chemical composition of the TBM and MycobindR
The major minerals contained in the TBM and MycobindR are presented in Table 2. Muscovite
minerals was observed in AC and KC, Kaolinite in CC and MC, Leucite in MC, Microline and Ephicite in VA, Albite and Terranovite in RA, Metanatrolite and Phlogopite in MycobindR.
Table 2: Mineralogical and chemical composition of the TBM and MycobindR
TBM and MycobindR ID
Prominent Minerals Chemical formula
AC Muscovite KAl2(AlSi3O10)(F,OH)2
Hematite-proto Fe1.9H0.06O3
KC Quartz SiO2
Muscovite KAl2(AlSi3O10)(F,OH)2
Lizardite Mg
3Si2O5(OH)4
CC Kaolinite Al2Si2O5(OH)4
MC Kaolinite Al2Si2O5(OH)4
Leucite K[AlSi2O6]
Lizardite Mg3Si2O5(OH)4
VA Pigeonite (Ca, Mg, Fe) (Mg, Fe)Si2O6
Microcline KAlSi3O8
Ephesite NaLiAl2 (Al2Si2)O10(OH)2
RA Albite NaAlSi3O8 or Na1.0–0.9Ca0.0
Terranovaite NaCaAl
3Si17O408H2O
Sepiolite Mg4Si6O15(OH)2·6H2O
MycobindR Metanatrolite Na2Al2Si3O10
Phlogopite KMg3(AlSi3O10)(F,OH)2
Andradite /Melanite Ca3Fe2(SiO4)3
The elemental-oxide composition of the TBM and MycobindR is shown in Table 5. All samples of
the TBM and MycobindR contained Aluminium and Silicon elements as backbone of the minerals.
Other important elements observed as parts of the chemical formula of the prominent minerals in the TBM and MycobindR were Iron in AC, VA and MycobindR, Calcium in VA, RA and MycobindR,
Potassium in all materials except CC and RA. The VA and MycobindR had minerals containing all
the main elements Aluminium, Silicon, Iron, Calcium and Potassium.
RA showed the lowest content of Aluminium oxide (alumina) of 0.5%, all the other TBM had content above that of MycobindR at 5.1%. Percent Silicon oxide (Silica) contents in CC and RA were
above that of MycobindR while the TBM had contents from 22-32.8%; a level lower than that of
MycobindR (49%). The VA and RA had percent contents of Potassium oxide a little bit higher than
that of MycobindR. The VA had Calcium oxide a bit higher than that of MycobindR while the rest of
the TBM had percent contents below that of MycobindR. The AC and RA had the highest and the
The values of CEC for the TBM are also shown in Table 05. The values of CEC for the TBM ranged from 7 meq/100g for CC to 27.2 meq/100g for RA. All the TBM had lower values of CEC compared to that of MycobindR (38.9 meq/100g).
CEC, Cation exchange capacity
2.2 Capacity of the binders to bind aflatoxin
Percent aflatoxin binding capacity for the TBM are presented in Table 3 (across the columns). The percent binding capacity of the TBM ranged from a minimum value of 40 for CC to a maximum value of 85 for RA relative to 98 for the MycobindR. The mean proportions of aflatoxins as
adsorbed by the TBM and MycobindR are also shown in Table 6 (across the rows). Proportions of aflatoxins adsorbed were relatively high for AFB1 and AFG1 and low for AFG2 and AFB2.
Table 3: In-vitro binding capacity of various clay and ash based materials for aflatoxins
TBM identity Mean percent of bound individual aflatoxin Mean percent of total aflatoxin
bound
SEM
AFB1 AFB2 AFG1 AFG2
AC 97.9 60.6 99.9 32.2 72.6ab 32.5
KC 95.4 40.1 96.1 14.5 61.5bc 40.9
CC 96.6 14.4 31.3 17.3 39.9c 38.5
MC 95.6 32.6 94.6 25.3 62.0bc 38.3
VA 97.9 28.9 71.5 30.7 57.3bc 33.5
RA 94.6 79.8 91.5 72.7 84.7ab 10.2
MycobindR 97.7 99.2 98.8 96.4 98.1a 1.3
Mean 96.5a 50.8b 83.4a 41.3b
SEM 1.4 30.4 24.9 31.0
SEM = Standard error of the means; Means with similar superscripts do not differ significantly
Figure 1: Relationship between values of CEC and the elemental-oxide concentration in TBM
Figure 2: Relationship between percent binding capacity of TBM and their chemical components
Relationship between the binding capacity and CEC of the TBM with respect to their chemical factors is shown in Figure 3. The relationship presented as correlation coefficient was as high as 0.9.
-1 -0.8 -0.6 -0.4 -0.2 0 0.2 0.4 0.6 0.8
Al2O3 SiO2 K2O CaO Fe2O3
C
o
rr
e
la
ti
o
n
c
o
ef
fi
ci
e
n
ts
Elemental oxides of BMs
-1 -0.5 0 0.5 1
Al2O3 SiO2 K2O CaO Fe2O3 CEC
C
o
rr
el
at
io
n
c
o
ef
fi
ci
e
n
ts
Table 4:
The major elemental-oxides composition of the TBM and Mycobind
RTBM/Mycobind
R
Elemental-oxide composition of the TBM and MycobindR (%) CEC (meq/100g)
Al
2O
3SiO
2K
2O
CaO
Fe
2O
3AC
18.0
26.0
0.22
0.79
45.31
27.2
KC
25.0
31.0
0.01
0.24
39.73
18.8
CC
32.8
61.3
0.63
0.49
2.14
7.0
MC
24.0
34.8
0.52
0.54
36.1
15.4
VA
15.0
22.0
8.78
14.9
26.2
25.4
RA
0.5
75.7
9.54
1.71
0.59
27.2
Mycobind
R5.1
49.0
6.99
13.4
19.8
38.9
Figure 3: Relationship between the binding capacity, CEC and the concentrations of chemical factors in TBM
The equivalence of MycobindR in binding the total aflatoxins relative to the TBM is shown in Table
5. The binding capacity ratio of MycobindR to AC and RA was 1, MycobindR to KC, MC and VA was
2 and MycobindR to CC was 3.
Table 5: Aflatoxin binding capacity ratio of MycobindR to that of the TBM
Aflatoxins
TBM
AC KC CC MC VA RA
AFB1 1.0 1.0 1.0 1.0 1.0 1.0
AFG1 1.0 1.0 3.2 1.0 1.4 1.1
AFB2 1.6 2.5 6.9 3.0 3.4 1.2
AFG2 3.0 6.6 5.6 3.8 3.1 1.3
Overall 1.0 2.0 3.0 2.0 2.0 1.0
-1 -0.5 0 0.5 1 1.5
Al2O3 SiO2 K2O CaO Fe2O3 CEC
C
o
rr
el
at
io
n
c
o
ef
fi
ci
en
ts
Chemical components
3.0 Discussion
Among the evaluated binding materials, RA and AC had binding capacity almost equal to that of the reference binder, particularly in binding AFB1 and AFG1, which are the most toxic aflatoxins. Possibly the excellent binding power of these materials was due to their relatively high CEC values. The CEC values of both RA and AC were 27.2meq/100g of the materials and are equivalent to the CEC value for the reference material. High CEC values of many binding materials have been reported to promote their capacity to bind aflatoxins (17). The relatively high values of Calcium (Ca2+) and Potassium (K+) contents in the alumino-silicate minerals of the evaluated materials
seemed to promote values of CEC of the materials. Studies have shown that concentrations of Ca2+
and K+ ions make a great contribution to CEC levels in alumino-silicate materials (28). Presence
of Silicon (Si4+), Aluminium (Al3+) and Iron (Fe3+) seemed to have low or negative influence on the
CEC values of the TBM/MycobindR. According to 29, values of CEC increase with decreasing acidity
and vice versa. The ions Si4+, Al3+ and Fe3+ are acidity promoter unlike Ca2+ and K+ (29), hence
negatively influencing CEC values of the TBM/MycobindR and subsequently their capacity to bind
aflatoxins in solution. Disregarding other factors such as structural effect of a material, probably materials like CC showed low capacity for aflatoxins binding partly due to its higher concentration of Al3+ and Si4+, and partly due to its relatively higher content of Kaolinite type of mineral, which
has low CEC (30). Furthermore, KC and MC could not bind aflatoxins efficiently possibly due to relatively higher concentration of Al3+ and Fe3+.
The X-RD analysis showed presence in the TBM, of prominent mineral components that can influence aflatoxin binding. The results showed that just like the MycobindR, RA and AC contained
major minerals such as Andranite/Melanite, Terranovite and Albite; all of which contain Calcium and Phlogopite as well as Muscovite which contain Potassium. Possibly these components rendered RA and AC relatively superior to others in binding aflatoxins. In aflatoxin binding ions, Ca2+ in particular, synchronously bonds to two aflatoxin carbonyls and at the same time binds to
the four oxygen atoms of the Si-O ring on the clay binder surface (31). However, AC had low Ca2+
and K+ cations yet its CEC value was relatively high enough to favour high aflatoxin binding
capacity. Seemingly, the way active cations such as Calcium and Potassium are incorporated in different structures of the TBM and their associations with other structural elements may affect adsorptive potential of the TBM.
Generally, the chemical composition values for the TBM evaluated in this study were within value ranges reported for alumino-silicate based materials studied for various purposes including as feed additives. The general alumina content in the materials was within the range reported in other studies of 0.45- 21.7% (20) and 13.2% (Massinga et al., 2010) cited by 22) except for CC which contained higher level of alumina at about 33%. Except for RA which showed much higher percent content of silica, the other TBM had content similar to the reported values for clay materials ranging from 1.1-69.0% (mean of 59.6%) (20) and 44.3-71.0% (mean of 55.3%) (20)Just like MycobindR, VA and RA had content of Potassium oxide above the previously reported
range of 0.1-3.3% (19) and 0.1-2.6% (20) and 0.1% (Massinga et al., 2010) cited by 21) for high aflatoxin binding. Content of Potassium oxide of 0.01% in KC was below the reported levels. Contents of Calcium oxide in all TBM were found within the previously reported range of 0.1-31.4% (19, 20 and Massinga et al., 2010) cited by 21)) for binders. Except the CC and RA, the rest of the TBM showed content of Iron oxide above the previously reported range of 0.2-14.8% (19, 20 and Massinga et al., (2010) cited by 21)) for binders. From the comparative composition of the TBM it seems that the materials do not differ from other materials of alumino-silicate nature including those proved to bind aflatoxins.
TBM had CEC values within the documented range as were observed from 15.4meq/100g (MC) to 38.9meq/100g for MycobindR.
The results for aflatoxin binding capacity of the TBM concurred with results of other previous related in-vitro studies in which binding capacity levels of clay-based binders such as bentonites (about 90%) has been reported (32, 33). The MycobindR employed as a reference in this study
missed manufacturer’s information displaying its capacity to bind aflatoxins. However, in our analysis we found that it could bind about 98% of the total aflatoxins subjected to it. A similar product Agrolite-MycobindR evaluated in Kenya showed aflatoxin binding capacity of 95% (34).
Regarding minimum experimental set-up standards as suggested by 35, though slightly higher, the binding capacity of 98% observed for the MycobindR in this study matched closely to 95%
value reported for the Agrolite-MycobindR.
The binding capacity ratio of MycobindR to TBM observed in this study, conversably implied that
AC and RA bind 100%, KC, MC and VA bind 50% and CC binds 33.3% of the total aflatoxins in solution. This indicates though in varying levels, the locally available crude materials (clay and ash based resources) have potential to adsorb aflatoxins in solution media and possibly can reduce aflatoxin contamination of feeds.
The AFB1 and AFG1 were highly adsorbed into the TBM as compared to AFB2 and AFG2. Probably this is because compared to AFB2 and AFG2, the AFB1 and AFG1 have higher polarity of the β-dicarbonyl group which is a key functional group of the aflatoxins (14). With the polarity respect, AFB1 was rendered the most adsorbed by the TBM followed by AFG1. This is advantageous since the toxicity of the aflatoxins tends to follow this order of reactivity, which was also obeyed by our results in this study. The aflatoxin binding capacity of the evaluated materials (especially RA and AC) can be confirmed on in-vivo test where the dietary and animal’s GIT factors are automatically accommodated. However, since exported binders are costly to farmers in low income countries, occasionally the material can be used in feeds to reduce hazard effects of aflatoxins to animals. In addition, traditionally farmers have been using an array of such materials for various intentions including uses in animal feeds. It has been observed that wild animals and birds are less affected by many natural toxins probably including aflatoxins due to their instincts related to geophagia (26, 27). Harnessing this natural phenomenon may be economically helpful to poor farmers as one of strategies in lowering aflatoxin menace which is difficult to avoid in feeds.
4.0 Conclusion
The test materials we evaluated in the study had varying capacity levels of binding aflatoxins in solution. The crude materials AC (Arusha clay) and RA (Rice-husk ash) have the relatively higher potential to bind aflatoxins equivalent to the commercial product MycobindR employed in the
study for reference purpose. Since traditionally these cheap materials are used for various purposes in animals, occasionally they could be utilized to minimize exposure of aflatoxin load to animals through contaminated feeds. Further studies are recommended to test binding capacity of these materials in refined form and when used in combinations of two or more of them, using both on in-vitro and in-vivo trials.
5.0 Materials and methods 5.1 Materials
5.1.1 Test binding materials and their sources
Six crude test binding materials (TBM) were evaluated against a commercial binder, MycobindR
Geological Survey of Tanzania for cleaning, grinding, sieving, homogenization and then packed in zip bags for subsequent chemical analyses and evaluation for adsorption capacity.
Table 6: Physical appearance, sources and current uses of the test materials
Material ID
Physical appearance
Source region Ethno-utilization
Clays
AC Brick-red clogs Arusha Treatment of human skin infection and ailments
KC Brownish-red blocks
Kilimanjaro Geophagial satisfaction
CC Shiny white
granules
Coast Stomach ailment treatment and for decorations
MC Brownish-red granules
Morogoro Geophagial satisfaction
Ashes
VA Greyish Volcanic powder
Arusha Food seasoning and tenderization in traditional cookery, feed
additive RA Greyish-white fine
powder
Various places Soil fertility improvement
In this and subsequent tables or figures: AC; Arusha clay, KC; Kilimanjaro clay, CC; Coast clay, MC; Morogoro clay, VA; volcanic ash, RA; rice-husk ash
Five kilogram of VA was purchased from the market and the site of production was followed to ascertain its originality, then handled like for the clay samples in the laboratory. Representative sample of rice-husks was taken from rice-millers and incinerated in the laboratory furnace at the Nelson Mandela African Institution of Science and Technology (NM-AIST) a temperature of 550 oC
for four hours and make about 5kg of rice-husk ash.
5.1.2 The reference binder
For comparison of the binding capacity of the crude clays and ashes, a commercial mycotoxin detoxifier named MycobindR (Evonik Industries AG) was purchased from Farmers Centre Limited
in Dar es Salaam, Tanzania and employed in the study.
5.1.3 Aflatoxin solution
The stock solution of aflatoxins produced by Romer Labs, Inc. USA was donated by Tanzania Food and Drugs Authority (TFDA).
5.2 Chemical analysis of the test materials
Samples of the TBM and MycobindR were further homogenized, ground and sieved through 1mm
sieve for the subsequent analyses of mineralogical composition, elemental content and cation exchange capacity (CEC).
5.2.1 Mineralogical composition
Samples of the TBM and MycobindR were analysed for mineralogical composition using
non-destructive techniques that employed X-RD analyser (BTX SN 231, Olympus Corporation, Tokyo Japan), a self-calibrated diffractometer depending on temperature. The samples were analysed at a temperature of -45oC. About 15mg of finely ground sample was sieved through 150µm sieve and
5.2.2 Elemental-oxide composition
The oxides in the TBM and MycobindR were quantified by Minipal-4 a high performance bench top
energy dispersive X-ray fluorescence spectrometer (PANalytical MINIPAL-4, EDXRF Spectrometer, The Netherlands). The sample was ground into a fine powder, then about 50g of it was scanned by the spectrometer for metallic oxide composition at an energy dispersion of 30keV. The percent composition of the metallic oxides in each sample was recorded.
5.2.3 Determination of cation exchange capacity (CEC)
The CEC was determined by wet analysis employing Ammonium Replacement Method (Buchner funnels vacuum flasks) as explained by Brady and Weil (35)and involving leaching of exchangeable cations in the TBM/MycobindR with ammonium acetate salt solution. The excess
salt was removed by ethanol followed by potassium chloride to leach NH4+ which initially replaced
other various cations of the TBM/MycobindR. The amount of NH4+ released and washed into a
beaker beneath Buchner funnels was determined using Kjeldahl distillation method (36) and CEC (meg/100g) of TBM and MycobindR was computed using equation (1).
CEC = (mg L-1 of NH
4-N in leachate) x (0.25/14) x (100/sample weight (g)) mg L-1 NH4-N.
……….. (1)
5.3 Experimental design and treatments 5.3.1 Experimental design
The six TBM and MycobindR engaged to bind aflatoxins formed seven treatments of the in-vitro
experiment. Each of the treatments was replicated into three units (test-tubes).
5.3.2 Preparation of the experimental solutions
The experiment was based on a buffer solution with or without a TBM/MycobindR and spiked or
non-spiked with aflatoxin solution.
a. Buffer solution
The buffer solution was prepared from Potassium Chloride, Potassium dihydrogen phosphate anhydrous disodium hydrogen phosphate and Sodium chloride in distilled water
b. Diluted aflatoxin solution
The standard solution of combined aflatoxins AFB1, AFB2, AFG1and AFG2 (250ng/ml) in acetonitrile was diluted to 20ng/ml using distilled water in an amber flask.
c. Solutions of TBM/MycobindR and controls
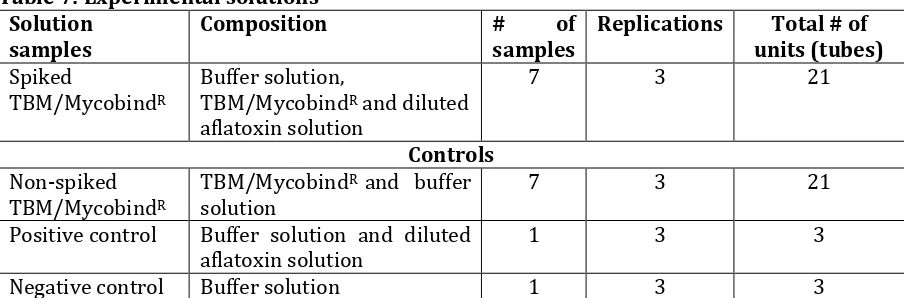
The test solutions contained components as shown below and summarised in Table 7
(i) Spiked TBM/MycobindR: suspension of 0.25% of TBM/MycobindR in the buffer solution
spiked with 5ml of diluted solution of aflatoxins
(ii) Non-spiked TBM/MycobindR: a control for each binding material containing suspension
of 0.25% of TBM/MycobindR in the buffer solution.
(iii) Positive control: the buffer solution spiked with 5ml of diluted solution of aflatoxins and (iv) Negative control: the buffer solution only.
Table 7: Experimental solutions Solution
samples
Composition # of
samples
Replications Total # of units (tubes)
Spiked
TBM/MycobindR
Buffer solution,
TBM/MycobindR and diluted
aflatoxin solution
7 3 21
Controls
Non-spiked TBM/MycobindR
TBM/MycobindR and buffer
solution
7 3 21
Positive control Buffer solution and diluted aflatoxin solution
1 3 3
Negative control Buffer solution 1 3 3
2.3.3 Procedure for in-vitro experiment
The in-vitro procedure was adopted from Kong et al. (36) simulating gastrointestinal pH condition of pigs, representing monogastric animals, which are more prone to aflatoxicosis. A sample of TBM/MycobindR was prepared by weighing 0.025g into 10ml of phosphate buffer
solution (0.1 M, pH 6.0) making a suspension of 0.25%. An aliquot of 2.5 ml suspension was pipetted into 25 ml centrifuge-tube then 5 ml of the diluted aflatoxin solution was added. Parallel with the TBM/MycobindR test treatments, their respective negative controls (non-spiked with the
diluted aflatoxin solution) were ran. General positive and negative controls were included to eliminate probable error effects such as due to aflatoxin impurities in the measuring/analysis system hardware and reagents. The positive control contained 2.5ml of phosphate buffer and 5ml of the diluted aflatoxin solution while the negative control contained 5 ml of phosphate buffer solution only. Each solution sample was replicated thrice and pH in each centrifuge-tube was adjusted to 2.0 by adding 1M HCl to simulate pH in the stomach of pigs.
5.3.4 Incubation of the solution samples
All samples were incubated at 39°C in a shaking water bath for two hours and then1ml of phosphate buffer (0.2 M, pH 6.8) was added to each tube. To simulate the conditions in the small intestine of pigs, pH in all tubes was raised to 6.8 by adding 1M NaOH followed by second phase incubation at 39°C for four hours. After incubation, the mixture was centrifuged and the supernatant was obtained for analysis of residual (unbound) aflatoxins B1, B2, G1 and G2 using High Performance Liquid Chromatography (HPLC).
5.4 Determination of unbound aflatoxins in the buffer solution
Briefly, the pH of the clear supernatant was adjusted to 7.4 using 0.1M NaOH. Unbound aflatoxin in the supernatant was determined by the procedure suggested by Diaz and Smith (11) where the clear supernatant was analyzed for residual (unbound) aflatoxin without additional cleanup. The analysis employed fluorescence detector connected to HPLC (Shimadzu Corp) at a mobile phase flow rate of 0.8ml/min at a temperature of 28oC, through stationary phase column of size
5µm 4.6x150mm (Spherisorb ODS-1, Waters). Residual aflatoxins AFB1, AFB2, AFG1and AFG2 were quantified at wavelengths of 363nm excitation filter and 440nm cut-off emission filter using the fluorescence detector (RF-10AXL SMN C20954406285).
5.5 Estimation of percent aflatoxin binding capacity
Aflatoxin binding capacity of a material was determined by the percent of AFB1, AFB2, AFG1 or AFG2 adsorbed into it. Thus the higher the aflatoxin binding capacity the lower the percent of unbound aflatoxin content in the buffer solution. The Percent binding capacity Pi of ith
TBM/MycobindR in binding jth aflatoxin was determined using model equation (2).
Where IATij (ng/ml) is the initial concentration of jth aflatoxin in the test-tube with ith
TBM/MycobindR; UATij (ng/ml) is the residual (unbound) jth aflatoxin in the test-tube with ith
TBM/MycobindR after the digestion period. The IATij was considered to be the amount of aflatoxin
recovered from positive control adjusted by subtracting the value obtained for the negative control. The UATij was adjusted by subtracting residual aflatoxin amount obtained for the negative
control of each individual TBM/MycobindR from the concentration of residual aflatoxin in the
supernatant of the TBM/MycobindR spiked with aflatoxin solution.
5.6 Data analysis
5.6.1 Statistical analyses
Data analysis for percent mean binding capacity were analysed by GLM program of SAS (37) using the model equation (3).
Yij = Xi + Xj + eij………. (3)
Where Yij = binding response (capacity) of ith TBM/MycobindR in adsorbing jth aflatoxin
Xi = binding effect due to the capacity of ith TBM/MycobindR in adsorbing jth aflatoxin
Xj = binding effect due to easy with which jth aflatoxin is adsorbed to ith TBM/MycobindR
eij = the error term due toith and jth aflatoxin
The mean separation was done by Duncan procedure and the significance was declared at an alpha-level of 0.05.
Relationship between binding capacity of TBM and MycobindR in adsorbing aflatoxins and their
chemical properties was determined by running correlation analysis between percent binding capacity of TBM and MycobindR and their relative chemical properties (elemental-oxide
concentration and cation exchange capacity). Data were analysed by using MS-Excel.
5.6.2 Determination of aflatoxin binding capacity ratio of MycobindR to TBM
Binding capacity of MycobindR relative to a TBM as a ratio R was determined using the model
equation (4)
R = % binding capacity of RB ÷ % binding capacity of a TBM………. (4)
Conflict of interests
The authors declare that there is no conflict of interest related to this study.
Acknowledgements
We would like to acknowledge the Institute of Rural development Planning (IRDP)-Dodoma, which funded this study. We are also grateful to the Department of Geology and Mineral Resources of the University of Dar es Salaam (UD) and Tanzania Food and Drugs Authority (TFDA) for their facilitation in the sample analysis and provision of the premises for the experiments.
References
2. Dhanasekaran, D., Shanmugapriya, S., Thajuddin, N., & Panneerselvam, A. (2011).
Aflatoxins and aflatoxicosis in human and animals. In Aflatoxins-Biochemistry and
Molecular Biology. InTech.
3. Jen, J. J. S., & Chen, J. (Eds.). (2017). Food safety in China: Science, technology,
management and regulation. John Wiley & Sons.
4. Feddern, V., Dors, G. C., Tavernari, F. D. C., Mazzuco, H., Cunha, A., Krabbe, E. L., &
Scheuermann, G. N. (2013). Aflatoxins importance on animal nutrition. In
Aflatoxins-Recent Advances and Future Prospects. InTech.
5. Sassahara, M., Netto, D. P., & Yanaka, E. K. (2005). Aflatoxin occurrence in foodstuff
supplied to dairy cattle and aflatoxin M1 in raw milk in the North of Parana state.
Food and chemical toxicology, 43(6), 981-984.
6. Andretta, I., Kipper, M., Lehnen, C. R., Hauschild, L., Vale, M. M., & Lovatto, P. A. (2012).
Meta-analytical study of productive and nutritional interactions of mycotoxins in
growing pigs. Animal, 6(9), 1476-1482.
7. Mok, C. H, Shin S. Y. & Kim B. G 2013. Aflatoxin, deoxynivalenol, and zearalenone in
swine diets: Predictions on growth performance. Revister Colomb Cienc Pecu
26:243-254
8. Khan, M.Z., Hameed, M.R., Hussain, T., Khan, A., Javed, I., Ahmad, I., Hussain, A.,
Saleemi, M.K. and Islam, N.U., 2013. Aflatoxin residues in tissues of healthy and sick
broiler birds at market age in Pakistan: A one year study.
Pak Vet J
,
33
(4), pp.423-427.
9. Grace, D. (2013). Animals and aflatoxins (No. 20 (5)). International Food Policy Research
Institute (IFPRI).
10. Arapcheska, M., Jovanovska, V., Jankuloski, Z., Musliu, Z., & Uzunov, R. (2015). Impact
of aflatoxins on animal and human health. Int. J. Innov. Sci. Eng. Technol, 2(2),
156-161.
11. Diaz, D. E., & Smith, T. K. (2005). Mycotoxin sequestering agents: practical tools for the
neutralization of mycotoxins.
12. Kolosova, A. and Stroka, J., 2012. Evaluation of the effect of mycotoxin binders in
animal feed on the analytical performance of standardised methods for the
determination of mycotoxins in feed. Food Additives & Contaminants: Part A,
29(12), pp.1959-1971.
13. Devreese, M. (2013). Development of in vitro and in vivo models for testing the efficacy
of mycotoxin detoxifying agents and their possible interaction with oral
absorption of veterinary drugs (Doctoral dissertation, Ghent University).
14. Grant, P. G., & Phillips, T. D. (1998). Isothermal adsorption of aflatoxin B1 on HSCAS
clay. Journal of agricultural and food chemistry, 46(2), 599-605.
16. Phillips, T. D., Lemke, S. L., & Grant, P. G. (2002). Characterization of clay-based
enterosorbents for the prevention of aflatoxicosis. In Mycotoxins and food safety
(pp. 157-171). Springer, Boston, MA.
17. Vekiru, E., Fruhauf, S., Rodrigues, I., Ottner, F., Krska, R., Schatzmayr, G., & Bermudez,
A. J. (2015). In vitro binding assessment and in vivo efficacy of several adsorbents
against aflatoxin B1. World Mycotoxin Journal, 8(4), 477-488.
18. Kannewischer, I., Arvide, M. G. T., White, G. N., & Dixon, J. B. (2006). Smectite clays as
adsorbents of aflatoxin B1: initial steps. Clay Science, 12(Supplement2), 199-204.
19. Moreno-Pedraza, A., Valdés-Santiago, L., Hernández-Valadez, L. J., Rodríguez-Sixtos
Higuera, A., Winkler, R., & Guzmán-de Peña, D. L. (2015). Reduction of aflatoxin B1
during tortilla production and identification of degradation by-products by
direct-injection electrospray mass spectrometry (DIESI-MS). salud pública de méxico, 57,
50-57
20. Karnland, O. (2010). Chemical and mineralogical characterization of the bentonite
buffer for the acceptance control procedure in a KBS-3 repository (No.
SKB-TR--10-60). Swedish Nuclear Fuel and Waste Management Co.
21. Mukasa-Tebandeke, I. Z., Ssebuwufu, P. J. M., Nyanzi, S. A., Schumann, A., Nyakairu, G.
W. A., Ntale, M., & Lugolobi, F. (2015). The elemental, mineralogical, IR, DTA and
XRD analyses characterized clays and clay minerals of Central and Eastern Uganda
.22. Anjos, F. D., Ledoux, D. R., Rottinghaus, G. E., & Chimonyo, M. (2016). Efficacy of
Mozambican bentonite and diatomaceous earth in reducing the toxic effects of
aflatoxins in chicks. World Mycotoxin Journal, 9(1), 63-72.
23. Habeeb, G. A., & Mahmud, H. B. (2010). Study on properties of rice husk ash and its
use as cement replacement material. Materials research, 13(2), 185-190.
24. Mohamed, R. M., Mkhalid, I. A., & Barakat, M. A. (2015). Rice husk ash as a renewable
source for the production of zeolite NaY and its characterization. Arabian Journal
of Chemistry, 8(1), 48-53.
25. Korotkova, T.G., Ksandopulo, S.J., Donenko, A.P., Bushumov, S.A. and Danilchenko, A.S.,
2016. Physical Properties and Chemical Composition of the Rice Husk and Dust.
Oriental Journal of Chemistry, 32 (6), pp.3213-3219.
26. Diamond, J. M. (1999). Evolutionary biology: dirty eating for healthy living. Nature,
400(6740), 120.
27. Mahaney, W.C. and Krishnamani, R., 2003. Understanding geophagy in animals:
standard procedures for sampling soils. Journal of Chemical Ecology, 29(7),
pp.1503-1523.
28. Rayment, G. E., & Higginson, F. R. (1992). Australian laboratory handbook of soil and
30. Brown K, & Lemon J 2016. Fact Sheets Cations and Cation Exchange Capacity.
Retrieved
from:
http://www.soilquality.org.au/factsheets/cation-exchange-capacity.
31. Kang, F., Ge, Y., Hu, X., Goikavi, C., Waigi, M. G., Gao, Y., & Ling, W. (2016). Understanding
the sorption mechanisms of aflatoxin B1 to kaolinite, illite, and smectite clays via a
comparative computational study. Journal of hazardous materials, 320, 80-87.
32. Manafi, M., Narayanaswamy, H.D. and Pirany, N., 2009. In vitro binding ability of
mycotoxin binder in commercial broiler feed. African Journal of Agricultural
Research, 4(2), pp.141-143.
33. Kong, C., Shin, S. Y., & Kim, B. G. (2014). Evaluation of mycotoxin sequestering agents
for aflatoxin and deoxynivalenol: an in vitro approach. SpringerPlus, 3(1), 346.
34. http://pasitokenyaltd.com/wp-content/uploads/2015/04/agrolite-basic.compressed.pdf