Impact of the HERA I+II combined data on the CT14 QCD global
analysis
S. Dulat1,3, T.-J. Hou2, J. Gao3, M. Guzzi4,** J. Huston5, P. Nadolsky2, J. Pumplin5, C. Schmidt5, D. Stump5, and C.-P. Yuan5
1School of Physics Science and Technology, Xinjiang University, Urumqi, Xinjiang 830046, China
2Department of Physics, Southern Methodist University, Dallas, TX 75275-0181, U.S.A. 3High Energy Physics Division, Argonne National Laboratory, Argonne, Illinois 60439, U.S.A.
4The University of Manchester, Oxford Road, M13 9PL Manchester, United Kingdom
5Department of Physics and Astronomy, Michigan State University, East Lansing, MI 48824, U.S.A.
Abstract. A brief description of the impact of the recent HERA run I+II combination of inclusive deep inelastic scattering cross-section data on the CT14 global analysis of PDFs is given. The new CT14HERA2 PDFs at NLO and NNLO are illustrated. They
employ the same parametrization used in the CT14 analysis, but with an additional shape parameter for describing the strange quark PDF. The HERA I+II data are reasonably well described by both CT14 and CT14HERA2PDFs, and differences are smaller than the
PDF uncertainties of the standard CT14 analysis. Both sets are acceptable when the error estimates are calculated in the CTEQ-TEA (CT) methodology and the standard CT14 PDFs are recommended to be continuously used for the analysis of LHC measurements.
1 Introduction
The CT14 parton distribution functions (PDFs) [1] are obtained in a global analysis of a variety of hadronic scattering experimental data and are suitable for general-purpose QCD calculations at the Large Hadron Collider (LHC) and in other experiments.
In global analyses to determine the PDFs of the proton, inclusive DIS measurements impose the most important constraints. In 2015, the H1 and ZEUS collaborations released a novel combination, “HERA2”, of measurements of inclusive deep-inelastic scattering cross sections [2] at the HERAe±p
collider. The two collaborations employed different experimental techniques and used different detec-tors and methods for kinematic reconstruction. As a result, the new HERA2 combined measurements exhibit reduced systematic uncertainties with respect to the previous combination of DIS data sets, “HERA1”, published in 2009 [3].
In the study of Ref. [4], the impact of the HERA2 measurements on the CT14 global analysis is investigated by replacing the combined HERA1 data set used in the published CT14 PDFs [1], with the HERA2 set and by examining the resulting changes in PDF central values and uncertainties. Moreover, the dependence of the goodness-of-fit upon kinematic cuts onQandxis also examined, as in Ref. [2] it was suggested that the lowQ2 HERA2 data are not well fitted by the CT10 and CT14
Presenter, e-mail: [email protected]
PDFs. Related studies of the impact of HERA2 data in the context of MMHT14 and NNPDF3.0 analyses can be found in Refs. [5–7].
The CTEQ-TEA PDFs have been refitted at NLO and NNLO by using the global CT14 data ensemble, but with the HERA2 measurements in place of HERA1. The new PDFs obtained after the refitting procedure are named CT14HERA2, to distinguish from CT14.
2 Features of the CT14
HERA2analysis
The HERA2 data set has 1120 data points in the fitted region with Q > 2 GeV and W2 > 12.5
GeV2. There are 162 correlated systematic errors, and 7 procedural uncertainties, in addition to the
luminosity uncertainty. When HERA2 is included in the global fit, there are in total 3287 data points in the CT14HERA2data ensembles, compared to 2947 in the original CT14 fits. This is because two other
changes have been made in the data analysis: 1) the NMC muon-proton inclusive DIS data onF2p[8]
have been dropped because this set is influenced by some unknown or underestimated systematic errors1, in concordance with findings in our earlier studies [9]; 2) the data table for the CMS 7 TeV
5 fb−1inclusive jet experiment [10], which became available after the completion of the CT14 study, has been updated and it produces no appreciable effects on the PDFs.
As in CT14, the theoretical predictions for the majority of processes in the CT14HERA2fit are
cal-culated at the NNLO level of accuracy. In particular, a NNLO treatment [11] of heavy-quark mass effects in neutral-current DIS is realized in the S-ACOT-χscheme [12–15] and is essential for ob-taining correct predictions for LHC electroweak cross sections [16–19]. However, the calculations for charged-current DIS and inclusive jet production are included at NLO only; in both cases, the complete NNLO contributions are not yet available. In Sec. II of Ref. [1], various arguments are pre-sented suggesting that the expected impact of the missing NNLO effects in jet production on the PDFs is small relatively to current experimental errors. Similarly, the NNLO contribution to charged-current DIS, including massive charm scattering contributions [20], is modest compared to the experimental uncertainties.
2.1 Parametrization of the PDFs
The CT14HERA2analysis adopts the CT14 PDF functional forms [1] at initial scaleQ0=1.3 GeV
x fa(x,Q0) = xa1(1−x)a2Pa(x), (1)
where thePa(x) functions are linear combinations of Bernstein polynomials. One change is made relative to the standard CT14. In Ref. [1] the strange quark PDF is parametrized according to Eq. (1), withPs(x) being a constant. The parametera1is tied to the commona1of ¯uand ¯d, ands(x) =s¯(x)
is assumed in the analysis. Therefore, in the standard CT14 analysis, one has only two parameters for the strange quark PDF:a2and normalization. With this limitation on s(x,Q0), it is necessary to
extend the strange quark uncertainty by adding two “extreme strange” PDFs to the set of Hessian error PDFs. In the CT14HERA2PDFs, a different technique is used to avoid underestimating the strangeness
uncertainty provided by the Hessian error PDF set: while in the published CT14 PDFs thea1
param-eters are such thata1(s) = a1( ¯s) = a1( ¯d) = a1(¯u), in CT14HERA2a1(s) =a1( ¯s) is allowed to differ
froma1( ¯d) =a1(¯u). By freeing the parametera1(s), it is found that it is not necessary to construct
additional extreme strange PDFs. So, whereas the CT14 error PDFs include two “extreme strange”
1In the CT14
HERA2analysis of Ref. [4] it has been observed that even if they were included in the fit, they would induce a
and two “extreme gluon” PDFs, the CT14HERA2error PDFs include only two “extreme gluon” PDFs
to model the uncertainty of gluon PDFs in the very largexand smallxregions, respectively. Thus the total number of error PDFs is the same for CT14 and CT14HERA2.
3 Impact of data selection cuts
The HERA2 publication [2] found that both HERAPDF2.0 PDFs andχ2values depend significantly
on the choice ofQcut, the minimum value of the four-momentum-transferQin the HERA2 analysis.
In order to explore the impact of variations ofQcuton the CT14HERA2global analysis, multiple fits of
CT14HERA2PDFs have been performed in whichQcutis varied from 2 GeV to 6 GeV and the results are
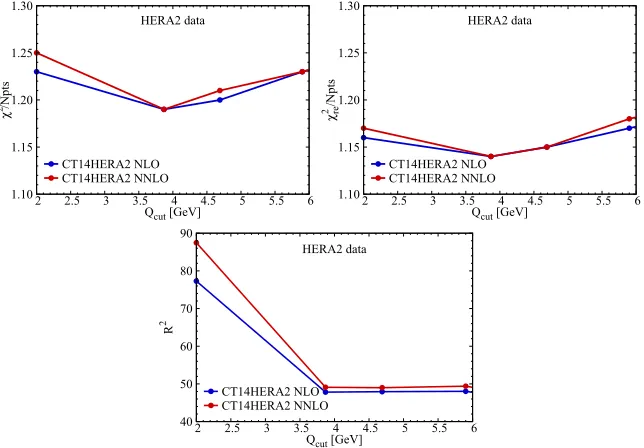
compared to those of the CT14 analysis. For every choice ofQcut, the totalχ2, reduced-χ2(i.e.,χ2re),
and the systematic shift penaltyR2 (defined respectively in Eq. 2 and 3 of Ref. [4]), are illustrated
in Fig. 1. Theχ2/Nptsaccounts for the sum of all four DIS subprocesses and the graphs show the
χ
2 /Npts
Qcut [GeV]
HERA2 data
CT14HERA2 NLO CT14HERA2 NNLO 1.10
1.15 1.20 1.25 1.30
2 2.5 3 3.5 4 4.5 5 5.5 6
χ
2/Nptsre
Qcut [GeV]
HERA2 data
CT14HERA2 NLO CT14HERA2 NNLO 1.10
1.15 1.20 1.25 1.30
2 2.5 3 3.5 4 4.5 5 5.5 6
R
2
Qcut [GeV]
HERA2 data
CT14HERA2 NLO CT14HERA2 NNLO 40
50 60 70 80 90
2 2.5 3 3.5 4 4.5 5 5.5 6
Figure 1.χ2/
Npts(left), reduced-χ2/Npts(right), andR2(bottom) for the HERA2 data and CT14HERA2PDFs, as
a function ofQcut.
dependence onQcutin the CT14HERA2analysis at both NLO and NNLO. The values ofχ2/Nptsfor the HERA2 data exhibit ashallow minimumforQcutin the range 3.5 Qcut4 GeV. The reduction of
χ2atQ
cut∼4 GeV, compared to the CT standard choice ofQcut=2 GeV, from 1.17 to 1.15, does not
seem significant. An interesting feature of the graphs is that near the minimum the NNLO and NLO results are equal, whereas NNLO has largerχ2 on either side of the minimum. The lower panel in Fig. 1 showsR2, the total quadratic penalty for the systematic errors, as a function ofQ
cut. The value
ofR2decreases significantly fromQ
cut=2 to 3.87 GeV, from 87 to 49 (for 170 systematic errors).
For ideal Gaussian systematic errors one would expectR2 ∼ 170. When the low-Qdata points are
discarded by the cut, the systematic errors become less important. However, this reduction ofR2is
shared by 1120 total data points, so the overall net change inχ2/N
4 Results for the CT14
HERA2PDFs
The central values and uncertainties of the CT14HERA2PDFs are compared to those of the CT14 global
analysis in Fig. 2, where only the NNLO PDFs at the scaleQequal to the initial scaleQ0 =1.3 GeV
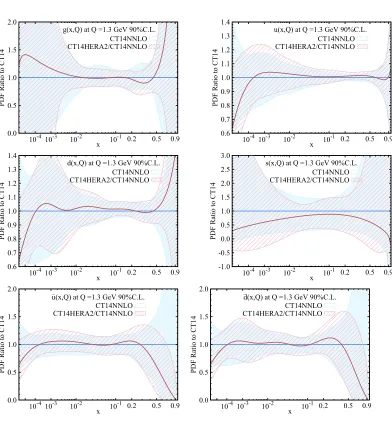
are shown. At this low scale, the PDF uncertainties are magnified, and they are reduced at electroweak scales as a consequence of DGLAP evolution. Additional plots can be found on the CTEQ public website [21]. The comparison is summarized below where a few comments are in order.
The central value of the CT14HERA2 gluon in the range 10−2 x 0.2 is almost unchanged
compared to CT14; it is larger by about 30% atx ≈ 10−4, by a larger factor for x > 0.5, and it is
smaller by about 10% atx≈0.3.
Theuanddquarks are generally slightly larger than (but close to) CT14 in the range 10−2 x
0.5 where the CT14HERA2uncertainty band is comparable to that of CT14; whereas they are both
sys-tematically larger by about 5% in the intermediate region of 10−4x10⁻². The CT14HERA2/CT14
ratio decreases atx10−4in both cases. Thedquark increases atx>0.5, while theuquark decreases
slightly atx≈0.5. The slow oscillations ind(x,Q0) reflect the behaviour of Bernstein polynomials in
Eq. (1).
The strange quark central prediction is reduced over the entirexrange, mainly due to the change of adding one additional shape parameter for describing the strange quark PDF; but this reduction is statistically insignificant and completely within the uncertainty of the previous PDF ensemble. In particular a reduction of approximately−50% is observed at bothx10−3andx0.5.
The ¯uand ¯dquarks share similar features. They are almost unchanged for 10−2x0.2 where
the uncertainties are comparable to those of CT14. The ¯u quark PDF increases by about 10% at x
around 0.2, and the ¯d quark PDF similarly at xaround 0.3. Both of ¯u and ¯d quarks, similar to s
quark, decrease by large factors forx0.4, where both gluon and down quark PDFs increase, as a consequence of momentum sum rule. It is important to keep in mind that atx>0.5 the antiquark PDFs take very small values, their behaviour is very uncertain and strongly depends on the parametrization form.
The individual PDF uncertainties do not change much, except in the unconstrainedxregions of the strange quark PDF due to the change made in its parametrization form.
It has been verified that the change seen in gluon, up and down quark PDFs mainly arises from replacing the HERA1 data (in CT14 analysis) by the HERA2 data (in CT14HERA2analysis). This was
explicitly checked by comparing CT14 PDFs to the the result of a new fit which uses exactly the same setup as that in the CT14 global analysis, but with the HERA1 data replaced by the HERA2 data.
Conclusions
PDF Ratio to CT14
x
g(x,Q) at Q =1.3 GeV 90%C.L. CT14NNLO CT14HERA2/CT14NNLO 0.0 0.5 1.0 1.5 2.0
10-4 10-3 10-2 10-1 0.2 0.5 0.9
PDF Ratio to CT14
x
u(x,Q) at Q =1.3 GeV 90%C.L. CT14NNLO CT14HERA2/CT14NNLO 0.6 0.7 0.8 0.9 1.0 1.1 1.2 1.3 1.4
10-4 10-3 10-2 10-1 0.2 0.5 0.9
PDF Ratio to CT14
x
d(x,Q) at Q =1.3 GeV 90%C.L. CT14NNLO CT14HERA2/CT14NNLO 0.6 0.7 0.8 0.9 1.0 1.1 1.2 1.3 1.4
10-4 10-3 10-2 10-1 0.2 0.5 0.9
PDF Ratio to CT14
x
s(x,Q) at Q =1.3 GeV 90%C.L. CT14NNLO CT14HERA2/CT14NNLO -1.0 -0.5 0.0 0.5 1.0 1.5 2.0 2.5 3.0
10-4 10-3 10-2 10-1 0.2 0.5 0.9
PDF Ratio to CT14
x
–
u(x,Q) at Q =1.3 GeV 90%C.L. CT14NNLO CT14HERA2/CT14NNLO 0.0 0.5 1.0 1.5 2.0
10-4 10-3 10-2 10-1 0.2 0.5 0.9
PDF Ratio to CT14
x
–
d(x,Q) at Q =1.3 GeV 90%C.L. CT14NNLO CT14HERA2/CT14NNLO 0.0 0.5 1.0 1.5 2.0
10-4 10-3 10-2 10-1 0.2 0.5 0.9
Figure 2. Comparison of CT14HERA2(red) and CT14 (blue) PDFs atQ = 1.3 GeV. Flavorsg,u,d,s,u¯,d¯are
shown. The curves compare the central fits, plotted as ratios to CT14. The uncertainty bands are 90% C.L. uncertainties evaluated from the CT14 (shaded blue) and CT14HERA2(hatched red) error ensembles; both error
bands are normalized to the corresponding central CT14 PDFs. All PDFs are from the NNLO QCD analysis.
Acknowledgments
under Grant No. PHY-0855561 and PHY-1417326; by Lightner-Sams Foundation; and by the Na-tional Natural Science Foundation of China under Grant No. 11165014 and 11465018.
References
[1] S. Dulat, T.J. Hou, J. Gao, M. Guzzi, J. Huston, P. Nadolsky, J. Pumplin, C. Schmidt, D. Stump, C.P. Yuan, Phys. Rev.D93, 033006 (2016),1506.07443.
[2] H. Abramowicz et al. (ZEUS, H1), Eur. Phys. J.C75, 580 (2015),1506.06042. [3] F.D. Aaron et al. (ZEUS, H1), JHEP01, 109 (2010),0911.0884.
[4] T.J. Hou, S. Dulat, J. Gao, M. Guzzi, J. Huston, P. Nadolsky, J. Pumplin, C. Schmidt, D. Stump, C.P. Yuan (2016),1609.07968.
[5] L.A. Harland-Lang, A.D. Martin, P. Motylinski, R.S. Thorne, Eur. Phys. J.C76, 186 (2016),
1601.03413.
[6] R.S. Thorne, L.A. Harland-Lang, A.D. Martin, P. Motylinski, PoSEPS-HEP2015, 505 (2015),
1508.06621.
[7] J. Rojo (NNPDF), PoSEPS-HEP2015, 506 (2015),1508.07731.
[8] M. Arneodo et al. (New Muon), Nucl. Phys.B483, 3 (1997),hep-ph/9610231.
[9] J. Pumplin, D.R. Stump, J. Huston, H.L. Lai, P.M. Nadolsky, W.K. Tung, JHEP07, 012 (2002),
hep-ph/0201195.
[10] S. Chatrchyan et al. (CMS), Phys. Rev.D87, 112002 (2013), [Erratum: Phys. Rev. D87 (2013) 119902],1212.6660.
[11] M. Guzzi, P.M. Nadolsky, H.L. Lai, C.P. Yuan, Phys. Rev.D86, 053005 (2012),1108.5112. [12] M.A.G. Aivazis, F.I. Olness, W.K. Tung, Phys. Rev.D50, 3085 (1994),hep-ph/9312318. [13] M.A.G. Aivazis, J.C. Collins, F.I. Olness, W.K. Tung, Phys. Rev. D50, 3102 (1994),
hep-ph/9312319.
[14] J.C. Collins, Phys. Rev.D58, 094002 (1998),hep-ph/9806259.
[15] W.K. Tung, S. Kretzer, C. Schmidt, J. Phys.G28, 983 (2002),hep-ph/0110247. [16] J. Gao, M. Guzzi, P.M. Nadolsky, Eur. Phys. J.C73, 2541 (2013),1304.3494.
[17] H.L. Lai, J. Huston, Z. Li, P. Nadolsky, J. Pumplin, D. Stump, C.P. Yuan, Phys. Rev.D82, 054021 (2010),1004.4624.
[18] P.M. Nadolsky, H.L. Lai, Q.H. Cao, J. Huston, J. Pumplin, D. Stump, W.K. Tung, C.P. Yuan, Phys. Rev.D78, 013004 (2008),0802.0007.
[19] W.K. Tung, H.L. Lai, A. Belyaev, J. Pumplin, D. Stump, C.P. Yuan, JHEP 02, 053 (2007),
hep-ph/0611254.
[20] E.L. Berger, J. Gao, C.S. Li, Z.L. Liu, H.X. Zhu, Phys. Rev. Lett. 116, 212002 (2016),
1601.05430.
[21] http://hep.pa.msu.edu/cteq/public/index.html, the CTEQ-TEA webpage [22] H.L. Lai, M. Guzzi, J. Huston, Z. Li, P.M. Nadolsky, J. Pumplin, C.P .
Yuan, Phys. Rev.D82, 074024 (2010),1007.2241.