IMPACT OF CORPORATE GOVERNANCE ON FIRM PERFORMANCE
AND EARNINGS MANAGEMENT A STUDY ON VIETNAMESE
NON-FINANCIAL COMPANIES
Binh Thi Thanh Dao1+
Hoang Anh Ngo2
1,2Financial Department, Faculty of Management and Tourism, Hanoi
University, Vietnam.
(+ Corresponding author)
ABSTRACT
Article History
Received: 27 January 2020 Revised: 6 March 2020 Accepted: 8 April 2020 Published: 4 May 2020
Keyword
s
Corporate governance Firm performance Earnings management Corporate governance ROA
BOD.
JEL Classification:
G3.
This paper investigated the impact of corporate governance and earnings management on firm performance, both as separate variables and as a combined one. Company size, supervisory size and auditors have negative and significant influence on firm performance, but earnings management was also found to have a positive influence on firm performance. In addition, the study showed that corporate control variables of were leverage and profitability which have positive influence on earnings management. Other corporate governance determinant factors such as board size, executive size, supervisory size, auditor, and executive in board have insignificant relationships with earnings management. These results were obtained from the panel data of 60 companies for a period of three years from 2014 to 2016.
Contribution/Originality:
This study contributes to the existing literature review of both earnings management and corporate governance. This is the first time this approach has been used for Vietnamese listed firms.1. INTRODUCTION
The term “corporate governance” (CG) then started to become popular among investors, shareholders and managerial levels (He et al., 2016). Since the stock market is an attractive place for trading and making profit, the financial information of the company plays an important role for investors to decide whether to invest or not. After the concept of corporate governance appeared, while making investing decisions, investors also started to consider corporate governance together with the financial information of a firm. This subject has been of great global interest since the late 20th century.
This interest led to a large number of studies on the relationships affecting corporate governance conducted by researchers across the world. As the board of directors represents the owners of the corporation and decides the control system within a company, the characteristics of the board and its functioning committee are often chosen as study object for researchers to draw conclusions on the effectiveness of corporate governance.
Asian Economic and Financial Review
ISSN(e):
2222-6737 ISSN(p):
2305-2147
DOI: 10.18488/journal.aefr.2020.105.480.501 Vol. 10, No. 5, 480-501.
Due to scandals in the early 2000s, another problem for investors is the quality of financial information (Driel, 2019). Since investors rely on the public information of the company; the transparency and accuracy of the information affects the decisions of investors greatly.
As a part of managing problem, “earnings management” (EM) also became a topic for researchers and mixed results created several controversies(Elitzur, 2011).
The researchers who conducted these studies were mainly from the accounting field. However, the people able to conduct earnings management are people holding managerial positions. Hence, numerous studies on the relationship of corporate governance and earnings management were conducted to find whether the governance mechanism of the company influenced earnings management.
In recent years, Vietnam has observed an impressive growth in its economy and GDP and become more and more attractive to foreign investors. The deregulation of many policies led to more and more capital pouring into Vietnamese market, with investors. Besides the increase in foreign invested corporations, a lot of companies have been established in recent years. According to Forbes magazine, appropriate policies not only attract foreign investment, but it also encourages the equitization of State-owned enterprise and trade liberalization (Hang, 2018). Equitization makes the owners of the company pay more attention to the on-going work and the firm performance.
Despite the late start compared to the rest of the world, Vietnamese enterprises have started to pay more attention to the governance of the operation within a company, however according to experts, most enterprises do not understand corporate governance correctly (Nga, 2014). Mister Ha Huy Tuan, Deputy Chairman of the National Financial Supervisory Commission, commented that the level of governance of Vietnamese enterprises is the lowest among the six ASEAN countries (Nga, 2014).
He stated that only 23% of Vietnamese corporations understood corporate governance correctly. Due to this, financial information is not transparent enough to truly reflect the performance of the company. Mister Phan Duc Hieu, Deputy Director of Central Institute for Economic Management, concluded that the quality of corporate governance of enterprises in Vietnam could directly affect equalitization (Tu, 2017). In another article, mister Phan Duc Hieu emphasized the importance of corporate governance in a company. According to him, with the lack of attention for corporate governance, the bigger the business, the weaker the ability to govern and control the company (Ha, Hang, & Thanh, 2017).
Even though corporate governance has caught the attention of Vietnamese economists and financial analysts, earnings management doesn’t get much attention from investors. When more and more people decide to invest their time and money on purchasing stocks in the market, the lack of attention to earnings management can lead to a low quality of financial information.
Hence, in Vietnam, this term only started to be studied recently, and there are not many articles in economic newspapers mentioning it. Different methods were used and different results were found and even though earnings management belongs to accounting side, it could have some impacts on the firm performance. In Vietnam, studies on the impact of corporate governance and earnings management are still lacking, and there are not many published working papers on the connection between earnings management and firm performance.
As a result, this paper would like to fill in the gap about corporate governance, firm performance and earnings management. The paper aims at finding the relationships between corporate governance and firm performance as well as corporate governance and earnings management; after that, it contains a discussion on how corporate governance and earnings management influence the performance of the firm.
This paper is divided into five sections. Section 1 introduces the topic of the paper, section 2 presents the literature review with theoretical literature and empirical studies of previous researchers, section 3 is the methodology of the research, and section 4 illustrates the empirical study on non-financial firms of two large stock exchanges in Vietnam. Section 5 concludes with the discussion of findings of the paper as well as some limitations and recommendations.
2. LITERATURE REVIEW
2.1.
Corporate Governance and Firm Performance 2.1.1. Corporate GovernanceAccording to the definition of the Cadbury Report (The Financial Aspects of Corporate Governance, 1992) corporate governance is considered to be a system that directs and controls the activities of the company. Corporate governance ensures the fairness between shareholders and employees, and makes sure both sides fulfill their responsibilities and get the appropriate rewards (Buallay, Hamdan, & Zureigat, 2017).
In the OECD Principle for corporate governance (2015), the definition is “a set of relationships between company’s management, its board, its shareholders and other stakeholders”, which means that corporate governance involves every person inside the corporation. It makes sure the company develops healthily and that investors can trust in the performance reported in the financial statement. Shareholders of the company have the responsibility to maintain good corporate governance so they have to vote for a good board of directors, auditors and committees to help them cover the management of the company. These boards and committees’ role is running the company’s daily work via a good mechanism, and auditors of the company need to make sure the financial information reported to the shareholders is correct and transparent (Naimah & Hamidah, 2017).
2.1.2. Theories of Corporate Governance 2.1.2.1. Agency Theory
One of the most famous theories raising the concern for corporate governance is the Agency theory developed by Michael and William (1976). “The agent” in this case refers to people who hold the position of executive directors and managers, and “the principals” are shareholders of the company, known as the owners of the company. Agency theory shows a conflict in the interest of “the principals” and “the agent”, when “the principals” are the one who get the wealth of the firm, however “the agent” is the one who controls the day-to-day work and the operating practice of the company. When the shareholders of the company cannot oversee the management of the company and do not know what executives do, this will create an agency cost. In order to reduce the conflict of interest, Eisenhardt (1989) argued that there could be more rewards for executives based on their outcome and behavior while working for the company. In addition, in order to ensure strict control over the work of executives, a supervisory board could be needed.
2.1.2.2. Stewardship Theory
Different from agency theory, stewardship theory with the role of executives considered as “the stewardship”, shows that the managers and executives are willing to do their duty to dedicate for the growth of the firm. When agency theory looks at the self-interest, most of the time it is the financial interest of “the agent”. Stewardship theory argues the contribution of the managers comes from their desire to work and create a great return for the company.
2.1.2.3. Stakeholder Theory
Shareholders are not the only people who hold a stake in the company; employees, customers, suppliers, creditors, etc., also hold stakes in the firm. Freeman (1984) defines stakeholders of a company as “any group or individual who is affected by or can affect the achievement of a company’s objectives”. Therefore, those internal and external groups and people can impact the performance of the firm. Even though the Board of directors, shareholders and CEOs play an important role in managing the firm and can be the ones who are directly affected by the company’s performance, since a company is considered a part of the society, it has to pay attention to its surrounding environment. As a manager, when following the stakeholder theory, one must make the right decisions to ensure the development of the firm as well as protect the interest of other stakeholders.
2.1.2.4. Determinant of Firm Performance
One way to consider firm performance is by looking at the accounting based measurement and market based measurement. When measuring the operating effectiveness of a firm, the famous accounting measurement used is Return on Assets (ROA). Since ROA does not compound by using market value, it is not affected by the changes of the market value of the firm; therefore, ROA can be used to compare the profit earned through time and between companies. ROA can represent the financial performance of the company (Oguz & Dincer, 2016).
Another way to analyze firm performance is by looking at the market based measurement of the firm. The famous proxy for identifying the market value of one company is Tobin’s Q. This measurement used in many different researches as a representation for financial performance of the firm in stock market. In his study, Yermack (1996) used Tobin’s Q as the approximate for market value of the firm, and he used it to measure the impact of other corporate governance variables on firm performance. Oguz and Dincer (2016) and Buallay et al. (2017) also uses Tobin’s Q as a dependent variable for their study on corporate governance and firm performance.
2.1.2.5. Board Size and Firm Performance
The size of the board of directors is one of the very first characteristics that researchers would consider. Empirical studies show mixed results of the impact of board size on firm performance. In a study on 452 large US industrial firms, Yermack (1996) found a negative relationship between the size of the board and firm performance. He used Tobin’s Q as a proxy to measure the value of the firm, and his study illustrated that the smaller the board size, the better the firm’s performance. This study also expressed the idea that small board affected and gave good results of financial ratios. Another study of Andres, Azofra, and Lopez (2005) also showed the inverse relationship of board size and firm performance. According to the study, the larger the board, the more effective they can control the firm performance.
In contrast, there were studies that found that board size and firm performance had a positive relationship. Anderson, Mansi, and Reeb (2004) researched S&P 500 firms and concluded that if the board size was large, the managerial control was better; therefore, the financial process was good. Adams and Mehran (2005) illustrated that the larger the board, the better the firm performance.
There was also evidence that board size does not have significant impact on firm performance. In their study on companies following the Corporate Governance Perception Index (CGPI) for a long period from 2005 to 2014, Naimah and Hamidah (2017) found that the board size had an insignificant relationship with the profit of the firm. Another study in Turkey also found no relationship between board size and company performance (Oguz & Dincer, 2016).
2.1.2.6. Supervisory Size and Firm Performance
that if the audit committee of the firm is large, it can supervise accounting practice and financial reports (Anderson et al., 2004; Naimah & Hamidah, 2017).
2.1.2.7. Auditor Quality and Firm Performance
Auditor quality can be another corporate governance variable that can affect the performance of the firm. This can be considered as external corporate governance when the directors and shareholders choose a reliable auditor. If the company’s financial statement is audited by large auditors like Big 4 firms (KPMG, Deloitte, PwC and Ernst & Young), the financial information can be more reliable, and it can reflect the firm’s performance quite accurately. A study from Naimah and Hamidah (2017) showed a positive relationship between audit quality and firm performance. A study on Jordanian firms showed a positive relationship between having auditors from the Big 4 firms and having good earnings quality (Hamdan, Maher, & Al-sartawi, 2016) which means that the earnings and financial information of the firm is reliable, and the performance of the firm is better.
2.1.2.8. Firm Size and Firm Performance
Black, Love, and Rachinsky (2006) found a positive relationship illustrating that if the firm’s size was large, then the financial performance of the company was better. The reasons may be that big firms can access better resources, and the managerial level of the company can access external capital, or the firm has larger functioning boards that can come up with a variety of ideas to better control the firm. However, in the study onTurkey firms, authors found a negative relationship between company size and ROA, ROE and Tobin’s Q (Oguz & Dincer, 2016). The reason might be that the bigger the firm, the more it costs to monitor the whole company. It is likely that large firms have an agency problem.
2.1.2.9. Leverage and Firm Performance
Another factor is the level of debt of one company. Black et al. (2006) showed a positive relationship between leverage and firm performance. According to Black, it could show that if the firm can get more debt, it means the firm is reliable enough. Another study on twenty firms on the Karachi Stock Exchange also illustrated a strong relationship of ROE, ROA and Tobin’s Q with leverage (Khatab, Masood, Zaman, Saleem, & Saeed, 2011).
2.2. Earnings Management
2.2.1. Incentives for Earnings Management
A company with strong earnings will have high earnings per share (EPS). Investors will look at the EPS and generate expectations for the future earning ability of the firm to make the decision whether to purchase the company’s shares or not. Earnings might be the crucial part that shareholders of the company will look at. With good earnings, directors or managers of the company will get rewards for the good results they created; however, bad earnings may result in the loss of jobs or punishment from the Board of Directors (BOD).
Since earnings play such an important part in company’s financial position, managers need to know what they could do to make decisions to manage earnings effectively. In fact, earnings management can be understood as a reasonable and legal management decision to choose an appropriate accounting policy for the company to have a stable, predictable and not volatile net income and to smooth the reported earnings across a period. Earnings management, in a proper way, is not a fraud and only manipulating the timing of the net income; nevertheless, it does not change the long-run financial information of the firm. Therefore, earnings management does not misrepresent the firm’s financial position on the market (Yaping, 2009).
company earnings management can be used for this purpose, but it is essential to note that managers cannot over-do earnings management so as to affect the real value of the firm.
So what will happen if some managers over-do earnings management and make it become illegal? Since earnings management is an art (Elitzur, 2011) there is a fine line between what is legal and what is illegal. Crossing the thin line between these two, leads to “cooking the books”, or “earnings fraud”. When it is illegal, earnings management is related to the interest the managers can receive.
Earnings management is conducted according to the self-interest of managers, who are hired for running the day-to-day work of the company, and the performance at work, such as the financial performance of the company, can be a measure of how well the employees complete their responsibility. Therefore, they might have the tendency to perform earnings management to make the profit look better in front of the shareholders’ eyes. According to Xie, Davidson, and DaDalt (2003) there will be potential agency problems due to the effect of net income on the compensations of managers.
Staff also have incentives to manage profit to make the financial information look good on the financial statement, so that external investors want to invest in the company through buying stocks. However, when staff “cook” the number, misrepresenting the actual financial information, this can cause investors and shareholders to get incorrect financial information about the value of the firm (Xie et al., 2003). Therefore, investors and shareholders cannot make rational decisions about their investments.
Another reason for profit management is for the purpose of merger and acquisition. For example, researches showed that if there are any potential management buyouts about to happen, the managers will decide to make an impact on the earnings of the company to understate the profit; therefore, the price for acquisition will be lower (Perry & Williams, 1994). Firms will try to under-reserve their losses in order to boost their earnings before acquisitions take place (Sommer & Xie, 2015) or before initial public offerings (Teoh, Welch, & Wong, 2002). By doing this, firms can increase the value and price of their companies for the mergers and acquisitions.
2.2.2. Empirical Study on Earnings Management
Since the accounting rules allow managers to use earnings management in accrual accounting basis, meaning that many accounting policies can be chosen to smooth the net income of the firm, the technique of accrual based earnings management is used (Li, McDowell, & Moore, 2011).
Managers will try to manipulate the accruals amount in order to manage earnings. Accruals are calculated by taking net income minus cash flow from operating activities. Total accruals consist of non-discretionary accruals (NDA) and discretionary accruals (DA) (Xie et al., 2003).
Total Accruals = Non-discretionary Accruals + Discretionary Accruals
Nondiscretionary accruals (NDA) relate to the normal business cycle of the firm: it is the obligation expenses of the company including next month’s utilities bills or employee’s salary. Those expenses have not been realized, however, it can be written in the book. The latter accrual is the discretionary accruals (DA), which are made up of the non-obligation expenses of firms. Expenses such as provisions for bad debt or provisions for constructions can be categorized as DA because they can be managed by managers. DA cannot be observed directly so managers can affect the earnings of the company through being flexible in applying accounting methods (Trang, 2012). Since DA can be changed and hardly predicted accurately, it is normally calculated through Total Accruals and Non-Discretionary Accruals.
2.2.3. Different types of Earnings Management
According to Dechow and Skinner (2000) managers can defer the recognition of revenue when the customer supports have been fulfilled. This deferred revenue is transferred into the unearned revenue reserves, and it helps the firm when the sales are unexpectedly high or low. Managers then can “delay” the amount of revenue or sales they get in a quarter in order to smooth the earnings. By doing so, when managers want to do fraud, it can be said that they can also change the amount of sales sold on credit which is not realized.
Hence, there can be a relationship between sales and accrual based earnings management. Dechow and Skinner (2000) also emphasized the possibility of doing earnings management on the recognition of revenue intentionally, but investors cannot figure this out unless it is stated in the notes to financial statements. In one study by Bešlić, Bešlić, Jakšić, and Andrić (2015) they tested the model generated with the dependent variable as TA, and other independent variables such as cash-flow from operation (CFO), return on assets (ROA), depreciation, other expense, change in revenue and change in receivable. The results found that there was a positive relationship between total accruals and difference of changes of net sales revenue and receivables from sales. This meant that the more they sell goods on credit, the more possibility for earnings management to happen. In the above study, Bešlić et al. (2015) also found out the relationship between return on asset (ROA) and total accruals, showing a positive relationship.
Normally when observing the growth of a company and making decision for investment, it is also important for investors to look at the changes and fluctuation of each financial statement line item and other financial information. The result of the previous year can cause the change in company’s operating plans for the next year. For example, if sales revenue of previous year is low, leading to low profit earned, then company will have to come up with marketing plans to increase next year’s sales, or adopting cost-cutting plans to lower the cost of goods sold to keep profit. Therefore, the sales of the next year can be affected.
This can also happen with earnings management of a company. The earnings management of the current year can be affected by the earnings management of previous years. Since earnings management is mostly measured by TA or DA, the current TA or DA can be influenced by the previous period TA or DA.
A study of all firms (excluding financial firm) in the CRSP/COMPUSTAT database in the period from 1990 to 2000 in the United States was conducted (Hochberg, Newman, & Rierson, 2004). The accounting rules used for financial information here were the General Accepted Accounting Rules (GAAP), and DA was the measure representing earnings management in this study.
According to the findings of authors, it was found that there was a negative relationship between the discretionary accruals of two consecutive years. Specifically, if DACCt-1 increases, DACCt will decrease. The research of Hochberg and partners even extended to a point where they tested the time effect on discretionary accruals. However, according to the study, only the first lagged term had a negative influence on the current DA, and other lagged term had a positive effect on current DA, but those effects were insignificant.
2.3. Corporate Governance, Earnings Management, and Firm Performance 2.3.1. Corporate Governance on Earnings Management
2.3.2. Board of Directors
As in Vladu (2015) the mechanisms of corporate governance will affect earnings management practices since the board of directors, audit committee or managers has the responsibility to take care of the daily work and make sure that the financial information reported to the shareholders accurately reflects the condition of the company. Researchers mainly focus on the board of directors and the audit committee and their characteristics such as size of boards, independence, or qualification of members of the boards in order to analyze their impact on earnings management. Elements representing the control of finance and assets of company are also taken into consideration, as control variables.
Board size is also one of the elements that can affect earnings management. However, there are mixed findings about this characteristic of the board. In a study on the role of the board and audit committee on earnings management, Xie et al. (2003) drew a conclusion that board size negatively affected earnings management. The larger the board’s members, the less the earnings management practices.
In the study of Abed, Al-Attar, and Suwaidan (2012) on Jordanian non-financial firms from 2006 to 2009, they also got the same results as Xie et al. (2003) that there existed a negative connection between board size and earnings management.
Rahman and Ali (2006) researched 97 listed firms of Malaysia for two years, 2002 and 2003, and came up with the result that when board size was large, so is the chances to conduct earnings management. The differences in research results could be due to differences in the countries and time period.
2.3.3. Accounting Committee – Supervisor Board
Besides the Board of directors, another board in the organization structure that can affect earnings management is the Accounting committee board, or in Vietnam, there can be a supervisor board. The accounting committee consists of people who are directly involved in preparing financial information and making financial reports for the board of directors and shareholders; thus, they can control earnings management easily.
The size of the accounting committee can be related to earnings management as a large number of members on the board can help monitor the work effectively. A study on Malaysian firms shows that the accounting committee size (Mansor, Che-Ahmad, Ahmad-Zaluki, & Osman, 2013) can help reduce earnings management. It was seen that the bigger the accounting committee the better they can control the financial information management.
2.3.4. Big Four Audit Firms
The auditor of the company can also be a control variable to indicate the earnings qualityearnings management. If the auditors come from a big firm that has a reputation, the quality of the audit is believed to be better. A study on Jordanian firms showed a positive relationship between having auditors from Big 5 and having good earnings quality (Hamdan et al., 2016). In Vietnam, there are four big auditing firms namely: Ernst & Young, Deloitte, PwC and KPMG. The quality of an audit from these firms is considered high; therefore, we can trust the financial information that is audited by these firms.
2.3.5. Profitability and Leverage
Contrary to mentioned studies, Abed et al. (2012) found that the company size and leverage had no connection with earnings management. Differences may arise since the samples are different. In the research of Abed et al. (2012) firms from Jordanian were examined from 2006 to 2009.
2.3.6. Corporate Governance and Earnings Management on Firm Performance
When conducting research on the impact of corporate governance on earnings management, another side of the issue is that whether corporate governance and earnings management has any influence on the performance of the whole company. After all, when a company wants to improve their corporate governance or controlling their earnings management level, it also wants to improve the firm’s performance. When investors look at the financial information of the company, the proxies that they look at are the ones showing how the company works and what the company earns during the year, in order to make sure that investors can still have benefits from investing in the firm. The approximate that can show the profitability of the company is the Return on Assets (ROA) ratio, and the approximate used to measure market value of the firm is Tobin’s Q.
Firm performance can be influenced by earnings management because firm performance like ROA could be affected by net profit of the company, and in accrual based accounting managers can manipulate the accruals to increase the earnings of current period. They can change the current assets such as increase ending inventory for lower cost of goods sold (COGS) or change the timing of account receivable (Gill, Biger, Mand, & Mathur, 2013). And when a company has a good earnings quality and manages the earnings well, it can also affect the value of the firm in investors’ eyes, making Tobin’s Q rise.
Empirically, a study on Indian manufacturing firms illustrated that corporate governance factors namely firm size and financial leverage and earnings management (measured as managed revenue) of a firm would affect the firm’s ROA in the next year as well as Tobin’s Q of the two years after (Gill et al., 2013). These variables all have a negative relationship with the ROA of the next period and a negative relationship with Tobin’s Q in two year periods, proving an adverse impact of corporate governance andearnings management on firm performance. That means the higher the level of earnings manipulation in the current period due to higher accruals, in the future, it can have adverse effect on firm performance.
Managers want to give good news to the investors by showing the good results of a company’s earnings. As investors, people want to see a good growth of the company, therefore, they can believe in the future earnings ability to make investing decision. Understanding the mentality of investors, managers will want to conduct earnings management/earnings manipulation to give good signals to the market about the condition of the company. The good signals can increase the hope of the investors in the future prospect of the company, hence, demand for the stocks will rise and increase the market value of the stocks. Therefore, it will increase the value of Tobin’s Q or market to book value.
Figure-1. Relationship of earnings management, corporate governance, and firm performance.
2.4. Gap in Literature Review
Corporate governance has appeared in Vietnam for a short time and it is still new to the managerial level in corporations. In Vietnam, corporate governance is different in compare with other corporate governance mechanisms in other countries. It could be due to the lack of some positions, skills and the courage to change. although in the world, the amount of research on this subject is numerous, covers a lot of aspects in governance practice and firm performance, it is still new to managers and researchers.
As a result, this research contributes to the topic of corporate governance and its impact on the performance of corporations in the Vietnam market. The topic of this research also adds the value to the impact of corporate governance on earnings management. The paper focuses on firms belonging to two large stock exchanges in order to conduct the research.
3. METHODOLOGY
3.1. Sample Selection
The first step in generating a right quantitative model in research is having a high quality input for analysis. The population is Vietnamese non-financial companies in two largest stock exchanges, HNX and HOSE, and a sample of 60 listed firms from 2014 to 2016 was selected. The basis for this sample was based on the annual reports for the Top 50 companies for from 2013 to 2016, excluding banks and financial institutions.
Data was categorized as balanced panel data with 180 observations in total. Companies’ financial and firm’s structural information were collected through the audited financial statements and annual reports published on the official website of each company. Other sources of published documents were cafef.vn and finance.vietstock.vn, two large, famous and reliable sources of financial information on the stock market.
3.2. Methodology Selection
In this paper, data was analyzed using panel data (Eviews, 2017). This type of data allows individual-specific variables that relate to each individual, country, or in this paper, each company. According to Gujarati and Porter (2004) this type of method gives “more informative data, more variability, less collinearity among variables, more degrees of freedom and more efficiency”.
Panel regression model was chosen for this study. The three types of estimation examined are: POOL (Pool Regression), FEM (Fixed Effect Model), and REM (Random Effect Model).
3.3. Variables Selection
This paper conducts a research on the relationship of corporate governance on firm performance and EM; after that, the impact of corporate governance and earnings management on firm performance was examined.
Table-1. Summary of independent and dependent variables.
Acronyms Description Positive Negative
TA_ASSET Non-Discretionary Accruals Dechow and Skinner (2000); Bešlić et al. (2015)
TOBINQ Tobin’s Q ratio Tobinq = (Market Value of
Firm)/(Book Value of Firm) (Gill et al., 2013)
BSIZE Board size The number of members in Board
of Directors Xie et al. (2003); Abed et al. (2012);
Rahman and Ali (2006)
SSIZE Supervisory size = The number of members
in Supervisory Board Mansor et al. (2013)
ESIZE Executives size = The number of members in Executives Board
AUD Auditors = “1” for Big4 audit company (KPMG, EY, PwC, Deloitte) and “0” for other audit company
Hamdan et al. (2016)
EX_IN_B BOD member holding executives position = The number of BOD members holding executives position
CSIZE Company size = Natural Logarithm/Total
Assets Chen and Zhang (2012); Mansor et al. (2013).
ROA Profitability = Net Income/Total Assets Mansor et al. (2013)
LEV Leverage ratio = Total Debt/Total Assets Chen and Zhang (2012)
3.3.1. Earnings Management Variable
Taking the study of Chen and Zhang (2012) on earnings management as a reference, earnings management was estimated using a modified Jones (1991) model with total accruals as the measurement. The equation below estimated the NDA of the firms and Earning Management = Total Accruals – estimate NDA:
Where: TACCit: Total accruals for company i in year t. Ait-1: Total asset for company i the previous year.
∆REVit: Change in operating revenues for company i in year t. ∆RECit: Change in receivables for company i in year t.
PPEit: gross property, plant and equipment for company i in year t. e: error term.
Specifically, in this equation, total accruals for each firm were calculated using the Balance Sheet approach as in the following equation (according to Chen. and Huang (2014)):
Where: TACCit: Total accruals for company i in year t.
∆CAit: Change in current assets for company i in year t. ∆CLit: Change in current liabilities for company i in year t.
∆CASHit: Change in cash and cash equivalent for company i in year t. ∆STDit: Change in short term debt for company i in year t.
Model 1: Corporate governance and Firm Performance.
TOBINQit = β1 + β2*CSIZEit +β3*EX_IN_Bit+ β4*AUDit+ β5*BSIZEit+ β6*BSIZEit + β7*SSIZEit
Model 2: Corporate Governance on Earnings Management.
EMit = β1 + β2*TA_ASSETi(t-1) + β3*LEVit + β4*ROAit + β5*CSIZEit +β6*BSIZEit + β7*ESIZEit + β8*EX_IN_B +
β9SSIZEit + β10*AUDit
Model 3: Corporate Governance and Earnings Management on Firm Performance.
TOBINQit = β1 + β2*CSIZEit + β3*BSIZEit +β4*ESIZEit + β5*EX_IN_Bit + β6*SSIZEit + β7*AUDit β2 +EMi(t-1) Hypothesis Testing:
Table-2. Relationship between independent and dependent variables. Independent
Variables Variables – TobinQ Dependent Dependent Variables – earnings managementQ
Dependent Variables – TobinQ
CSIZE Negative Positive Negative
EX_IN_B Positive Negative Positive
AUD Positive Negative Positive
BSIZE Positive Negative Positive
ESIZE Positive Positive Positive
SSIZE Positive Negative Positive
ROA Negative Negative
LEV Positive Positive
TA_ASSET Negative Negative
3.4. Descriptive Statistic
First of all, the basic features of independent and dependent variables showing data of 60 companies for a period of three years are presented in the Table 3.
Table-3. Descriptive statistics.
COMPONENT AUD BSIZE CSIZE ESIZE EX_IN_B LEV ROA SSIZE TA_ASSET TOBINQ Mean 0.6556 6.5222 8.3842 6.0778 2.1611 0.2346 0.1014 3.0889 0.0252 3.4870 Median 1.0000 6.0000 8.1023 6.0000 2.0000 0.2330 0.0844 3.0000 -0.0112 2.1307 Maximum 1.0000 11.000 12.103 15.0000 5.0000 0.6578 0.7837 6.0000 8.1798 23.219 Minimum 0.0000 3.000 5.6635 2.0000 0.0000 0.0000 -0.2543 1.0000 -7.7652 0.1879 Std. Dev. 0.4765 1.7543 1.2233 2.2707 1.1044 0.1605 0.0898 0.5522 0.8572 4.0144 Sum 118.00 1174.0 1509.2 1094.0 389.00 42.227 18.244 556.00 4.5347 627.660
First of all, looking at the data of board size, the average number of people was 6.52 people with the maximum number of 11 people and the minimum is 3 people. In the findings of Dao and Hoang (2014) an ideal board size was 7.8 people, rounding up to 8 people per the board of directors. Compared to the findings, it could be said that on average the board size was quite small. It could result in weak corporate governance since a few board of directors members may not govern the firm effectively.
Next, the executive board also had the average number of people falling around 6 people. The largest executive board had 15 people, and the smallest one had 2 people. The size of the executive board was nearly the same as the board size. On the other hand, the next figure about the number of board members who also hold the position of executives only has the average value of 2.16. This could show that normally, one third (1/3) of board members will join the executive board and operate daily.
because it was neither too many nor too few people. The minimum value was 1, this could be due to this one person holding the individual supervisory position, but not a board that has 1 person.
According to the descriptive statistic table, indicator for earnings management (TA_ASSET) had the average value of 0.0252, nearly equalling zero. If only looking at this number, it could be concluded that there was little earnings management. However, the range of this value was from -7.7652 to 8.1798, which shows widespread earnings management.
The audit variable was a dummy variable; therefore, the maximum value was 1 and the minimum was 0. The mean equals 0.6556 and a sum of 118.00 over 180 observations showed that there were more firms with an auditor from the Big 4 companies than those without one.
Two control variables in this paper was company size and leverage ratio. Firm size range was from 5.6635 to 12.103, with a mean of 8.3842. This could be understood as there are different firm sizes so the paper could give reliable results for firms within the population. Leverage ratio was chosen as the control variable for the earnings management model, and the results showed that the level of leverage ranged from 0.00 to 0.678, with a mean of 0.2346, therefore, this paper could study firms with different leverage level. Hence, the findings could be more accurate.
In this paper, two firm performance indicators were ROA and Tobin’s Q. ROA representd the return firms generated within the year, ranging from -0.2543 to 0.7837 with the mean of 0.1014. It could be understood that the major proportion of firms earned positive returns; however, since there was a negative value, therefore, there were firms which made losses during some years. On the other hand, Tobin’s Q measured the market value of the firm. The maximum value of Tobin’s Q was 23.219, which could be due to changes in the market value of firms. The minimum value was 0.1879 showing that there were firms which have a market value lower than their book value. Nevertheless, the average value was 3.4870, meaning that in general firms have a market value higher than book value.
In addition to the descriptive statistic table, the Correlation Matrix table belows gives the information about the correlation between variables AUD, BSIZE, CSIZE, ESIZE, EX_IN_B, LEV, ROA, SSIZE, TA_ASSET and TOBINQ.
Table-4. Correlation matrix.
COMPONENT AUD BSIZE CSIZE ESIZE EX_IN_B LEV ROA SSIZE TA_ASSET TOBINQ
AUD 1.0000
BSIZE 0.0493 1.0000
CSIZE 0.4141 0.1482 1.0000
ESIZE 0.2366 0.0697 0.3769 1.0000
EX_IN_B -0.1381 0.1149 -0.0909 0.2712 1.0000
LEV 0.0601 0.0122 0.1948 0.0096 0.1380 1.0000
ROA -0.0850 0.0455 -0.1646 0.1554 0.0540 -0.4239 1.0000
SSIZE -0.0741 0.2517 0.2060 -0.0546 0.0863 0.0137 -0.0525 1.0000
TA_ASSET 0.0141 0.0124 -0.0115 0.0022 0.0186 0.0294 0.0208 -0.0098 1.0000
TOBINQ 0.2194 0.0783 0.1956 0.0304 0.0090 0.0852 0.1700 0.0748 0.0403 1.0000
of members within the board, executives, leverage and firm performance rose. Some of these contradict the findings of previous studies. CSIZE, SSIZE, however, had negative correlation with TA_ASSET. It was quite consistent with studies that if the number of members on the supervisor board was high; it could reduce the level of earnings management.
Overall, the outcomes with no value higher than 0.8 could deliver the message that there could be no multi-collinearity problem. Later, the auxiliary regression test also confirmed this observation.
3.5. Research Design
Analysis for this paper was based on the historical data of 60 non-financial firms in two stock exchanges for a period of three years, from 2014 to 2016. After necessary data were collected from reliable sources, some data were processed and calculated with mentioned equations to support the research including: Total accrual, Tobin’s Q, company size. Next, regressions were generated to examine the relationship of corporate governance with concerning issues as summarized in Table 5.
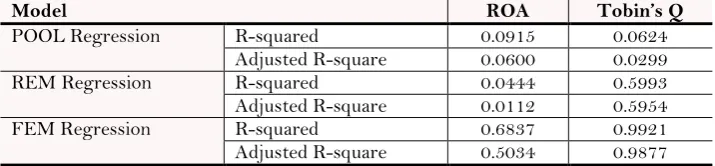
Table-5. Results of regression using ROA and Tobin’s Q as dependent variable.
Model ROA Tobin’s Q
POOL Regression R-squared 0.0915 0.0624
Adjusted R-square 0.0600 0.0299
REM Regression R-squared 0.0444 0.5993
Adjusted R-square 0.0112 0.5954
FEM Regression R-squared 0.6837 0.9921
Adjusted R-square 0.5034 0.9877
At first, the corporate governance and firm performance relationship was tested between corporate governance variables and ROA. However, while conducting the test, findings showed that the equations with ROA have low R-squared and Adjusted R-R-squared, with few significant variables in compared to using Tobin’s Q as the firm performance estimator.
Therefore, Tobin’s Q was chosen as the variable representing firm performance. Then, the best functional model was chosen for analysis influence of corporate governance and firm performance. The model made the log transformation for the value of Tobin’s Q to decrease the heteroscedasticity of the model (Gujarati & Porter, 2004) also, it was possible to use logged form of Tobin’s Q because all the value were higher than 0. By using this log - lin functional, it also helped to measure the scale of the measured variables due to the variables having many different unit of measurement. If there is an increase in one unit of X, Y will increase β%.
Next, a summary of results of POOL, FEM, and REM model were presented in a table. The trial and error method was used to find the best fitted model for determining the relationship of corporate governance with other dependent variables. After best fitted model was chosen, some tests were conducted to test the error of the model. The following steps were performed:
- Step 1: The first test performed was Redundant Fixed Effects to choose between FEM model and POOL
model.
Ho: Fixed effects were redundant (POOL model). HA: Fixed effects were not redundant (FEM model).
The results were based on the outcome of Eviews 9.5 where if p-value is lower than 5% (0.05), the null Hypothesis was rejected, meaning that fixed effects were chosen.
- Step 2: Next, Correlated Random Effect – Hausman Test was implemented to choose between REM and
FEM model.
Eviews 9.5 showed the p-value of the test. If the p-value was lower than 5%, Ho was rejected. In Eviews, the suitable model was presented below the test.
After considering two tests, as well as the Adjusted R-square of panel models, the model with highest Adjusted R-squared was chosen.
- Step 3: Wald – Coefficient Restriction test was taken in order to leave redundant variables which were insignificant (test for variables which were insignificant at 1%, 5%, 10% level).
Ho: Coefficient of variables was insignificant (Dropping is relevant). HA: Coefficient of variables was significant (Dropping is irrelevant).
If the p-value was lower than 0.05, the null Hypothesis was rejected, meaning that variable should be dropped out of the regression model.
- Step 4: After dropping insignificant variables, a summary of POOL, REM and FEM model was produced.
Redundant Fixed Effects Test and Hausman were then implemented again to find the best model. And then Wald – Coefficient Restriction test was performed again to drop insignificant variables at 1%, 5% and 10%.
This process continues until all variables were significant at 1%, 5%, and 10%, and an appropriate POOL, REM, or FEM model was chosen with the highest Adjusted R-squared.
- Step 5: When the final regression equation was obtained, tests for error were conducted.
Since the panel data and panel regression could help the equation reduce Heterosdasticity error, this test could be skipped.
Then, Multi-collinearity error was tested using Correlation Matrix.
Finally, Breusch-Pagan LM test was used to detect the Autocorrelation error.
- Step 6: Final model was then interpreted to see the relationship of independent variables and estimated
dependent variables.
4. QUANTITATIVE MODEL
4.1. Influence of Corporate Governance on Firm Performance
Final regression equation
Estimated LOG(TOBINQ) = 8.269546 - 0.864137*CSIZE - 0.376253*AUD P-value respectively are 0.0000, 0.0063, 0.0000
R-Squared = 99.2192%
The three variable board size, executive size and supervisory size were found to have insignificant impact on the firm performance. Only, company size and auditor of Big 4 have a significantly negative relationship with firm performance, where the influence of auditor was different from the expected sign.
4.2. Influence of Corporate Governance on Earnings Management
Final Regression Model
Estimated earnings management= -0.351978 - 0.497199*EM(-1) + 1.142422*LEV + 0.548685*ROA P-value respectively were 0.0000, 0.0170, 0.0590, 0.0259
R-Squared = 98.8058%
4.3. Influence of Corporate Governance and Earnings Management on Firm Performance
Final Regression Model
Estimated LOG(TOBINQ) = 6.824770 + 0.014679*EM(-1) - 0.678011*CSIZE - 0.044845* SSIZE - 0.399463*AUD
P-value respectively are 0.0432, 0.0000, 0.0436, 0.0009, 0.0000 R-Squared = 99.6637%
In the model, these variables as previous year earning management, company size, supervisory size and auditor have significant relationship with firm performance. In the next part we will present the discussion of finding and conclusion.
5. CONCLUSION
5.1. Discussion of Findings
5.1.1. Results on the Impact on Firm Performance 5.1.1.1. Company Size
First and foremost, the results showed that company size was negatively related and also significant to Tobin’s Q. If the company size increased, it meant firm performance decreased. Company size plays an important part in corporate governance because the larger the firm, the more attention owners and executives need to pay to manage the operation well. There are studies which also support this finding.
In the study on Turkey market, Oguz and Dincer (2016) also found out that firm size has negative relationship with all three indicators of firm performance (ROE, ROA, and Tobin’s Q). Other studies also support this finding: the paper on Indian manufacturing firms also shows that firm size affected Tobin’s Q negatively in two year times (Gill et al., 2013). In other research, Nenova (2003)’s findings showed that if the firm is getting larger, it will cost a lot for company to manage to govern the daily work. When cost increases, it could lead to lower the profit of the firm. Since Tobin’s Q is calculated using market value divide to total assets, in terms of mathematic view, if total assets increase but market value increase at a slower pace and cannot surpass total asset, then the ratio decreases. Another problem raised by large firms was that they could easily have agency problems; therefore, agency costs could influence the performance of the whole company.
5.1.1.2. Auditor
Secondly, findings on types of auditors also illustrated an interesting outcome. Auditor had a negative and significant relationship with firm performance. This means that if the auditors of the company came from Big 4 auditing companies, then the firm performance was lower. The findings here are opposite to other findings.
5.1.1.3. Supervisory Size
The third component of corporate governance was supervisory size. Results showed that if the firm has a large supervisory board with many members, the firm performance will decrease. In fact, the supervisory board is an independent board that supervises the whole activities of executives in the firm. The findings show an opposite idea from other studies is that if the number of people in the board increases, firm performance will decrease. It could be understood as if the company has large a supervisory board, it might not be a good idea since a large board means that there could be a redundancy in resources. This could cost the company a lot. Too many people in a position could cause conflict within the firm and reduce the effectiveness of corporate governance. However, other studies indicate that if the size of an accounting committee is large, it could help the firm supervise the financial information better (Anderson et al., 2004; Naimah & Hamidah, 2017) hence, it could bring better performance for the firm.
5.1.1.4. Executives in Board; Executives in Board Relative with Supervisory Size
Next, from the above findings, it could be drawn out that the number of members holding both executive and board of directors position has no significant relationship with firm performance. However, while doing research, an interesting point was illustrated. In terms of number and data processing, if the number of members having due positions on the board of directors and on the executive board increases together with supervisory board, it could leave a significant impact on the performance. This could mean that if the number of board of director members holding executive positions increases alone, it does not have any impact on the firm, let alone it could bring bad effects. If the number of due position members increases alone, it could leads to a situation when those people could behave badly in their own interests. However, if the due position members increase in proportion with the supervisory board, it could increase firm performance.
Together with the findings above about supervisory board, it could show such a meaningful result. If the size of supervisory board or the number of due position members increases alone, it could badly affect the firm since it could be a waste of resource, or it could be self-interest problems. However, if the two numbers rise together in proportion, the work of the executive could be supervised better; hence, better firm performance in the future.
5.1.1.5. Earnings Management
The final significant factor affects firm performance in this paper is earnings management. The results showed that the earnings management of the previous period increasing will lead to an increase in firm performance. It could be understood as earnings management helping to smooth the earnings of the company; therefore, it could make the firm performance of the following period better. Another point is that firm performance in this paper was Tobin’s Q ratio. If the earnings management could make the earnings look better, the firm will have good image in investors’ eyes and could show a constant growth rate; therefore, demand for stock could increase, leading to a rise in stock price and a change in market value of the firm. In the end, Tobin’s Q ratio will also increase.
Other variables of the board size and executive size showed no significant impacts on firm performance. The findings in this paper also agree with findings in some other papers with board size was found to have no significant influence with firm performance (Naimah & Hamidah, 2017; Oguz & Dincer, 2016).
5.1.2. Results on the Impact on Earnings Management 5.1.2.1. Earnings Management
earnings management make the total accruals increase, in the next year, the manager could reduce the total accruals of that year to balance the effect of earnings management on firm financial information and firm performance.
5.1.2.2. Control Variables
In this paper, the leverage ratio and ROA was chosen as control variable for analyzing earnings management. Empirical study illustrated that the leverage ratio has a significant and positive relationship with earnings management. This agrees with previous findings, showing that if the leverage rises, the level of earnings management will also rise. It was explained as managers tend to manipulate earnings to make the financial information looks better in creditors’ eyes (Chen & Zhang, 2012). Therefore, if there is any loan covenant that restricts on the condition of the earnings the firm, managers could try to manipulate information to avoid covenant violation. On the other hand, ROA in this study was used as an indicator representing the profitability of the firm. In addition, there was a positive and significant relationship between ROA and earnings management. It could be explained by the fluctuation of the market in the period of 2014 to 2016 that makes managers to manipulate earnings in order to make earnings look good. This finding was also similar to that of Mansor et al. (2013).
Other variables representing corporate governance such as board size, supervisory size, executive size, executives in board, and auditors statistically had no impact on earnings management.
5.2. Research Limitation and Recommendation for Future Research 5.2.1. Research Limitation
First of all, three equations were used to find relationship of corporate governance on firm performance and earnings management, and the relationship of corporate governance and earnings management on firm performance had an auto-correlation error. This error could lead to a large variance. since the variance was not the smallest value, the confidence interval was large, and t-value was smaller; hence, a lower chance to reject Ho. It could result in Type II error when one fails to reject a false Ho. For equation error, the Auto-correlation problem could be reduced by using First-difference transformation, meaning that in Eviews, we could try to add D() to the variable. Secondly, the Cochrane-Orcutt Iterative Procedure was run in Eviews by adding AR(1) in the estimation specification. However, since the time period in this paper was only three years, the remedial measures do not mean much.
Secondly, the study only focuses on some factors of corporate governance, firm performance and earnings management. There are still many other factors; however, due to a time limitation and ability limitation in obtaining all data, there was information of only 60 companies for a period of three years (2014 to 2016), and data were collected from 2013 to 2014. Few observations make the result unable to be general enough for the whole population of more than 700 companies in the two large stock exchanges (HNX and HOSE).
Thirdly, in Vietnam, there are few studies on corporate governance, firm performance and earnings management; therefore, studies found in the literature review could only show the findings of other countries and other time periods and it could not reflect the real situation as well as the empirical studies in Vietnamese market. Especially, as the major of studies on corporate governance were for banking sectors, not the bank or non-financial sectors.
The fourth limitation was the lack of knowledge and time available for fully and deeply research of the topic and methodology, since there were many other quantitative methods that could be used to analyze the information.
5.2.2. Future Research Opportunities
be analyzed. In order to find the effect of time series, a longer time period is needed. Different factors of corporate governance and earnings management, as well as different measures of firm performance need to be brought into study.
Other independent variables representing corporate governance which are not included in this paper could be added to analyze the connection among these three. For example, independent variables could be the percentage of state-ownership, board independence, current ratio, number of meetings of BOD, etc.,. Beside Tobin’s Q and ROA used as measurement of firm performance, future research could study the influences of corporate governance on other firm performance measurements such as Market-Book-Value or ROE.
Hopefully, more future research about this problem could be carried out in order to bring more accurate findings about corporate governance, firm performance and earnings management, especially when these subjects cause a lot of concerns and controversy among researchers. More studies in specific industries should be conducted.
5.3. Summary
This study explored the relationship between corporate governance and the firm performance of non-financial companies. The study then investigated the influence of corporate governance on earnings management. Finally, the paper combined corporate governance and earnings management to find their impacts on firm performance.
The results showed that firm performance was affected by both corporate governance and earnings management. Therefore, shareholders/owners of the firm should pay attention to improve its corporate governance in order to achieve good market value. Earnings management needs to have more attention due to its influence on the firm performance.
This paper used a balanced panel data of 20 non-financial companies in a period of three years from 2014 to 2016. Through the study, significant influence of company size, auditor, supervisory size, and earnings management on firm performance was proved by empirical results. Company size, auditors and supervisory size had a negative influence on firm performance. Earnings management was shown to have a positive relationship with firm performance.
Some factors such as the first lagged term of earnings management, leverage ratio and ROA also affected earnings management. Even though the first lagged term of earnings management was negatively affected the current one, the leverage ratio and ROA showed positive relationship with current earnings management. Based on the study, companies could identify what factors they must improve in order to supervise and control the act of manipulate earnings in their company.
It was recommended that firms need to pay more attention to their corporate governance and firm performance, as well as understand the concept of earnings management. Companies, especially large firms, should strengthen their corporate governance as large firms could easily lose track and not control the whole operating system.
The role of supervisory board is crucial in ensuring the executives perform their work efficiently. In earnings management, it is important for a firm to find the exact level where the earnings management does not affect the long-run outcome and firm performance, so as to keep the financial information transparent and reliable for investors and owners. Managers need to understand that earnings management is for smoothing the earnings only, not for fraud or self-interest. On the other hand, as an investor, people need to pay more attention not only to the financial information firms published on the internet, but also investigate and understand the organizational structure and corporate governance of the company to make any investment decisions.
Funding: This study received no specific financial support.
Competing Interests: The authors declare that they have no competing interests.
Acknowledgement: Both authors contributed equally to the conception and design of the study.
REFERENCES
Abed, S., Al-Attar, A., & Suwaidan, M. (2012). Corporate governance and earnings management: Jordanian evidence. International Business Research, 5(1), 216-225.Available at: https://doi.org/10.5539/ibr.v5n1p216.
Adams, R., & Mehran, H. (2005). Board structure and banking firm performance. Federal Reserve Bank of New York Economic Policy Review, 9, 123-142.
Anderson, R. C., Mansi, S. A., & Reeb, D. M. (2004). Board characteristics, accounting report integrity, and the cost of debt. Journal of Accounting and Economics, 37(3), 315-342.Available at: https://doi.org/10.1016/j.jacceco.2004.01.004. Andres, D. P., Azofra, V., & Lopez, F. (2005). Corporate boards in OECD countries: Size, composition, functioning and
effectiveness. Corporate Governance: An International Review, 13(2), 197-210.Available at:
https://doi.org/10.1111/j.1467-8683.2005.00418.x.
Bešlić, I., Bešlić, D., Jakšić, D., & Andrić, M. (2015). Testing the models for detection of earnings management. Industrija, 43(3), 55-79.Available at: https://doi.org/10.5937/industrija43-8035.
Black, B. S., Love, I., & Rachinsky, A. (2006). Corporate governance indices and firms' market values: Time series evidence from
Russia. Emerging Markets Review, 7(4), 361-379.Available at: https://doi.org/10.1016/j.ememar.2006.09.004.
Buallay, A., Hamdan, A., & Zureigat, Q. (2017). Corporate governance and firm performance: Evidence from Saudi Arabia. Australasian Accounting, Business and Finance Journal, 11(1), 78-98.Available at: https://doi.org/10.14453/aabfj.v11i1.6. Chen, J. J., & Zhang, H. (2012). The impact of the corporate governance code on earnings management – evidence from Chinese
listed companies. European Financial Management, 20(3), 596-632.Available at: 10.1111/j.1468-036X.2012.00648.x.
Chen., S. S., & Huang, C. W. (2014). The Sarbanes-Oxley act, earnings management, and post-buyback performance of open-market repurchasing firms. 48.
Dao, B., & Hoang, G. (2014). VN30 index: Corporate governance and performance analysis. Retrieved from SSRN:
https://ssrn.com/abstract=2543097 or http://dx.doi.org/10.2139/ssrn.2543097.
Dechow, P. M., & Skinner, D. J. (2000). Earnings management: Reconciling the views of accounting academics, practitioners, and regulators. Accounting Horizons, 14(2), 235-250.Available at: https://doi.org/10.2308/acch.2000.14.2.235.
Driel, H. (2019). Financial fraud, scandals, and regulation: A conceptual framework and literature review. Journal Business History, 61(8), 1259-1299.Available at: https://doi.org/10.1080/00076791.2018.1519026.
Eisenhardt, K. M. (1989). Agency theory: An assessment and review. The Academy of Management Review, 14(1), 57-74.Available
at: 10.2307/258191.
Elitzur, R. (2011). The accounting art of war: Bounded rationality, earnings management and insider trading. Journal of Accounting and Public Policy, 30(3), 203-216.Available at: https://doi.org/10.1016/j.jaccpubpol.2010.11.002.
Eviews. (2017). Eviews guide. Retrieved from
http://www.eviews.com/help/helpintro.html#page/content/panelwf-Working_with_Panel_Data.html.
Finance, J. O. (2013). Vietnam economic relations 2013 and South Vietnam 2014. Retrieved from
http://tapchitaichinh.vn/nghien-cuu--trao-doi/trao-doi-binh-luan/nhan-dinh-kinh-te-viet-nam-nam-2013-and-million-year-men-2014-34187.html.
Finance, J. O. (2015). Vietnam economic competition 2014 and Vietnam 2015. Retrieved from
http://ndh.vn/buc-tranh-kinh-te-viet-nam-nam-2014-va-trien-vong-nam-2015-20150215062856924p4c145.news.
Freeman, R. E. (1984). Strategic management: A stakeholder approach: Cambridge University Press, 2010.
Gill, A., Biger, N., Mand, H. S., & Mathur, N. (2013). Earnings management, firm performance, and the value of Indian manufacturing firms. International Research Journal of Finance and Economics, 116(1), 121-131.
Ha, N., Hang, T., & Thanh, T. (2017). Enclosing to implement the company management of Vietnam. Retrieved from
http://enternews.vn/bao-dong-thuc-trang-quan-tri-cong-ty-cua-dn-viet-nam-109672.html.
Hamdan, A., Maher, S. M. S., & Al-sartawi, A. (2016). The audit committee characteristics and earnings quality- evidenc.
Hang, T. (2018). Vietnam's economy is developing favorably. Retrieved from
http://www.sggp.org.vn/kinh-te-viet-nam-phat-trien-an-tuong-516022.html.
He, D., Gelos, G., Elekdag, S. A., Marques, L. B., Feng, A. X., Han, X., . . . Alter, A. (2016). Corporate governance, investor protection, and financial stability in emerging markets in October 2016 Global Financi. Retrieved from:
https://www.researchgate.net/publication/308724149_Corporate_Governance_Investor_Protection_and_Financial_S
tability_in_Emerging_Markets_in_October_2016_Global_Financial_Stability_Report?fbclid=IwAR0xAjqU3V2F-TAw81WDuar0tUneZVcT2Yi3bgAQ-74tgRWvwNhrm9ygc3Qal Stability Report. October 2016 Global Financial
Stability Report. International Monetary Fund.
Hernandez, M. (2012). Toward an understanding of the psychology of stewardship. Academy of Management Review, 37(2),
172-193.Available at: https://doi.org/10.5465/amr.2010.0363.
Herrmann, D., & Inoue, T. (1996). Income smoothing and incentives by operating condition: An empirical test using depreciation changes in Japan. Journal of International Accounting, Auditing and Taxation, 5(2), 161-177.Available at: https://doi.org/10.1016/S1061-9518(96)90003-8.
Hochberg, Y. V., Newman, Y. S., & Rierson, M. A. (2004). Information in the time-series dynamics of earnings management: Evidence from insider trading and firm returns. Working Paper, Northwestern University.
Jones, J. J. (1991). Earnings management during import relief investigations. Journal of Accounting Research, 29(2), 193-228.Available at: https://doi.org/10.2307/2491047.
Khatab, H., Masood, M., Zaman, K., Saleem, S., & Saeed, B. (2011). Corporate governance and firm performance: A case study of
Karachi stock market. International Journal of Trade, Economics and Finance, 2(1), 39- 43.Available at:
https://doi.org/10.7763/ijtef.2011.v2.76.
Li, D. S. F., McDowell, D. E., & Moore, D. E. (2011). Accrual based earnings management, real transactions manipulation and expectations management: U.S. and international evidence. Working Paper.
Mansor, N., Che-Ahmad, A., Ahmad-Zaluki, N. A., & Osman, A. H. (2013). Corporate governance and earnings management: A
study on the Malaysian family and non-family owned PLCs. Procedia Economics and Finance, 7, 221-229.Available at:
https://doi.org/10.1016/S2212-5671(13)00238-4.
Michael, J., & William, M. (1976). Theory of the firm: Managerial behavior, agency costs and ownership structure. Journal of
Financial Economics, 3(4), 305-360.Available at: https://doi.org/10.1016/0304-405x(76)90026-x.
Naimah, Z., & Hamidah. (2017). The role of corporate governance in firm performance. Paper presented at the 17th Annual Conference of the Asian Academic Accounting Association (2016 FourA Conference).
Nazir, M. S., & Afza, T. (2018). Does managerial behavior of managing earnings mitigate the relationship between corporate governance and firm value? Evidence from an emerging market. Future Business Journal, 4(1), 193-156.Available at: https://doi.org/10.1016/j.fbj.2018.03.001.
Nenova, T. (2003). The value of corporate voting rights and control: A cross-country analysis. Journal of Financial Economics,
68(3), 325-351.Available at: https://doi.org/10.1016/s0304-405x(03)00069-2.
Nga, Q. (2014). Business management in Vietnam: Spending 23% of businesses with knowledge. Retrieved from
http://cafef.vn/quan-tri/quan-tri-doanh-nghiep-o-viet-nam-chi-23-doanh-nghiep-hieu-dung-201406061553205707.chn.
Oguz, E., & Dincer, H. H. (2016). Corporate governance and firm performance: The case for Turkey. Master Level, Lund University.
Perry, S. E., & Williams, T. H. (1994). Earnings management preceding management buyout offers. Journal of Accounting and
Economics, 18(2), 157-179.Available at: https://doi.org/10.1016/0165-4101(94)00362-9.