A multi-step assembly process: drawing, flanging and
hemming of metallic sheets
P.Y. Manach1,a, N. Le Maoˆut1, and S. Thuillier1
LIMATB, Universit´e de Bretagne-Sud, 56321 Lorient, France
Abstract. This paper presents hemming tests on complex geometries, combining curved surfaces and radii of curvature in the plane. The samples are firstly prestrained in order to obtain a strain history prior to flanging and hemming. The choice of the sample geome-tries as well as prior plastic strains is based on a survey of current geomegeome-tries hemmed in automotive doors. A device has been designed to hem these samples both by classical and roll-hemming processes and to allow a comparison between both technologies. Roll-in, which characterizes the change of geometry of the hemmed zone between flanging and hemming, and loads are obtained during this multistep process. Results show that roll-in observed in roll-hemming is lower than in classical hemming and that its evolution greatly differs between the two processes. The analysis of the results on different samples shows that it is difficult to establish rules on the variation of other parameters in such a complex multistep process and that it requires an intensive use of numerical simulation.
1 Introduction
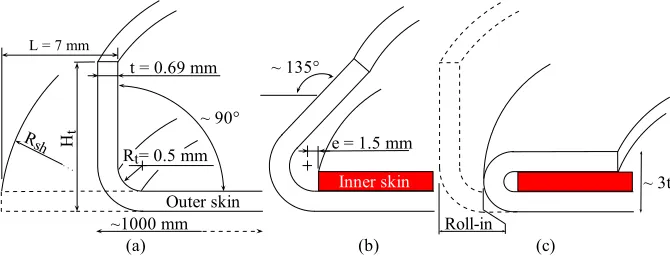
Hemming is an assembly process by plastic deformation which consists of bending a small height of a sheet, called the outer part, over another, called the inner part [1]. This assembly method is widely used in the automotive industry for the opening parts of vehicles, to join the outer panel to the reinforc-ing inner part. The process is usually performed in three steps: flangreinforc-ing, pre-hemmreinforc-ing, and hemmreinforc-ing (Fig.1). Flanging is the last step of the drawing operation and consists in bending the sheet up to around 90◦. Pre-hemming is done after the inner part is placed on the outer part and increases the bending angle to around 135◦ to prepare for the next operation. Finally, the hemming tool folds the outer part over the inner skin.
Fig. 1.Steps of (a) flanging, (b) pre-hemming, and (c) hemming. The characteristic parameters are a flanging heightHt, a flanging radiusRt,eis the position of the inner part. Outer and inner parts have the same thicknesst
a e-mail:[email protected]
© Owned by the authors, published by EDP Sciences, 2010 DOI:10.1051/epjconf/20100608004
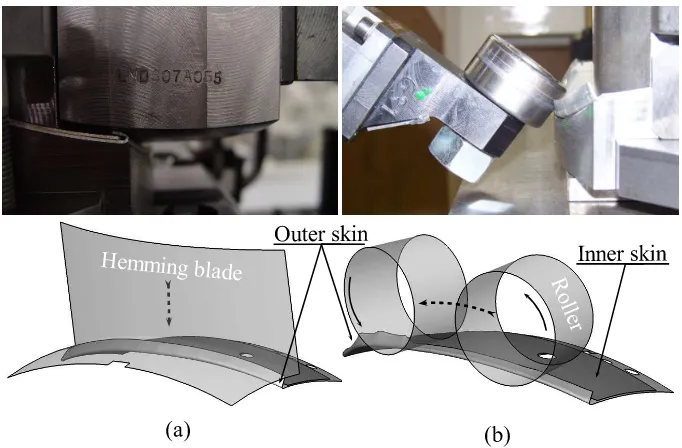
There are two main industrial hemming technologies, the classical hemming process, and the roll-hemming process. The former makes use of roll-hemming units situated all around the opening part. Pre-hemming, and later Pre-hemming, blades simultaneously assembly the opening part (Fig.2.a). The latter uses a roller guided by a handling robot along the hemming line [2] (Fig.2.b). The roller, which freely rotates around its revolution axis, pre-hems, then progressively hems the flanged edge of the opening part. The advantage of this method is its very low cost while the main drawbacks are the high process time compared to the very short one of the classical hemming. Despite the difficulties to hem parts with complex geometries, the use of this process has shown a high increase during the five past years [3]. The hemming process generates a modification of the final dimensions of the assembly which is difficult to anticipate. This dimensional reduction, called roll-in, modifies the esthetic of the vehicle because the clearance between the opening part and the body of the vehicle may not remains constant.
Fig. 2.Classical (a) and roll-hemming (b) processes
Some studies were carried out with classical hemming on planar geometries which do not always reflect reality because the testing protocol does not let one reproduce the strain history of a sheet in an industrial context [4]. In this study, a series of tests is performed to hem samples with more complex geometries and strain histories than planar straight edged ones. To study the influence of geometry and the state of pre-strain on roll-in and load, as well as to build a reference for comparison with the numerical simulation, this investigation gathers experimental data on the hemming of concave or convex hemmed-edge curved surface samples. An experimental set-up has been designed to study both classical and roll-hemming processes. The samples are pre-strained through biaxial tests to obtain a strain geometry and history similar to that of industrial parts. Flanging, pre-hemming, and hemming loads are recorded and geometrical measurements are taken after each step for steels samples.
2 Material and experiments
A E220BH steel sheet of 0.69 mm thickness was studied. The samples are characterized by a curved surface radius Ssh (convex) orSst (concave) and a hemming edge radius Esh (Fig.3). RadiiSsh or
Sst are obtained by sample pre-strain before the flanging operation, due to the biaxial bulge test set
configurations to evaluate the influence of orientation on the curvature radius.
SURFACE
Stretch
Shrink
E
D
G
E
Sh
ri
nk
Fig. 3.Classification of studied samples with associated geometrical parameters
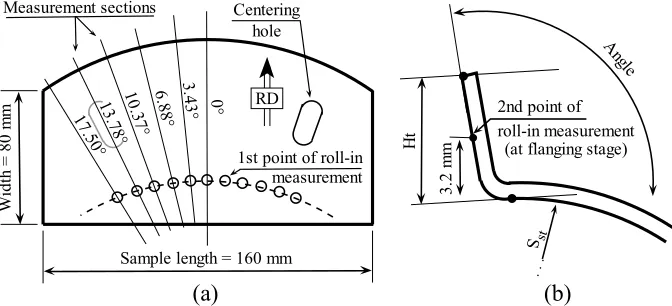
Fig.4.a presents the measured sections of the geometry, the one at 0◦ corresponds to the rolling direction (RD). The measurements for the flanging height and the opening angle, as well as the roll-in reference, are given in Fig.4.b. Roll-in is calculated by using the distance between the points (1st point and 2nd point at 3.2 mm from the surface) as a reference during flanging. For the pre-hemming, and hemming steps, the second point is the one farthest away in the bent zone. A±0.02 mm precision vernier caliper was used to measure the flanging height and the roll-in. The opening angle after flang-ing was measured with a±0.5◦precision protractor.
Fig. 4.Details of the measurements of geometric parameters after springback during the flanging step
A hemming device was designed to hem pre-strained samples [5]. The device fits on a 500-kN-capacity tensile testing machine. The dies are mounted on a guide rail so that horizontal loads can be transmitted to a ± 50 kN capacity load sensor. The vertical load on the blades is measured by the load cell of the machine. The flanging die and blank-holder have a flanging radius of 0.5 mm, which allows both configurations,Ssh1EshandSst1Esh, to be flanged by simply turning the tools over.
A removable plate that holds the dies and blank-holders can be taken offfor roll-hemming with a robot.
3 Flanging
For the flanging operation, the position of the sample on the die is adjusted to have an identical outer edge/die distance at three points (center and centering holes), with a depth gauge. A value ofL=6±
(a) (b)
5 6 7 8 9 10
0 2 4 6 8 10 12 14 16 18
Angle from sample center (°)
Flanging height (mm) Sst1Esh
Ssh1Esh
0 5 10 15
0 2 4 6 8 10 12 14 16 18
Angle from sample center (°)
Bending springback (°) Sst1Esh
Ssh1Esh
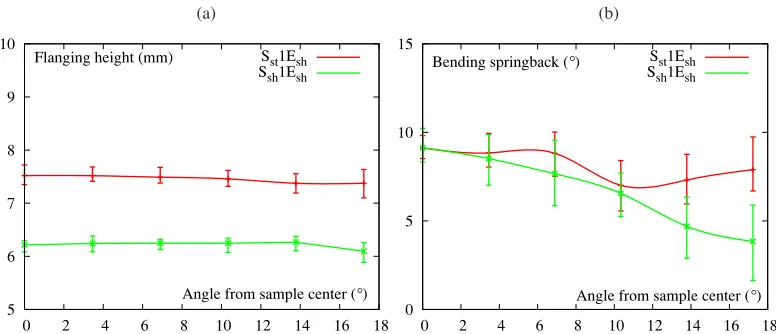
Fig. 5.Measurement of the flanging height (a) and the opening angle (b) after the flanging operation. The curves represent an average of the two halves of the samples plotted on the right side
Fig.5.a shows the flanging height obtained for both configurations. The first point of contact of the measurement is situated at the beginning of the flanging radius and the second at the top of the flanged edge (Fig.1.a). The vertical error bars represent the dispersion of the six tests that were carried out (three samples per hemming technology), uncertainty of measurements, as well as the divergence between the two halves of the sample. For this material, the flanging height is rather constant along the curved edge, but 21% higher in the case of configurationSst1EshthanSsh1Esh. Differences are also
observed for the opening angles in Fig.5.b. Both configurations present a similar springback evolution, the value of which is more important in the center of the sample and decreases near the free edges. The influence ofSsh/stleads to a large difference on the bending springback of configurationSsh1Esh
near the free ends.
-6 -4 -2 0 2 4
0 2 4 6 8 10 12
Load (kN)
Blade displacement (mm) Horizontal load
Vertical load
Sst1Esh
Ssh1Esh
Fig. 6.Evolution of loads obtained during flanging
Fig.6 gives load evolution during flanging. The first load increase cor-responds to the folding of the sheet against the radius of the flanging die [6]. The load decrease is linked to bringing the flanged edge closer to the die. Finally the nonzero load at the end of flanging is due to friction between the blade and the sheet [7]. The sign of the loads has been arbitrarily chosen to facilitate the reading of different results on the figure. The vertical loads are higher for the configurations of type Ssh, The difference between both
con-figurations being about 100 %. This ob-servation correlates with a largest sen-sitivity to wrinkling of these configura-tion.
4 Pre-hemming
contact surface of the pre-hemming blade with the sheet is inclined at 45◦in relation to the surface of the die. The absence of horizontal movement of the blade prevents the risk of visual defects due to greater deflection of the outer part on the die [8]. The displacement velocity of the mobile plate is 5 mm.min−1. Fig.7 shows the samplesSsh1EshandSst1Eshafter pre-hemming. A large distance is
observed between the edge of the sample and the blanh-holder, because the hemming dies and blank-holders were created to be able to adapt to a classical hemming and roll-hemming work environment.
(a) (b)
Fig. 7.Pictures of samples (a)Ssh1Eshand (b)Sst1Eshat the end of the pre-hemming operation
For the roll-hemming process the kinematics of the roller is imposed by a handling robot. A 47 mm cylindrical roller, Fig.2.b is mounted on a ball bearing giving it free rotation on its revolution axis. A sensor, placed above the roller records the compressive loads applied along the direction of the robot arm. A spring placed between the roller and the robot arm helps compensate for difficult passages for the roller, especially in the case of wrinkling. The trajectory of the robot is determined so that the arm is constantly normal to the die surface. The second condition to set up the robot, in the so-called normal way, imposes aligning the roller revolution axis with the radius normal of the hemming edge.
(a) (b)
−8 −6 −4 −2 0 2 4
0 1 2 3 4 5 6 7 8 Effort (kN)
Blade displacement (mm) Horizontal load
Vertical load
Sst1Esh Ssh1Esh
0 200 400 600
0 30 60 90 120 150 Load (N)
Sample length (mm) Descent
Sst1Esh Ssh1Esh
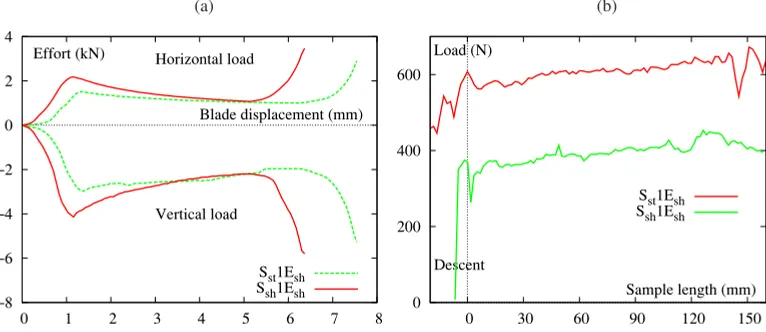
Fig. 8.Load vs blade displacement during pre-hemming for classical (a) and roll-hemming (b) processes
Fig.8.a gives the evolution of pre-hemming loads during classical hemming. The first load increase is linked to the inclination of the edge to 90◦after springback following the flanging step. The load decrease is due to the flexion of the edge around the plastic hinge formed at the level of the flanging radius [7, 8]. The length of the plateau, expressed through pre-hemming blade displacement, corre-sponds to the end of the first increase and the beginning of the second load increase. Finally, to obtain a 45◦angle after sprinkback, the blade only presses on the bent zone which leads to a significant load increase. A large difference can be seen over the entire blade displacement. This phenomenon is linked to the difference of flanging height value which is higher for configurationSst1Eshleading to a larger
blade displacement to reach the prescribed pre-hemming angle.
Fig.8.b gives the evolution of pre-hemming loads during roll-hemming. The evolution of the load during the descent of the roller is similar to that observed for classical pre-hemming. A first increase is generated by the inclination of the edge, then the load stabilizes. The value of the load during this descent is generated by the crushing of the folded zone. During the progress of the roller, the pre-hemming load is rather constant, of the order of 350 N for configurationSsh1Esh and 600 N for
Sst1Esh, since this material is not very sensitive to the appearance of wrinkles. Once again, the higher
value observed for configurationSst1Eshis due to its higher flanging height.
0 0.2 0.4 0.6 0.8 1
−15 −10 −5 0 5 10 15
Angle from sample center (°) Roll−in (mm)
Sst1Esh (Classical) Ssh1Esh (Classical) Sst1Esh (Rolling) Ssh1Esh (Rolling)
Fig. 9.Evolution of roll-in after classical and roll pre-hemming
Fig.9 presents roll-in measure-ments at the end of pre-hemming for both processes. Roll-in is lower near the free edges and in the center of the sample. For both hemming processes, it is observed that the orientation of the radius of curvature has a large influ-ence on the value of the roll-in. Config-urationSsh1Eshpresents a lower roll-in
thanSst1Eshof the order of 43%. The
value of 0.35 mm is rather weak of the order of half the thickness of the sheet. Concerning the roll-hemming process, the roll-in measured for the configura-tionSsh1Eshis on average twice lower
than for classical hemming. It remains relatively stable over the length of the sample with nevertheless some signifi-cant variations at the ends of the sample, which correspond to the lowering of the rollers. For configu-rationSst1Esh, the average roll-in value is similar for both processes.
5 Hemming
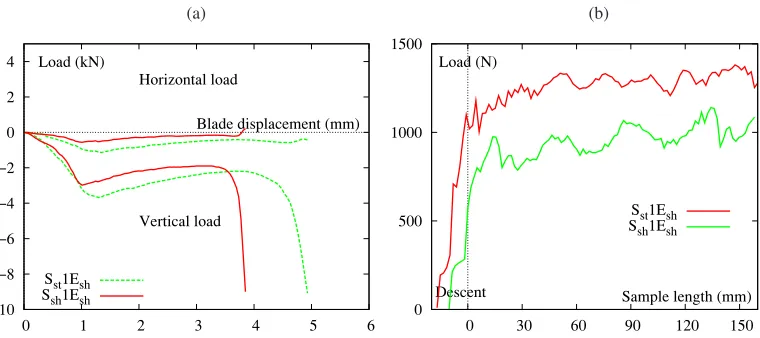
Fig.10.a shows the evolution of hemming loads in classical hemming. The maximum displacement of the blade is determined to get a hemmed thickness, before springback, that is three times the initial thickness of the sheet. The first load increase is due to the tilt of the sheet at 45◦after pre-hemming springback. The increase of the distance between the load application point and the bent zone leads to a load decrease to bend the sheet. Finally, the blade greatly presses on the bent zone to obtain the desired thickness of the assembly, which leads to a significant load increase. Furthermore, the end of this step is marked by the roll-out of the sheet, as well as a change in sign of the horizontal load.
(a) (b) −10 −8 −6 −4 −2 0 2 4
0 1 2 3 4 5 6
Load (kN)
Blade displacement (mm) Horizontal load
Vertical load
Sst1Esh Ssh1Esh
0 500 1000 1500
0 30 60 90 120 150 Load (N)
Sample length (mm) Descent
Sst1Esh Ssh1Esh
Fig. 10.Load vs blade displacement during hemming for classical (a) and roll-hemming (b) processes
at the end of pre-hemming. The evolution of the load is similar to that observed during pre-hemming, i.e. a higher constant force of 1200 N for configuration Sst1Esh which presents the higher flanging
height and of the order of 900 N for configurationSsh1Esh.
0 0.2 0.4 0.6 0.8 1
−15 −10 −5 0 5 10 15
Angle from sample center (°) Roll−in (mm)
Sst1Esh (Classical) Ssh1Esh (Classical) Sst1Esh (Rolling) Ssh1Esh (Rolling)
Fig. 11.Evolution of the roll-in after classical and roll-hemming
Fig.11 presents the roll-in for both configurations at the end of the mul-tistep process by roll-hemming and classical hemming. Different evolu-tions are observed for each process. In classical hemming, for both config-urations, a small roll-out is observed. In roll-hemming, there is a significant difference between the roll-in mea-sured at the end of pre-hemming and hemming. The configuration Ssh1Esh
shows a roll-in 400 % less than the classical hemming, since the descent of the roller during pre-hemming causes more roll-in on the edge of the sample. For both configurations, the curves ob-tained during roll-hemming presents a strongly non symmetric shape. This observation highlights the fact that this process does not allow for a symmetric geometry as the classical hemming process. This phenomenon is partly due to a larger deformation of the sheet during the descent of the roller. The inverse path of the roller does not com-pletely compensate for this phenomenon. However, like classical hemming, configuration Ssh1Esh
stands out with a higher roll-in value for its ends, with a difference of 380% from its center. Roll-in variations can be noted along the hemmed edges, which points out the high wrinkling sensibility of this hemming technology.
6 Conclusions
these samples both by classical and roll-hemming processes and to allow a comparison between both technologies. The purpose was to help the understanding of phenomena generated during hemming by establishing rules for predicting, from a curved surface with a radius of curvature in the plane, the roll-in and other geometric parameters such as the opening angle and the flanging height. The analysis of the results on different samples shows that it is difficult to establish such rules in such a complex multistep process. The use of numerical simulation can nevertheless predict each stage of deep drawing and hemming [10]. All these tests also provide an experimental database on the load evolution and the geometric parameters such as roll-in. Results show that the roll-in as well as the load from roll-hemming are lower than from classical hemming and that their evolutions greatly differ between the two processes.
References
1. H. Livatyali, A. M¨uderriso˘glu, M.A. Ahmeto˘glu, N. Akgeman, G. Kinzel, T. Altan, J. Mat. Proc. Tech.,98, (2000) 41-52
2. S. Thuillier, N. Le Maoˆut, P.Y. Manach, D. Debois, J. Mat. Proc. Tech.,198, (2008) 226-233 3. X. Hua, Z.Q. Lina, S.H. Li, Y.X. Zhao, Mat. & Des.,31 (3), (2010) 1410-1416
4. H. Livatyali, S.J. Larris, J. Mat. Proc. Tech.,153-154, (2004) 913-919
5. N. Le Maoˆut, S. Thuillier, P.Y. Manach, Exp. Mech., (2010) doi 10.1007/s11340-009-9297-7 6. H. Livatyali and T. Altan, J. Mat. Proc. Tech.,117, (2001) 262-268
7. A. M¨uderriso˘glu, M. Murata, M.A. Ahmeto˘glu, G. Kinzel and T. Altan, J. Mat. Proc. Tech.,59, (1996) 10-17
8. H. Livatyali, A. M¨uderriso˘glu, M.A. Ahmeto˘glu, N. Akgeman, G. Kinzel and T. Altan, J. Mat. Proc. Tech.,98, (2000) 41-52
9. C. Lange, Tech. de l’ing´enieur,BM 7 866, (2008) 1-19