1Department of Neurobiology, Tel Aviv University. 2Sagol School of Neuroscience, Tel Aviv
University. 3Department of Psychology, Hebrew University of Jerusalem
*Corresponding author
The Cue-Approach Task as a General Mechanism for Long-Term Non-Reinforced
Behavioral Change
Tom Salomon1, Rotem Botvinik-Nezer1,2, Tony Gutentag3, Rani Gera1, Roni Iwanir1, Maya
Tamir3, Tom Schonberg*1,2
Tel Aviv University
Author Notes
This work was supported by the Israeli Science Foundation (ISF number 1798/15) and the European Research Council (ERC) under the European Union's Horizon 2020 research and innovation programme (grant agreement n° 715016) granted to Tom Schonberg.
*Correspondence concerning this article should be addressed to Tom Schonberg, Department of Neurobiology, Faculty of Life Sciences, and Sagol School of Neuroscience, Tel Aviv University, Ramat Aviv 6139001, Tel Aviv, Israel. Email: [email protected].
Author Contributions
T.Sa. designed experiments, collected and analyzed data and wrote the manuscript. R.B.N. contributed to the design of the experiments and write-up of manuscript. T.G, R.G and R.I. collected data and assisted with manuscript write-up. M.T. contributed to the design of the experiments and manuscript write-up; T.Sc. design experiments, assisted with data analysis and wrote the manuscript with T.Sa. All writers actively contributed to the writing process of the manuscript.
2
Abstract
3
Behavioral change is an essential tool to improve health and quality of life, from treating addictions to eating and mood disorders1–3. Scientific research on behavioral change mainly
focused on the effects of external reinforcements2,4–7 or altering the presentation of the decision
problem8–10. Recently, the Cue-Approach Task (CAT)11 was introduced as a successful method for
enhancing preferences for food items, without external reinforcement, context change or self-control. Here, we test multiple hypotheses that are aimed to shed light on this mechanism by studying its generalizability to multiple stimuli and cues, as well as the long-term durability of the effect.
In the CAT, participants initially indicated their preferences for a set of snack-food items by specifying their willingness to pay for each item in an auction procedure. Then, in the cue-approach training, some of the items were consistently associated with a neutral auditory cue and a speeded button press response (these stimuli were termed ‘Go items’), whereas other stimuli were presented without a cue (‘No-Go items’). In the following probe phase, participants were asked to choose a snack they would like to eat at the end of the experiment. Each probe-choice comprised of a pair of items with similar initial values, in which one of the two snacks was a Go item. Results showed that the mere association of snack-food images with a neutral auditory cue and a speeded button press, resulted in enhanced preferences for Go items over No-Go items. This preference change effect varied across different value categories – resulting in enhanced preferences for snack-food items of initial high-value, yet significantly less prominent change in preferences for low-value items. The effect was maintained two-months following training11.
Additional studies with CAT12 found that for the behavioral change to take place, cue-approach
4
second to respond. In addition, when training included only button press responses with no cues, enhanced preferences for Go items were not observed12. It was also found that the CAT effect
induces preference changes beyond the hand motor circuit itself, relying on a study that trained participants with the button press, whereas choices during probe were made using the eye gaze12.
Veling et al.13 extended the range of consumable items for non-reinforced change to fruits and
vegetables, and also found that the effect requires a time-restricted response. Finally, it was also
shown that using CAT, it is possible to increase the odds of participants choosing low-value snack-food items over high-value items, in comparison to a baseline rate of choices between two non-cued items14.
Based on these findings, summarizing over 15 samples, the CAT has been established as a replicable paradigm to induce preference changes for consumable food items, without external reinforcement. The underlying mechanism of this preference change has not yet been fully elucidated. Neural findings showed a neural signature indicative of value change for the Go items in the ventromedial prefrontal cortex during choices11. Further imaging classification studies were
not able to clearly define its underlying basic cognitive constructs, but did show the involvement of frontal control networks following training15. Currently it is suggested that the underlying
mechanism relies on attention11,12,15, inspired by its conceptual resemblance to the attentional boost
effect16, where memory for task-irrelevant stimuli was enhanced when stimuli co-appeared with
5
the underlying mechanism, as well as the boundary conditions of the CAT as a general mechanism for long term non-externally reinforced change.
Our first research aim was to test whether CAT can enhance preferences for non-consumable items. To this end, we performed CAT with a variety of stimuli. First, we tested the efficacy of CAT in changing preferences for face images (Experiment 1), which are important social stimuli and known to elicit preferences17,18. Second, we tested if CAT could be used to
change preferences for more abstract stimuli, such as fractal art images (Experiment 2), which participants are unaccustomed to and are also more difficult to associate with semantic knowledge. Third, we continued to examine the importance of the stimuli’s affective valence. Research with external reinforcement procedures19–21 indicated an important interplay between the stimulus
affective valence (aversive versus appetitive) and the required response (approach versus avoidance) – showing better association of approach responses to appetitive stimuli, and avoidance responses to aversive stimuli. To examine the importance of the stimuli’s valence, we performed two experiments using affective images from the International Affective Picture System22 (IAPS):
one experiment was performed with positive IAPS stimuli (Experiment 3), and a second with negative IAPS stimuli (Experiment 4).
After examining the importance of different stimuli features (i.e., consumability, abstractness and affective valence), we sought to examine the importance of the cues’ nature. Previous studies suggested that cues of different modalities may alter performance in different tasks23,24. Since all of the previous experiments with the CAT11–15 were conducted with a neutral
6
21 of the cue by associating appetitive snack-food items with an aversive tone cue. Here we did not
have a clear hypothesis if the aversive cue combined with the appetitive stimuli will lead to enhanced preferences, as we put to the test two competing hypotheses – on the one hand, CAT with neutral cue resulted in enhanced preferences for the associated items, and therefore if the valence of the cue is not a cardinal feature, we would expect enhanced preferences also with an aversive cue. On the other hand, the cue’s valence may be a fundamental factor, as association of stimuli with an aversive cue may result in reduced preferences via classical conditioning25.
To adhere to principles of replicability26–28 in Experiments 7-10 we performed improved
replications of our novel findings with non-consumable items from Experiments 1-4. In all of the replications, we used a more extensive training protocol with both an auditory cue (Experiments 7-8) and a visual cue (Experiments 9-10). In Experiment 7 we replicated Experiment 1 with a new set of faces adapted from a more recent, better quality dataset. This was done following reports by participants that the stimuli used in Experiment 1 were outdated and not visually appealing. In Experiment 8 we replicated Experiment 2 with fractals. Finally, in Experiments 9-10 we replicated Experiments 3-4 with the positive and negative affective IAPS stimuli, with a visual cue during training. Replicating the results with a visual cue was important to ensure participants in the negative IAPS condition did not avert their gaze from the unpleasant images during training.
7
long period of time could point to its underlying mechanism that putatively effects the low-level representation of the items29, as well as potential applicability in inducing long-term change.
Based on previous findings11–15, we hypothesized that CAT would result in increased
preferences for Go items (i.e. items that were previously associated with a cue and a response) over No-Go items with similar initial preferences. We also predicted that this behavioral change would be more robust for high-value items (items for which a participant had a higher pre-existing preference) than for low-value items, as reported in most studies with CAT11,12,15, though not all
of them13.
Methods
Participants
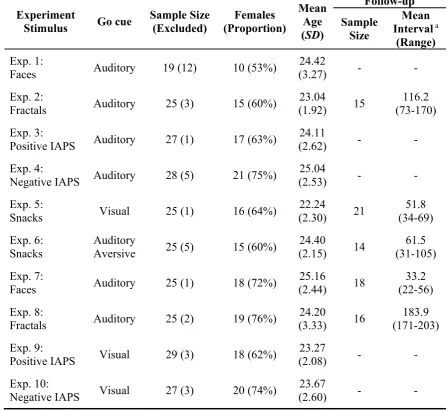
A total of 255 healthy participants participated in one of 10 independent experiments. In five experiments (Experiments 2 and 5-8), 84 participants agreed to return for an additional follow-up session (average of 67% retention rate of the first samples), one to six-months following their original participation date (for a demographic description of each experimental sample see Table 1). All participants had normal or corrected to normal vision and hearing, and gave their informed consent to participate in the experiments in return for monetary compensation or in return for course credit (course credit was granted to some of the participants in Experiments 3-4 and 9-10). The study was approved by the ethics committee of Tel Aviv University (Experiments 1-2 and 5-8) and by the ethics committee of the Hebrew University of Jerusalem (Experiments 3-4, and 9-10).
8
chance. Data were obtained from previous experiments with the CAT11 and Experiment 1 (power
analysis was conducted using R’s pwr package30, and is available online at osf.io/h36vr). Final
sample sizes ranged from 25-29; Data from participants beyond n=25 were collected in order to guarantee the minimal n=25 in case of exclusion following primary quality assurance of the data. All reported effects remain consistent when the participants beyond n=25 were removed.
Table 1 Demographics
Experiment
Stimulus Go cue
Sample Size (Excluded) Females (Proportion) Mean Age (SD)
Follow-up
Sample Size
Mean Interval a
(Range)
Exp. 1:
Faces Auditory 19 (12) 10 (53%)
24.42
(3.27) - -
Exp. 2:
Fractals Auditory 25 (3) 15 (60%)
23.04
(1.92) 15
116.2 (73-170) Exp. 3:
Positive IAPS Auditory 27 (1) 17 (63%)
24.11
(2.62) - -
Exp. 4:
Negative IAPS Auditory 28 (5) 21 (75%)
25.04
(2.53) - -
Exp. 5:
Snacks Visual 25 (1) 16 (64%)
22.24
(2.30) 21
51.8 (34-69) Exp. 6:
Snacks
Auditory
Aversive 25 (5) 15 (60%)
24.40
(2.15) 14
61.5 (31-105) Exp. 7:
Faces Auditory 25 (1) 18 (72%)
25.16
(2.44) 18
33.2 (22-56) Exp. 8:
Fractals Auditory 25 (2) 19 (76%)
24.20
(3.33) 16
183.9 (171-203) Exp. 9:
Positive IAPS Visual 29 (3) 18 (62%)
23.27
(2.08) - -
Exp. 10:
Negative IAPS Visual 27 (3) 20 (74%)
23.67
(2.60) - -
9
In addition to the reported 255 participants, across the 10 experiments 31 additional participants were excluded from final analyses (see Table 1 and Supplementary Table 1). Twenty-one participants were disqualified due to poor performance in training, an exclusion criteria adopted from previous CAT studies11,12; six participants due to technical problems with the
apparatus running the experiment; two participants requested to quit; one participant entirely avoided choices of low-value snacks during the probe phase and one participant due to extreme intransitivity in initial preferences (transitivity score from initial preferences evaluation of 3.67 SD below the group mean).
Materials
Stimuli. Six different stimuli sets were used, each containing 60 identically-sized color images of either unfamiliar faces31,32 (two different datasets were used in Experiment 1 and
Experiment 7), fractal art33 (Experiments 2 and 8), images from the International Affective Picture
System (IAPS)22 of positive valence (Experiments 3 and 9) or negative valence (Experiments 4
and 10) and popular Israeli snack-food items34 (dataset created in our laboratory for Experiments
5 and 6).
For Experiment 1 we used face images adapted from a functional MRI face localizer task31.
The face stimuli included images of 30 male and 30 female front-facing individuals on a white background, sized 280 × 296 pixels. In Experiment 7, we performed an improved replication of the face experiment using a newer dataset32 with better quality face images. Stimuli included 30 male
10
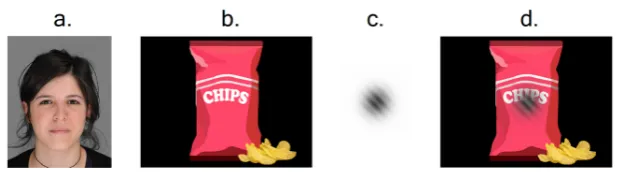
centered and aligned according to the location of the pupils (see example in Figure 1a). Computer-generated fractal art stimuli33 used in Experiments 2 and 8 included 60 identical sized (576 × 432
pixels) color images.
For Experiments 3-4 and 9-10 with IAPS stimuli, images were selected based on the norms published by Lang et al.22. For the positive IAPS experiments (Experiments 3 and 9) we used
affective images, which were rated as inducing positive affect (valence M = 7.10 on a 1 to 9 scale, SD = 0.43; arousal M = 5.16 on a 1 to 9 scale, SD = 0.46). For the negative IAPS experiments
(Experiments 4 and 10) we used images rated as inducing negative affect (valence M = 2.87, SD = 0.55; arousal M = 5.50, SD = 0.78). Arousal ratings were similar in both datasets. In experiments with negative affective stimuli we also used three additional stimuli not from the official IAPS dataset, which were found to induce negative affect in another independent study35. All IAPS
stimuli were rescaled to identical size (533 × 400 pixels).
For Experiments 5 and 6, conducted with familiar snack-food items, we prepared a new stimuli dataset of local familiar snacks34. Snack-food images were of identical size (576 × 432
pixels) and presented on homogenous black background.
11
CAT studies11; in Experiments 5, and 9-10, we used a visual cue of a 180-ms semi-transparent
Gabor (see example in Figure 1c-d); in Experiment 6 we used an aversive 300-ms auditory cue created with a cotangent function (provided as Supplementary Code).
Stimuli presentation. Stimuli were presented using MATLAB (Mathworks, Inc. Natick, MA, USA), Psychtoolbox36 and Python-based Pygame37 packages, on 21.5 inch iMac or PC with
a 21 inch screen. In order to induce the aversive cue in Experiment 6, the sound wasplayed in a controlled high volume, using Plantronics BackBeat Pro noise-canceling headphones.
Procedure
Baseline evaluation of subjective preferences. Participants’ baseline subjective preferences for each of the stimuli in a given experiment were evaluated individually using two methods: an auction procedure in experiments with consumable snack-food items (Experiments 5 and 6), and a forced-choice binary ranking procedure for non-consumable items (Experiments 1-4 and 7-10). Based on these valuations, stimuli were rank-ordered individually for each participant, from the most liked item (rank 1) to the least liked item (rank 60).
Auction procedure for snack-food items. In experiments with snack-food items
(Experiments 5 and 6), participants underwent an auction task based on the Becker DeGroot Marschak (BDM)38 auction procedure, to obtain participants’ willingness to pay, similarly to
previous CAT studies11–15. Prior to their participation in the experiment, subjects were asked to
12
Participants were informed in advance, that at the end of the experiment one trial will be chosen at random to be played out for real purchase from the experimenter. The computer randomly generated a counter bid, ranging from 0-10 with 0.5 increments. In case the participant’s bid was higher than the computer’s, he or she had won the bid and were required to buy the item in return for the computer bid price; otherwise, the participant could not purchase the item, but was left with the money designated for the auction at the beginning of the experiment.
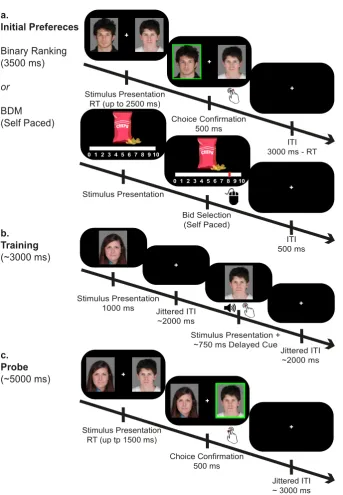
Binary ranking for non-consumables items. In experiments with non-consumable stimuli (i.e. faces, fractals and IAPS; Experiments 1-4 and 7-10), we used a forced-choice binary ranking procedure. In this task, 60 stimuli were randomly paired with each other to form 300 unique pairs. For each pair of stimuli, participants had 2500-ms to choose their preferred stimulus, followed by a 500-ms choice confirmation and 500-ms fixation cross (see Figure 2a). In order to maintain balanced exposure, each stimulus was presented in exactly 10 pairs during the binary ranking phase.
Choices were then quantified into ranking scores. Based on the assumption of choice transitivity from the Rational Choice Theory39, we used the outcomes from the set of binary
choices in order to deduce individual preferences for the presented set of stimuli. That is, if stimulus A is preferred over B and stimulus B is preferred over C, then their respective ranks follows A≻B≻C. In order to maximize ranking validity and specificity we used the Colley Matrix algorithm40, designed to solve ranking problems with a relatively small number of binary
13
Figure 2. An example of the experimental procedure outline using face stimuli. Mean trial duration written in parenthesis, tilde sign indicates varying duration. 2a. Initial preferences evaluation using either a binary ranking procedure (for non-consumable stimuli) or an auction procedure (for snack-food items, in Experiments 5-6). 2b. In the training phase, Go items were consistently paired with a cue and a speeded button press. 2c. In the probe phase participants chose their preferred stimulus between pairs of items with similar initial value, where only one was a Go item, previously associated with a cue during training.
$3
Stimulus Presentation RT (up tp 1500 ms)
Choice Confirmation 500 ms
Jittered ITI ~ 3000 ms
a. Initial Prefereces Binary Ranking (3500 ms) or BDM (Self Paced) Stimulus Presentation RT (up to 2500 ms)
Choice Confirmation 500 ms
ITI 3000 ms - RT
Stimulus Presentation + ~750 ms Delayed Cue Jittered ITI ~2000 ms Stimulus Presentation 1000 ms Jittered ITI ~2000 ms b. Training (~3000 ms) c. Probe (~5000 ms) Stimulus Presentation Bid Selection (Self Paced) ITI 500 ms
0 1 2 3 4 5 6 7 8 9 10
14
Colley Matrix ranking scores typically range in scores from 0 (least liked) to 1 (most liked), with a fixed mean of 0.5. An intransitive choice pattern is characterized by densely distributed scores around the center of 0.5, while a distinct preferences pattern leads to more distributed ranking scores. From these rankings, we quantified a transitivity score for each participant as the standard deviation of the participant’s ranking scores. Participants who demonstrated extreme intransitive choice patterns (3 SD below the group mean), were excluded from final analyses.
Cue-approach training. Following the baseline evaluation of subjective preferences, participants underwent a 40-minutes long cue-approach training procedure, during which a consistent association was formed between some of the stimuli and a Go cue (see Figure 2b). Each stimulus in the training set was presented individually on the screen for 1000-ms, once during each training run. Stimuli were randomly ordered and followed by a jittered fixation cross with an average duration of 2000-ms (SD = 1243-ms; range of 1000 - 6000-ms, 1000-ms intervals).
We used two formats of training designs, both were 40-mintues long, but the number of training runs (i.e. total number of presentations of each stimulus) was different, as well as the number of cued Go items. In the first, shorter-training design, used in Experiments 1-4 the training set consisted of all 60 stimuli (as in the original CAT study11), presented in 12 training runs. In the
second, more extensive training design, used in Experiments 5-10, the number of training runs was increased to 20 and the duration of each run was reduced by presenting only a subset of 40 stimuli, consisting of 20 high-value (ranked 3-22, above the median rank) and 20 low-value items (ranked 39-58).
15
Participants were instructed to respond to the Go cue by pressing a keyboard button as fast as possible, before stimulus offset. Participants were not informed in advance that the association of stimuli with the cue would be consistent or which items would be Go items.
Items were assigned to be associated with the Go cue based on the previous baseline preferences evaluation task. Two sets of high-value stimuli with identical mean ranks and two sets of low-value stimuli with identical mean ranks were predetermined (see Supplementary Figure 1). For each participant, one high-value set and one low-value set were chosen to be consistently associated with the cue (Go items), whereas all other stimuli appeared without a cue (No-Go items). The cue appeared following a delay of ~750-ms from stimulus onset. To maintain a balanced difficulty level throughout the training phase, the delay was modified according to participants’ performances, as conducted in previous CAT studies11.
Probe. Preference change following CAT was evaluated in a probe phase. On each probe trial, two items appeared to the right and left of a central fixation cross and participants were asked to select their preferred stimulus. In each pair, both items were of similar initial value (either high-value or low-high-value), but only one item was a Go item, associated with a cue during training. For each pair, participants had 1500-ms to select their preferred stimulus, followed by a 500-ms choice confirmation and a fixation cross for a jittered duration with an average of 3000-ms (range of 1000-11000-ms, 1000-ms intervals; see Figure 2c).
16
CAT11–15 only included 4x4 unique comparisons per value category, in Experiments 1-4 of the
current work we modified the design of the training and probe parts to include 8X8 Go items, in an attempt to increase the number of unique probe choices. Following experiments 1-4, we hypothesized that a value category of 16 items was too wide, as within each value-category, participants were more likely to choose the relatively higher valued items. Therefore, in the later designs (used in Experiments 5-10) the number of Go items in each value-category was reduced to 6, in order to maintain smaller gaps in initial preferences between all items in the same value category.
In addition to these comparisons, as in previous CAT experiments11–15, ‘sanity check’ trials
were also incorporated in the probe phase. In the ‘sanity check’ trials, participants were asked to choose between pairs of items in which one item was of initial high-value and the other of initial low-value (both Go or both No-Go items), in order to reassure the validity of the initial preference evaluation procedure. The probe phase included two runs. On each run, all unique probe pairs were presented in a random order.
In Experiments 5-6, conducted with snack-food items, choices were made for actual food consumption. To ensure incentive-compatible choices, participants were informed in advance that one trial would be selected at random, and that they would receive the item selected on that trial at the end of the experiment.
Memory. At the end of the experiment, participants performed an Old/New and Go/No-Go recognition tasks. The results of these tasks are not reported here as they are beyond the scope of this paper.
17
completed only the probe and memory tasks again. For each participant, the follow-up tasks included the same stimuli and probe pairs he or she had previously performed during the original session, presented in a random order. All participants were notified in advance and encouraged to return to the follow-up sessions.
Results
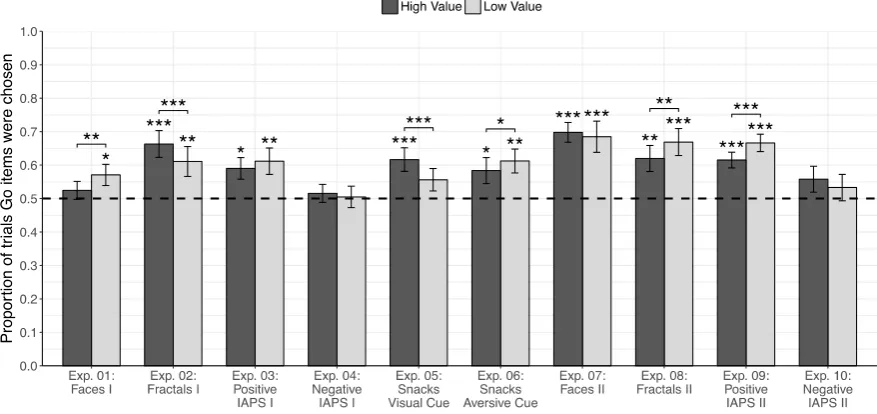
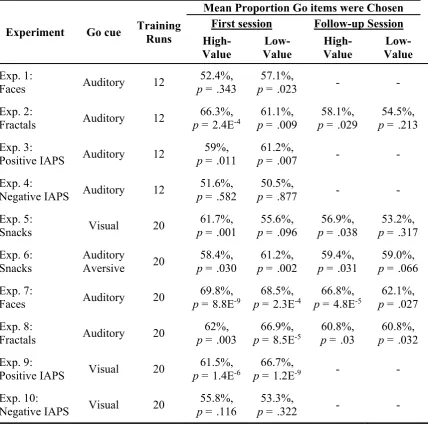
To assess preference changes following training, we analyzed the proportion of probe phase trials in which participants preferred the Go items over the No-Go items, using a two-tailed repeated measures logistic regression. In each pair, both items were of similar initial preference based on the baseline evaluation phase. We hypothesized that the cue approach effect would enhance preferences for the Go items above the chance level of 50% of trials (log-odds = 0; odds-ratio = 1). For each logistic regression analysis, the estimated odds odds-ratios (OR) are reported as the corresponding effect sizes along with 95% confidence intervals (CI). Analyses were conducted separately for pairs of high-value items and pairs of low-value items, similar to previous CAT studies11–15. The results of all experiments are summarized in Table 2, and Figures 3-4. Analyses
and visualizations were conducted using lme441 and ggplot242 R packages, and are available online
along with the experimental data at osf.io/puxhx.
Experiments 1-4: Changing Preferences for Non-Consumable Items - Faces, Fractals and
Affective Stimuli
18
In Experiment 1, Cue approach training with unfamiliar faces resulted in no significant preferences for high-value Go items over high-value No-Go items (mean proportion = 52.4%, OR = 1.11, 95% CI [0.89, 1.38], p = .343); and a small preference of value Go items over low-value No-Go items (mean proportion = 57.1%, OR = 1.39, 95% CI [1.05, 1.84], p = .023; see Figure 3 and Table 2). A significant difference was found between high and low value probe choices with a greater effect for the low-value items (OR = 0.82, 95% CI [0.73, 0.93], p = 0.001).
Figure 3. Probe results of Experiments 1-10.
19
One of the important differences of this Experiment 1 from previous CAT studies11,12 with
appetitive snack-food stimuli was the increase in the range of each value category to 16 items (eight Go and eight No-Go items), in an attempt to increase the number of possible comparisons obtain better measurements. This increase came with a known cost of introducing choices between
Table 2
Probe Results - Mean Proportion of Trials Participants Chose Go Items Over No-Go Items
Experiment Go cue Training Runs
Mean Proportion Go items were Chosen First session Follow-up Session High-Value Low-Value High-Value Low-Value Exp. 1:
Faces Auditory 12
52.4%, p = .343
57.1%,
p = .023 - -
Exp. 2:
Fractals Auditory 12
66.3%,
p = 2.4E-4 p = .009 61.1%, p = .029 58.1%, p = .213 54.5%,
Exp. 3:
Positive IAPS Auditory 12
59%, p = .011
61.2%,
p = .007 - -
Exp. 4:
Negative IAPS Auditory 12
51.6%, p = .582
50.5%,
p = .877 - -
Exp. 5:
Snacks Visual 20
61.7%, p = .001
55.6%, p = .096
56.9%, p = .038
53.2%, p = .317
Exp. 6: Snacks
Auditory
Aversive 20
58.4%, p = .030
61.2%, p = .002
59.4%, p = .031
59.0%, p = .066
Exp. 7:
Faces Auditory 20
69.8%,
p = 8.8E-9 p = 2.3E68.5%, -4 p = 4.8E66.8%, -5 p = .027 62.1%,
Exp. 8:
Fractals Auditory 20
62%, p = .003
66.9%,
p = 8.5E-5 p = .03 60.8%, p = .032 60.8%,
Exp. 9:
Positive IAPS Visual 20
61.5%,
p = 1.4E-6 p = 1.2E66.7%, -9 - -
Exp. 10:
Negative IAPS Visual 20
55.8%, p = .116
53.3%,
p = .322 - -
20
pairs of less homogenous initial values. As this experiment was different in design, we additionally performed an analysis to examine the results using only the most extreme stimuli in each category, i.e. the highest four Go and four No-Go stimuli in the high-value category, and the lowest four Go and four No-Go stimuli in the low-value category. These analyses are equivalent to probe-choices in previous studies11–13. Examining the extreme choices revealed enhanced preferences for the
highest Go items over the highest No-Go items (mean proportion = 57.9%, OR = 1.41, 95% CI [1.04, 1.92], p = .026), and a similar trend for low-value choices (mean proportion = 57.9%, OR = 1.44, 95% CI [0.97, 2.17], p = .073).
The results of Experiments 2-4 were also analyzed separately for the highest and lowest probe-choices as has been done in previous studies11–13. In these experiments, the additional
analyses of the more extreme comparisons showed consistent results with the main analyses for the entire value category. Therefore, for these samples we do not report the additional analysis and they are available online (osf.io/h36vr), along with the data and all other analyses.
In Experiment 2, following cue-approach training with fractal art stimuli, participants consistently preferred the high-value Go items over the high-value No-Go items during probe phase (mean proportion = 66.3%, OR = 2.56, 95% CI [1.55, 4.22], p = 2.4E-4); similarly,
participants consistently preferred the low-value Go items over the low-value No-Go items (mean proportion = 61.1%, OR = 1.92, 95% CI [1.18, 3.14], p = .009). CAT effect on preferences was significantly stronger for high-value probe choices over low-value probe choices (OR = 1.31, 95% CI [1.17, 1.46], p = 2.2E-6).
21
CI [1.22, 3.46], p = .007). Differences between high and low value probe choices were trending towards more robust effects for low-value items (OR = -0.1, 95% CI [-0.20, 0.01], p = 0.067).
In Experiment 4, conducted with negative IAPS stimuli, participants displayed no preferences for the Go items, neither for the high-value pairs (mean proportion = 51.6%, OR = 1.07, 95% CI [0.85, 1.34], p = .582); nor the low-value pairs (mean proportion = 50.5%, OR = 1.02, 95% CI [0.77, 1.36], p = .877). No significant difference between high and low value probe choices was found (OR = 1.05, 95% CI [0.95, 1.16], p = 0.316).
Experiments 5-6: Using Cues of Different Modality and Valence
After examining CAT with different stimuli, we went on to examine whether using an auditory cue was a requirement to induce CAT preference change. Therefore, in Experiment 5, we used a semi-transparent Gabor on top of snack-food items (See Figure 1c and 1d). In Experiment 6, following the results of Experiment 4 showing that CAT did not alter preferences for negative stimuli, we tested the importance of cue neutrality, whether the CAT could enhance preferences for appetitive snacks, even when cued with an aversive tone. In both Experiments 5 and 6, we used familiar local snack-food items, similar to those used in previous CAT studies11–15.
In Experiment 5, following training with a neutral visual cue, participants preferred the high-value Go items over the No-Go items (mean proportion = 61.7%, OR = 1.73, 95% CI [1.25, 2.38], p = 8.9E-4). A weaker trend of enhanced preferences was found for low-value Go items
(mean proportion = 55.6%, OR = 1.30, 95% CI [0.95, 1.77], p = .096). As in previous studies using snack-food stimuli11,12,15, training with a visual cue resulted in a more robust preference
22
Using an aversive auditory cue in Experiment 6 resulted in a significant (yet not as strong) enhanced preference for high-value Go items (mean proportion = 58.4%, OR = 1.46, 95% CI [1.04, 2.07], p = .030) and a significant enhanced preference for low-value Go items (mean proportion = 61.2%, OR = 1.68, 95% CI [1.21, 2.32], p = .002), with a more robust preference change for low-value items compared with high-low-value items (OR = 0.85, 95% CI [0.73, 098], p = .022).
Experiments 7-10: Reproducibility of Findings
After showing CAT can be used to modify preferences for various non-consumable stimuli, to support the reproducibility of our findings, we aimed to replicate our results in four additional independent samples with improved designs.
In Experiment 7 we performed an additional CAT experiment with face stimuli, obtained from a more contemporary dataset32, than the stimuli used in Experiment 1. Cue approach training
with unfamiliar faces resulted in enhanced preferences for high-value Go items over high-value No-Go items (mean proportion = 69.8%, OR = 2.57, 95% CI [1.86, 3.55], p = 8.8E-9); as well as
low-value Go items over low-value No-Go items (mean proportion = 68.5%, OR = 2.98, 95% CI [1.67, 5.32], p = 2.3E-4). No differences were found between preferences of Go items between
high-value and low-value probe choices (OR = 1.08, 95% CI [0.92, 1.25], p = .345).
In Experiment 8, CAT training with fractal art images replicated the results of Experiment 2. Participants preferred the high-value Go items over No-Go items (mean proportion = 62.0%, OR = 1.87, 95% CI [1.23, 2.83], p = .003); as well as the low-value Go items over the low-value No-Go items (mean proportion = 66.9%, OR = 2.52, 95% CI [1.59, 4.00], p = 8.5E-9). The
23
In Experiments 9, the association of positive IAPS stimuli with a neutral visual cue resulted in enhanced preferences for Go items, both in the high-value items (mean proportion = 61.6%, log-odds = 1.64, 95% CI [1.35, 2.02], p = 1.4E-6) and in the low-value probe choices (mean
proportion = 66.7%, log-odds = 2.10, 95% CI [1.65, 2.67], p = 1.2E-9). Differences between high
and low value probe choices were more robust for low-value items (OR = 0.79, 95% CI [0.70, 0.90], p = 5.3E-4).
In Experiments 10, conducted with negative IAPS stimuli and a visual cue, results did not show enhanced preferences for Go items, neither in the high-value pairs (mean proportion = 55.8%, OR = 1.35, 95% CI [0.93, 1.96], p = .116), nor in the low-value pairs (mean proportion = 53.3%, OR = 1.20, 95% CI [0.84, 1.71], p = .322). No significant differences between high and low value probe choices were found (OR = 1.12, 95% CI [0.98, 1.28], p = 0.104).
Long Term Maintenance
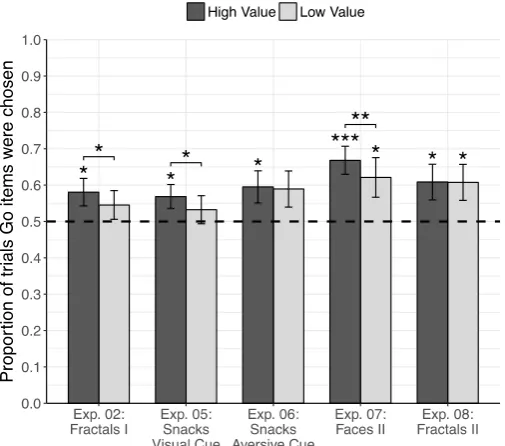
In order to evaluate long-term durability of the CAT effect on preferences, all participants from Experiments 2 and 5-8 were encouraged to return for an additional follow-up session, performed one to six months following training (see Table 1 for retention rates). The results of the follow up experiments are listed by the increasing duration of the follow up interval from one to six months.
In a one-month (mean interval 33.2 days) follow-up of Experiment 7 with face stimuli, enhanced preferences for Go items were maintained both in the high-value (mean proportion = 66.8%, OR = 2.23, 95% CI [1.51, 3.27], p = 4.8E-5) and the low-value probe choices (mean
24
In Experiment 5 with snacks and visual cue, results of the follow-up session conducted approximately two months after the initial training (mean interval 51.8 days), showed that enhanced preferences for the high-value Go items persisted (mean proportion = 56.9%, OR = 1.34, 95% CI [1.02, 1.78], p = .038), while preferences for low-value Go items remained at chance level (mean proportion = 53.2%, OR = 1.19, 95% CI [0.85, 1.65], p = .317), as in the immediate probe session. The more robust preference for high-value snack-food items found in the first session, were also sustained in the follow-up session (OR = 1.16, 95% CI [1.00, 1.35], p = .049).
In Experiment 6 conducted with snack-food stimuli and the aversive auditory cue, following a mean period of two months from training (mean interval 61.5 days), preferences for Go items were maintained in high-value probe choices (mean proportion = 59.4%, OR = 1.52, 95% CI [1.04, 2.24], p = .031); while in the low-value probe choices, we observed only a trend of enhanced preferences for Go items (mean proportion = 59.0%, OR = 1.53, 95% CI [0.97, 2.42], p = .066), with no difference between high-value and low-value probe choices (OR = 1.02, 95% CI
[0.85, 1.23], p = .780).
In a four-month (mean interval 116.2 days) follow-up session of Experiment 2 with fractal art stimuli, enhanced preferences were maintained for the high-value Go items (mean proportion = 58.1%, OR = 1.44, 95% CI [1.04, 1.99], p = .029), but not for the low-value Go items (mean proportion = 54.5%, OR = 1.23, 95% CI [0.89, 1.71], p = .210). Results were more robust for high-value probe choices than low-high-value probe choices (OR = 1.16, 95% CI [1.02, 1.32], p = 0.026).
25
2.50], p = .032). No difference was found between high and low value probe choices (OR = 1.01, 95% CI [0.85, 1.20], p = .917).
Discussion
The current research studies the mechanism and boundary conditions of the novel non-externally reinforced cue-approach task. In 10 independent samples with 255 participants, we showed that cue-approach training can be used to enhance preferences for non-consumable stimuli including faces, fractal art images and positive affective stimuli. We showed that a visual cue can be used to induce the effect as well as an aversive tone with appetitive snack-food items. As a boundary condition we found, in two independent samples, that preferences towards negative
Figure 4. Probe results of follow up sessions.
26
affective stimuli could not be changed. In a series of five follow up sessions, performed one to six months following training, we found that the single 40-minutes training session led to a long-lasting preference change. These findings shed light on the mechanism as well as boundaries of this non-reinforced behavior change paradigm.
In this study, we found that CAT was effective in increasing preferences for unfamiliar faces, fractals and positive emotional IAPS images. In the first faces experiment (Experiment 1) we found an inconclusive trend of preference change for stimuli of lower quality and presumably a too-wide value range; therefore, in an improved replication (Experiment 7) we changed the stimuli and narrowed the value category. This induced a stronger and more consistent preference change. The ability to change preferences for abstract stimuli, such as fractals (Experiments 2 and 8), exemplifies the generalizability of the non-reinforced behavioral change mechanism underlying CAT, which goes beyond stimuli of consumable, familiar and even tangible nature.
27
association with rewards, while no-go responses were better learned by association with punishments19–21. Future studies could test this hypothesis using a non-reinforced paradigm that
would require a no-go response, in order to modify preferences for negative affective stimuli. Using familiar local snack-food items with a neutral visual cue and an auditory aversive cue (Experiments 5-6), we found that the CAT effect is not limited to a specific cue modality. In Experiment 5, we showed that using a visual cue rather than the original neutral tone led to similar results as in previous CAT studies with local snacks11,12. These results suggest that modifying the
modality of the cue from auditory to visual does not impair the behavioral change effect. Interestingly, an association with an aversive auditory cue (Experiment 6), which could have been expected to decrease preferences for associated items via classical conditioning25, resulted in
enhanced preferences for both high and low value Go items. Using an aversive cue resulted in a significantly stronger preference modification for the less liked low-value snack-food items. This was surprising given that in other CAT experiments conducted with snack-food items there was no change or a weaker change for low-value food items11,12. This might suggest an important
interaction between stimuli and cue, as a less-positive Go cue may be more effective in modifying preferences for less-favorable stimuli. Future research could directly test the effect of high versus low valued stimuli using additional aversive cues, such as unpleasant tactile or electric stimulation. In previous studies conducted with snack-food items11,12, preference change was shown to
28
preferences for familiar snack-food items. Our results imply that the mechanisms underlying CAT may be used to modify preferences for the entire neutral and positive value range of unfamiliar stimuli, for which participants had no previous experience. Our null results with the negative affective stimuli experiments, may resemble the differential effect for high-value versus low-value snack-food items, as in both cases training the less positive stimulus did not induce an enhancement of preferences. These findings hedge the boundaries of the learning mechanism underlying the CAT, suggesting it may be specific to neutral and positive rather than negative stimuli, even when using an aversive cue. The consistent finding that the task could not modify preferences for less liked snack-food items in previous studies, as with the two experiments using negative affective stimuli, also serves as evidence against a concern that the experimental results may stem from participants trying to affirm the researchers’ aim due to demand characteristics43. Taken together,
the lack of ability to change preferences for lower value items suggests a potential thresholding mechanism, such that CAT can only affect items above a certain initial preference level44.
In five of the experiments, we included a follow-up session, one to six months after training. In all cases, the behavioral change effect persisted over time. These results point to the high durability of behavioral change induced without external reinforcement or context changes. A relatively short 40 minutes training session successfully affected preferences, which then persisted over long periods of time, up to six months after training, with no maintenance procedures between these time points. This putatively suggests that the training induces a change in low-level brain areas29 that lingers for several months. Thus, this non-reinforced mechanism
29
The work presented here serves as a foundation for studies examining the real-world applications of the CAT. Applicable implementation of the CAT can be used to enhance desired behaviors over less desired ones, not necessarily limited to food consumption. In the clinical field, several psychological disorders such as depression and anxiety are characterized by a cognitive bias towards negative affective social stimuli45,46. Attentional bias modification treatments for
these disorders have been tested in an attempt to improve clinical symptoms47,48. Similarly, the
general mechanism underlying CAT may be used to induce a counter-bias and enhance preferences for positive affective stimuli. Such preference modification may, in turn, lead to congruent changes in positive mood with beneficial long term therapeutic effects.
30
References
1. Butler, A. C., Chapman, J. E., Forman, E. M. & Beck, A. T. The empirical status of cognitive-behavioral therapy: A review of meta-analyses. Clin. Psychol. Rev. 26, 17–31 (2006).
2. Higgins, S. T. et al. Outpatient behavioral treatment for cocaine dependence: One-year outcome. Exp. Clin. Psychopharmacol. 3, 205–212 (1995).
3. Lang, W., Wing, R. R., Venditti, E., Jakicic, J. M. & Polley, B. A. Lifestyle Intervention in Overweight Individuals With a Family History of Diabetes. Diabetes Care 21, 350–259 (1998).
4. Bjork, R. A. Recency and Recovery in Human Memory. Nat. Rememb. Essays Honor Robert G. Crowder. Sci. Conf. Ser. 211–232 (2001). doi:10.1037/10394-011
5. Bouton, M. E. Context, time, and memory retrieval in the interference paradigms of Pavlovian learning. Psychol. Bull. 114, 80–99 (1993).
6. Cahill, K. & Perera, R. Competitions and incentives for smoking cessation. Cochrane Database of Systematic Reviews. Issue 4. Art. No.: CD004307 (2011). doi:10.1002/14651858.CD004307.pub4.Copyright
7. Wood, W. & Neal, D. T. A new look at habits and the habit-goal interface. Psychol. Rev.
114, 843–863 (2007).
8. De Martino, B., Kumaran, D., Seymour, B. & Dolan, R. J. Frames, Biases, and Rational Decision Making in the Human Brain. Science (80-. ). 313, 684–687 (2006).
9. Slovic, P. The construction of preference. Am. Psychol. 50, 364–371 (1995).
10. Tversky, A. & Kahneman, D. Rational Choice and the Framing of Decisions. J. Bus. 59,
251–278 (1986).
11. Schonberg, T. et al. Changing value through cued approach: an automatic mechanism of behavior change. Nat. Neurosci. 17, 625–30 (2014).
12. Bakkour, A. et al. Mechanisms of choice behavior shift using cue-approach training. Front. Psychol. 7, 1–12 (2016).
13. Veling, H. et al. Training Impulsive Choices for Healthy and Sustainable Food. J. Exp. Psychol. Appl. 23, 204–215 (2017).
31 doi:10.1016/j.appet.2017.06.010
15. Bakkour, A., Lewis-peacock, J. A., Poldrack, R. A. & Schonberg, T. Neural mechanisms of cue-approach training. Neuroimage 151, 92–104 (2017).
16. Swallow, K. M. & Jiang, Y. V. The Attentional Boost Effect: Transient increases in attention to one task enhance performance in a second task. Cognition 115, 118–132 (2010). 17. Aharon, I. et al. Beautiful faces have variable reward value: fMRI and behavioral evidence.
Neuron 32, 537–551 (2001).
18. Kranz, F. & Ishai, A. Face perception is modulated by sexual preference. Curr. Biol. 16,
63–68 (2006).
19. Guitart-Masip, M. et al. Action dominates valence in anticipatory representations in the human striatum and dopaminergic midbrain. J. Neurosci. 31, 7867–7875 (2011).
20. Guitart-Masip, M. et al. NeuroImage Go and no-go learning in reward and punishment : Interactions between affect and effect. Neuroimage 62, 154–166 (2012).
21. Chiu, Y., Cools, R. & Aron, A. R. Opposing Effects of Appetitive and Aversive Cues on Go / No-go Behavior and Motor Excitability. J. Cogn. Neurosci. 26, 1851–1860 (2014). 22. Lang, P. J., Bradley, M. M. & Cuthbert, B. N. International affective picture system (IAPS):
Affective ratings of pictures and instruction manual. Technical Report A-8 (2008).
23. Ng, A. W. Y. & Chan, A. H. S. Finger Response Times to Visual, Auditory and Tactile Modality Stimuli. Proc. Int. MultiConference Eng. Comput. Sci. II, 1449–1454 (2012). 24. Stein, B., London, N., Wilkinson, L. & Price, D. Enhancement of Perceived Visual Intensity
by Auditory Stimuli: A Psychophysical Analysis. J. Cogn. Neurosci. 8, 497–506 (1996). 25. Neumann, D. L. & Waters, A. M. The use of an unpleasant sound as an unconditional
stimulus in a human aversive Pavlovian conditioning procedure. Biol. Psychol. 73, 175–185 (2006).
26. Ioannidis, J. P. A. Why most published research findings are false. PLoS Med. 2, 696–701 (2005).
27. Munafò, M. R. et al. A manifesto for reproducible science. Nat. Hum. Behav. 1, (2017). 28. Open Science Collaboration. Estimating the reproducibility of psychological science.
Science (80-. ). 349, (2015).
32
30. Champely, S. pwr: Basic Functions for Power Analysis. (2017).
31. Yovel, G. & Kanwisher, N. Face Perception : Domain Specific, Not Process Specific. Neuron 44, 889–898 (2004).
32. Vieira, T. F., Bottino, A., Laurentini, A. & De Simone, M. Detecting siblings in image pairs. Vis. Comput. 30, 1333–1345 (2014).
33. Fantastic Fractals. (2013). Available at: http://fantastic-fractals.com.
34. Snack-Food Items Dataset. (2017). Available at:
http://schonberglab.tau.ac.il/resources/snack-food-image-database/.
35. Bigman, Y. E., Sheppes, G. & Tamir, M. When Less is More: Effects of the Availability of Strategic Options on Regulating Negative Emotions. Emotion (2017).
36. Kleiner, M. et al. What’s new in Psychtoolbox-3. Perception 36, 1 (2007).
37. Shinners, P. PyGame–python game development. (2011). Available at: http://www.pygame.org/.
38. Becker, G. M., DeGroot, M. H. & Marschak, J. Measuring utility by a single‐response
sequential method. Behav. Sci. 9, 226–232 (1964).
39. Von Neumann, J. & Morgenstern, O. Theory of games and economic behavior. (Princeton university press, 1944).
40. Colley, W. Colley’s bias free college football ranking method: The colley matrix explained. Princet. Univ. 1–23 (2002).
41. Bates, D., Mächler, M., Bolker, B. M. & Walker, S. C. Fitting linear mixed-effects models using lme4 Douglas. J. Stat. Softw. 67, 1–48 (2015).
42. Wickham, H. ggplot2: Elegant Graphics for Data Analysis. (Springer-Verlag, 2009). 43. Orne, M. T. On the social psychology of the psychological experiment: With particular
reference to demand characteristics and their implications. Am. Psychol. 17, 776–783 (1962).
44. McGuire, J. T. & Kable, J. W. Go means green. Nat. Neurosci. 17, 489–490 (2014). 45. Bar-Haim, Y., Lamy, D., Pergamin, L., Bakermans-Kranenburg, M. J. & van IJzendoorn,
M. H. Threat-related attentional bias in anxious and nonanxious individuals: a meta-analytic study. Psychol. Bull. 133, 1–24 (2007).
33
47. Browning, M., Holmes, E. A., Charles, M., Cowen, P. J. & Harmer, C. J. Using attentional bias modification as a cognitive vaccine against depression. Biol. Psychiatry 72, 572–579 (2012).