Sub-barrier fusion of Si+Si systems
G.Colucci1,,G.Montagnoli1,A. M.Stefanini2,D.Bourgin4,P. ˇColovi´c5,L.Corradi2,S.Courtin4,M.Faggian1,E. Fioretto3, F. Galtarossa2,6, A. Goasduff2, F. Haas4,M. Mazzocco1, F. Scarlassara1, C.Stefanini1, E. Strano1, M. Urbani1,S.Szilner5, andG. L.Zhang2
1Dipartimento di Fisica e Astronomia, Universitá di Padova, and INFN, I-35131 Padova, Italy 2INFN, Laboratori Nazionali di Legnaro, I-35020 Legnaro, Italy
3IPHC, CNRS-IN2P3, Université de Strasbourg, F-67037 Strasbourg Cedex 2, France 4Ruder Boškovi´c Institute, HR-10002 Zagreb, Croatia
5Dipartimento di Fisica e Scienze della Terra, Univ. di Ferrara, Ferrara, Italy
Abstract. The near- and sub-barrier fusion excitation function has been measured for the system30Si+30Si at the Laboratori Nazionali di Legnaro of INFN, using the30Si beam of the XTU Tandem accelerator in the energy range 47 - 90 MeV. A set-up based on a beam electrostatic deflector was used for detecting fusion evaporation residues. The measured cross sections have been compared to previous data on28Si+28Si and Coupled Channels (CC) calculations have been performed using M3Y+repulsion and Woods-Saxon potentials, where the low-lying 2+and 3− excitations have been included. A weak imaginary potential was found to be necessary to reproduce the low energy28Si+28Si data. This probably simulates the effect of the oblate deformation of this nucleus. On the contrary,30Si is a spherical nucleus,30Si+30Si is nicely fit by CC calculations and no imaginary potential is needed. For this system, no maximum shows up for the astrophysical S-factor so that we have no evidence for hindrance, as confirmed by the comparison with CC calculations. The logarithmic derivative of the two symmetric systems highlights their different low energy trend. A difference can also be noted in the two barrier distributions, where the high-energy peak present in28Si+28Si is not observed for30Si+30Si, probably due to the weaker couplings in last case.
1 Introduction
It is well known that nuclear structure strongly influences fusion reaction dynamics at energies near and below the Coulomb barrier. The comparison of data for neighboring isotopes is a sensitive tool to evidence this influence. Through the application of this method it has been possi-ble to discover the influence of transfer channels on fusion reactions, as in Ni+Ni [1, 2] and Ca+Ca [3] systems, and
the effect of changing structure from spherical to strongly
deformed nuclei, as in16O+148,154Sm [4, 5].
A similar comparative study has been performed also for the Si+Si systems [6], where the interest originates
from the different shape of the silicon isotopes: 30Si is
nearly spherical, whereas28Si is strongly deformed with
an oblate shape. Previous studies [6, 7] revealed the in-fluence of transfer on fusion of the asymmetric system
28Si+30Si which has been explained by considering
one-and successive two-neutron transfer channels in the cou-pling scheme.
The excitation functions of28Si+28Si and30Si+30Si have
different trends (see Fig. 1a).The case of28Si+28Si
involv-ing deformed nuclei shows an unusual behaviour, where the cross section is hindered just below the barrier and then enhanced at lower energies, as shown in the
e-mail: giulia.colucci@studenti.unipd.it
ison with the CC calculations of Fig. 1b. It was further surprising that the low-energy data were well reproduced only by artificially applying a weak, short-ranged imagi-nary potential, probably simulating the effect of the oblate
deformation. This feature has to be further investigated and a complete study of30Si+30Si appeared to be very
im-portant in this respect.
The spherical shape of30Si together with the absence of
transfer channels with positive Q-values allows to only consider couplings to the vibrational states. The lack of experimental fusion data below 4 mb for 30Si+30Si
pre-vented a meaningful comparison between the two systems. Therefore, a fusion experiment has been recently carried out at Laboratori Nazionali di Legnaro (LNL) with the purpose to extend the data of30Si+30Si down to energies
deeply below the Coulomb barrier.
In this contribution we present the results of this full mea-surement from well below to well above the Coulomb bar-rier, and we perform a comparison with the existing data for the28Si+28Si system.
2 Experimental set-up
Fusion cross sections for the30Si+30Si system have been
10-3
10-2
10-1
100
101
102
103
22 24 26 28 30 32 34
28+30 Ch30 W=5 28+28 Ch10 W=0 28+28 Ch10 W=5 σ fus
(mb)
Ec.m. (MeV) 30Si +30Si
28Si + 28Si 28Si + 30Si
(a)
0.0001 0.001 0.01 0.1 1 10 100 1000
22 24 26 28 30 32 34
Ch10 W=0
Ch10 W=5 Ch10 WS
Ec.m. (MeV)
σ fus
(mb)
28Si+28Si
30Si+30Si (b)
Figure 1: (a) Measured fusion excitation function of 28Si+28Si, 28Si+30Si [6] and previous data for 30Si+30Si [8]; the lines are the results of CC calculations. (b) Comparison of28Si+28Si with CC calculations involv-ing a Woods-Saxon potential (Ch10 WS) and a double folding M3Y+rep. potential with (Ch10 w5) and without (Ch10 w0) an imaginary short ranged potential.
electrical rigidity with respect to beam and beam-like par-ticles, using an electrostatic deflector. This experimental set-up is shown in Fig. 2, it allows fast and reliable mea-surements of relative and absolute cross sections and has been employed in several sub- and near-barrier fusion ex-periments at LNL in recent years. A subsequent E-TOF-∆E telescope allows the ER identification. This telescope consists of two micro-channel plate (MCP) detectors, a transverse field ionization chamber (IC) and a silicon de-tector placed in the same gas (CH4) volume. The IC pro-vides an energy loss signal∆E, while the two MCPs yield the time of flights (TOF) together with the silicon detec-tor. In this configuration the silicon detector measures the residual energy of the ER and gives both the trigger for data acquisition and the start signal for the TOF. Typical spectra of TOF as a function of the residual energy E are shown in Fig. 3, where a good separation of ER events from the residual beam can be appreciated at energies both above and below the Coulomb barrier. Analogous two-dimensional spectra of TOF vs. ∆E and∆E vs. E were used in the data analysis.
Four silicon detectors were placed symmetrically at θlab=16◦around the beam direction, in the sliding seal re-action chamber. These detectors were used to monitor the beam and normalize to the Mott scattering cross section. The XTU Tandem accelerator at LNL provided30Si beams in the energy range of 47-90 MeV, with intensities of 15-30 pnA. The targets consisted of 50µg/cm2 metallic30Si evaporated on 30µg/cm2carbon backings facing the beam. The isotopic enrichment of 30Si was 99.64 %, where the small amounts of 29Si and 28Si did not affect the fu-sion cross section because of their higher Coulomb bar-riers. The carbon backing and the silicon target itself introduced an average beam energy loss of around 750-850 keV, which was taken into account in the analysis. Three ER angular distributions were measured at the ener-gies of 58, 72 and 80 MeV in the range from -6◦ to+9◦. The total fusion cross section was derived by integrating those distributions, and by simple interpolations or extrap-olations for all other energies, where measurements were taken only at 2◦(or 3◦for low energies).
The measured energy range allowed to extend the excita-tion funcexcita-tion down to4µb, as shown Fig. 4a. The re-ported errors are statistical uncertainties, which are 1-2 % at the higher energies and increase to 10-20 % at energies below the barrier. The systematic errors on the absolute cross sections are estimated±7-8 %, due to the geometri-cal solid angle uncertainties, angular distribution integra-tions and mainly to the deflector transmission.
The fusion cross sections of 30Si+30Si and 28Si+28Si are reported in Fig. 4b. From this first comparison it appears that the two excitation functions behave differently at low energies with a flatter slope for28Si+28Si. A CC analysis has been performed to understand the origin of this differ-ence.
(a)
(b)
10-3
10-2
10-1
100
101
102
103
22 24 26 28 30 32 34
28+30 Ch30 W=5 28+28 Ch10 W=0 28+28 Ch10 W=5 σ fus
(mb)
Ec.m. (MeV) 30Si +30Si
28Si + 28Si 28Si + 30Si
(a)
0.0001 0.001 0.01 0.1 1 10 100 1000
22 24 26 28 30 32 34
Ch10 W=0
Ch10 W=5 Ch10 WS
Ec.m. (MeV)
σ fus
(mb)
28Si+28Si
30Si+30Si (b)
Figure 1: (a) Measured fusion excitation function of 28Si+28Si, 28Si+30Si [6] and previous data for 30Si+30Si [8]; the lines are the results of CC calculations. (b) Comparison of28Si+28Si with CC calculations involv-ing a Woods-Saxon potential (Ch10 WS) and a double folding M3Y+rep. potential with (Ch10 w5) and without (Ch10 w0) an imaginary short ranged potential.
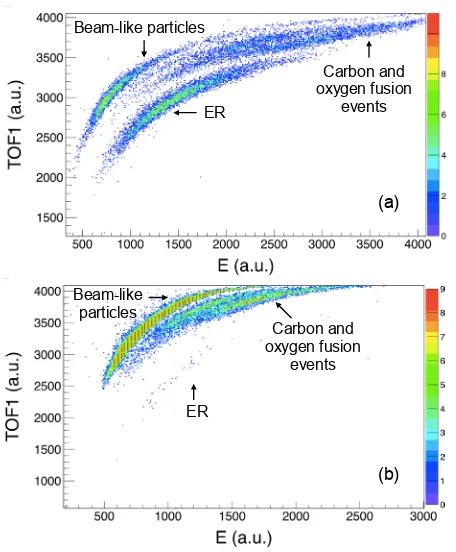
electrical rigidity with respect to beam and beam-like par-ticles, using an electrostatic deflector. This experimental set-up is shown in Fig. 2, it allows fast and reliable mea-surements of relative and absolute cross sections and has been employed in several sub- and near-barrier fusion ex-periments at LNL in recent years. A subsequent E-TOF-∆E telescope allows the ER identification. This telescope consists of two micro-channel plate (MCP) detectors, a transverse field ionization chamber (IC) and a silicon de-tector placed in the same gas (CH4) volume. The IC pro-vides an energy loss signal∆E, while the two MCPs yield the time of flights (TOF) together with the silicon detec-tor. In this configuration the silicon detector measures the residual energy of the ER and gives both the trigger for data acquisition and the start signal for the TOF. Typical spectra of TOF as a function of the residual energy E are shown in Fig. 3, where a good separation of ER events from the residual beam can be appreciated at energies both above and below the Coulomb barrier. Analogous two-dimensional spectra of TOF vs. ∆E and∆E vs. E were used in the data analysis.
Four silicon detectors were placed symmetrically at θlab=16◦around the beam direction, in the sliding seal re-action chamber. These detectors were used to monitor the beam and normalize to the Mott scattering cross section. The XTU Tandem accelerator at LNL provided30Si beams in the energy range of 47-90 MeV, with intensities of 15-30 pnA. The targets consisted of 50µg/cm2 metallic30Si evaporated on 30µg/cm2carbon backings facing the beam. The isotopic enrichment of 30Si was 99.64 %, where the small amounts of 29Si and 28Si did not affect the fu-sion cross section because of their higher Coulomb bar-riers. The carbon backing and the silicon target itself introduced an average beam energy loss of around 750-850 keV, which was taken into account in the analysis. Three ER angular distributions were measured at the ener-gies of 58, 72 and 80 MeV in the range from -6◦ to+9◦. The total fusion cross section was derived by integrating those distributions, and by simple interpolations or extrap-olations for all other energies, where measurements were taken only at 2◦(or 3◦for low energies).
The measured energy range allowed to extend the excita-tion funcexcita-tion down to4µb, as shown Fig. 4a. The re-ported errors are statistical uncertainties, which are 1-2 % at the higher energies and increase to 10-20 % at energies below the barrier. The systematic errors on the absolute cross sections are estimated±7-8 %, due to the geometri-cal solid angle uncertainties, angular distribution integra-tions and mainly to the deflector transmission.
The fusion cross sections of 30Si+30Si and 28Si+28Si are reported in Fig. 4b. From this first comparison it appears that the two excitation functions behave differently at low energies with a flatter slope for28Si+28Si. A CC analysis has been performed to understand the origin of this differ-ence.
(a)
(b)
Figure 2: The experimental set-up (a) and its scheme (b). The reaction chamber, the electrostatic deflector and the telescope E-TOF-∆E are drawn from the left.
Beam-like particles
ER
Carbon and oxygen fusion
events
(a)
Beam-like particles
ER
Carbon and oxygen fusion
events
(b)
Figure 3: Time of flight TOF1 (ordinate) as a function of the residual energy E (abscissa). The spectra were ob-tained above the Coulomb barrier (80 MeV,σf us=527 mb, (a)) and at a sub-barrier energy of 50 MeV (σf us=115µb, (b)). We can see, besides fusion events from30Si+30Si and beam-like particles, the residues produced by the fusion of 30Si with the carbon and oxygen present in the target.
3 Coupled channel calculations
The CC analysis of the sub-barrier excitation function em-ployed, in a first step, a double-folding M3Y+repulsion potential [9]. The calculation makes use of the isocen-trifugal approximation and includes one- and two-phonon vibrational modes as well as mutual excitations of the low-lying 2+and 3−states in both projectile and target (this cal-culation is called Ch10 in Fig. 5). The adopted coupling strengths are reported in Table I of Ref. [6].
The30Si nucleus is nearly spherical, indeed the measured quadrupole moment of the 2+ state is Q
2 = –0.05(6) b, which is consistent with zero. As a consequence, the loca-tion of minimum of channels potentials is essentially the same in all channels, as discussed in detail in Ref. [6]. As anticipated in Sec. 2, the two excitation functions of 28Si+28Si and 30Si+30Si have different trends below the barrier. This difference was suggested to be due to the different shape of the two silicon isotopes. The effect of the oblate deformation of28Si was simulated in Ref. [6] by applying a weak imaginary potential at small ion-ion distances (inside the Coulomb barrier), and this allowed to obtain a good data fit. On the contrary, it appears that in the case of30Si+30Si no imaginary potential is needed below the barrier, simply because that nucleus is spherical. This is shown in Fig. 5a where the results of CC calculations without and with the imaginary potential are reported. It
10-3 10-2 10-1 100 101 102 103
24 28 32 36 40 44 LNL Bozek
σ fus
(mb)
Ec.m.(MeV)
(a)
10-4
10-3
10-2
10-1
100
101
102
103
0.8 0.85 0.9 0.95 1 1.05 1.1 1.15 1.2 σ fus
(mb)
Ec.m./ VB
30Si+30Si
28Si+28Si (b)
Figure 4: Fusion excitation function of 30Si+30Si com-pared to previous experimental data [8] (a) and to the 28Si+28Si system (b).
is evident that there is essentially no difference between the two calculations.
4 Barrier distributions
Fusion barrier distributions [10] often give a significant insight into the role of the target and projectile structure. Therefore the barrier distribution of30Si+30Si has been ex-tracted and compared to the one of28Si+28Si in order to obtain more information on the possible role of the defor-mation of28Si.
10-3 10-2 10-1 100 101 102 103
22 24 26 28 30 32 34
Ch10 WS Ch10 W=0
Ch1 W=0
Ch10 W=5 σ fus
(mb)
E
c.m.(MeV) 30Si+30Si
(a)
10-4 10-3 10-2 10-1 100 101 102 103
0.8 0.85 0.9 0.95 1 1.05 1.1 1.15 1.2
Ch10 W=5 Ch10 W=0 Ch1 W=0 σ fus
(mb)
Ec.m./ VB
28Si+28Si (b)
30Si+30Si
Figure 5: (a) Measured fusion cross section for30Si+30Si
compared to the no-coupling limit and to the CC calcula-tions, based on three different potentials: a Woods-Saxon
potential (Ch10 WS), and a M3Y+rep. potential with
(Ch10 W5) and without (Ch10 W0) an imaginary poten-tial. (b) Comparison of30Si+30Si with28Si+28Si. CC
Cal-culations for the second system [6] are also reported, based on a M3Y+rep. potential with an imaginary part.
5 Hindrance
Hindrance is a suppression of fusion cross section with respect to standard CC calculations, occurring far below the Coulomb barrier [12, 13]. The investigation of hindrance usually makes use of two model-independent representations of the excitation functions which allow to reveal the presence of the phenomenon: the astrophysical S-factor [14] and the logarithmic derivative L(E). Indeed, the S factor shows a maximum vs. energy in the presence of hindrance at the energy where the logarithmic slope L(E) of the excitation function reaches the value LCS expected for a constant astrophysical S factor.
In the case of 30Si+30Si the S factor does not show any
maximum vs. energy (see Fig. 7b), even if it appears to saturate at the lowest measured energies and the loga-rithmic derivative does not cross the LCS curve (Fig. 7a). These features suggested the absence of hindrance in the measured energy range, but a confirmation was necessary. Indeed, it has been pointed out that in systems
-0.1 -0.05 0 0.05 0.1 0.15 0.2 0.25 0.3
24 26 28 30 32 34 36 38
1 MeV 1.5 MeV
BD(E) (MeV
-1 )
Ec.m.(MeV)
30Si+30Si (a)
-0.05 0 0.05 0.1 0.15 0.2 0.25 0.3 0.35
22 24 26 28 30 32 34 36 38
1 MeV 1.5 MeV
BD(E) (MeV
-1 )
Ec.m.(MeV) 28Si+28Si
(b)
Figure 6: Barrier distributions extracted for 30Si+30Si
(a) and28Si+28Si (b), with energy steps of 1.0 MeV (red
points) and 1.5 MeV (blue points).
with a positive Q-value for fusion the S factor does not necessarily develop a maximum [13]. A comparison with the theoretical model was then performed by CC calculations with a standard Woods-Saxon potential. These calculations nicely fit the experimental excitation function, as can be seen in Fig. 5a. The analogous calculations using the M3Y+rep. potential give very
similar results. It is evident that the excitation function is not suppressed at energies below the Coulomb barrier, so that there is no evidence of hindrance down to around 4µb.
6 Summary
The fusion excitation function of 30Si+30Si has been
measured in a wide energy range down to 4µb. The comparison with 28Si+28Si shows that the two systems
behave differently near the barrier where the high energy
peak observed in the barrier distribution of 28Si+28Si is
not found for30Si+30Si.
Below the barrier the heavier system exhibits a regular trend in contrast with the unusual behaviour of28Si+28Si.
The weaker couplings in 30Si+30Si and its spherical
shape could be responsible for this difference. This is
10-3 10-2 10-1 100 101 102 103
22 24 26 28 30 32 34
Ch10 WS Ch10 W=0
Ch1 W=0
Ch10 W=5 σ fus
(mb)
E
c.m.(MeV) 30Si+30Si
(a)
10-4 10-3 10-2 10-1 100 101 102 103
0.8 0.85 0.9 0.95 1 1.05 1.1 1.15 1.2
Ch10 W=5 Ch10 W=0 Ch1 W=0 σ fus
(mb)
Ec.m./ VB
28Si+28Si (b)
30Si+30Si
Figure 5: (a) Measured fusion cross section for30Si+30Si
compared to the no-coupling limit and to the CC calcula-tions, based on three different potentials: a Woods-Saxon
potential (Ch10 WS), and a M3Y+rep. potential with
(Ch10 W5) and without (Ch10 W0) an imaginary poten-tial. (b) Comparison of30Si+30Si with28Si+28Si. CC
Cal-culations for the second system [6] are also reported, based on a M3Y+rep. potential with an imaginary part.
5 Hindrance
Hindrance is a suppression of fusion cross section with respect to standard CC calculations, occurring far below the Coulomb barrier [12, 13]. The investigation of hindrance usually makes use of two model-independent representations of the excitation functions which allow to reveal the presence of the phenomenon: the astrophysical S-factor [14] and the logarithmic derivative L(E). Indeed, the S factor shows a maximum vs. energy in the presence of hindrance at the energy where the logarithmic slope L(E) of the excitation function reaches the value LCS expected for a constant astrophysical S factor.
In the case of 30Si+30Si the S factor does not show any
maximum vs. energy (see Fig. 7b), even if it appears to saturate at the lowest measured energies and the loga-rithmic derivative does not cross the LCS curve (Fig. 7a). These features suggested the absence of hindrance in the measured energy range, but a confirmation was necessary. Indeed, it has been pointed out that in systems
-0.1 -0.05 0 0.05 0.1 0.15 0.2 0.25 0.3
24 26 28 30 32 34 36 38
1 MeV 1.5 MeV
BD(E) (MeV
-1 )
Ec.m.(MeV)
30Si+30Si (a)
-0.05 0 0.05 0.1 0.15 0.2 0.25 0.3 0.35
22 24 26 28 30 32 34 36 38
1 MeV 1.5 MeV
BD(E) (MeV
-1 )
Ec.m.(MeV) 28Si+28Si
(b)
Figure 6: Barrier distributions extracted for 30Si+30Si
(a) and 28Si+28Si (b), with energy steps of 1.0 MeV (red
points) and 1.5 MeV (blue points).
with a positive Q-value for fusion the S factor does not necessarily develop a maximum [13]. A comparison with the theoretical model was then performed by CC calculations with a standard Woods-Saxon potential. These calculations nicely fit the experimental excitation function, as can be seen in Fig. 5a. The analogous calculations using the M3Y+rep. potential give very
similar results. It is evident that the excitation function is not suppressed at energies below the Coulomb barrier, so that there is no evidence of hindrance down to around 4µb.
6 Summary
The fusion excitation function of 30Si+30Si has been
measured in a wide energy range down to 4µb. The comparison with 28Si+28Si shows that the two systems
behave differently near the barrier where the high energy
peak observed in the barrier distribution of 28Si+28Si is
not found for30Si+30Si.
Below the barrier the heavier system exhibits a regular trend in contrast with the unusual behaviour of28Si+28Si.
The weaker couplings in 30Si+30Si and its spherical
shape could be responsible for this difference. This is
confirmed by CC calculations using the M3Y+rep. and a
0.5 1 1.5 2 2.5 3 3.5
0.8 0.85 0.9 0.95 1 1.05 1.1 1.15 1.2
L(E) (MeV
-1 )
Ec.m./ VB LCS
28Si+28Si
30Si+30Si (a)
100
101
102
103
104
105
106
107
0.7 0.8 0.9 1 1.1 1.2
Ch10 WS
Ec.m./ VB
S (a.u.)
28Si+28Si
30Si+30Si (b)
Figure 7: (a) Logarithmic derivative of the excitation func-tion of the two systems, where LCS (black line) is the slope expected for a constant astrophysical S-factor. (b) S-factor extracted from experimental data for both cases and, for
30Si+30Si, from CC calculations based on a Woods - Saxon
potential (green line), well reproducing the data.
Woods-Saxon potential, that are in good agreement with experimental data. At variance with the case of28Si+28Si,
adding a weak short-ranged imaginary potential is not necessary to reproduce the sub-barrier fusion cross sections of 30Si+30Si. When observing the logarithmic
slope of the excitation function and the S-factor, there is no evidence for hindrance in the measured energy range for this system.
7 Acknowledgments
The collaboration with H.Esbensen who performed the CC calculations with the M3Y+rep. potential is gratefully
ac-knowledged. This work has been supported in the part by the Croatian Science Foundation under the project 7194.
References
[1] M. Beckerman, M. Salomaa, A. Sperduto, J. D. Moli-toris, and A. Di Rienzo, Phys. Rev. C25, 837 (1982). [2] M. Beckerman et al., Phys. Rev. Lett.45, 1472 (1980). [3] G. Montagnoli et al., Phys. Rev. C85, 024607 (2012). [4] R. Stokstad et al., Z. Phys. A295, 269 (1980). [5] H. Esbensen, Nucl. Phys. A352, 147 (1982).
[6] G. Montagnoli et al., Phys. Rev. C90, 044608 (2014). [7] C. L. Jiang, et al., Phys. Rev. C78, 017601 (2008). [8] E. Bozek et al., Nucl. Phys. A451, 171 (1986) . [9] ¸S. Mi¸sicu and H. Esbensen, Phys. Rev. C75, 034606
(2007).
[10] N. Rowley, G. R. Satchler, and P. H. Stelson, Phys. Lett. B254, 25 (1991).
[11] H. Timmers et al., Nucl. Phys. A633, 421 (1998). [12] C. L. Jiang, et al., 2002, Phys. Rev. Lett. 89,
052701(2002).
[13] C. L. Jiang, H. Esbensen, B. B. Back, R. V. F. Janssens, and K. E. Rehm, Phys. Rev. C69, 014604 (2004).
![Figure 1:(a) Measured fusion excitation functionof28Si+28Si,28Si+30Si [6] and previous data for30Si+30Si [8]; the lines are the results of CC calculations.(b) Comparison of 28Si+28Si with CC calculations involv-ing a Woods-Saxon potential (Ch10 WS) and a d](https://thumb-us.123doks.com/thumbv2/123dok_us/8123627.1353565/2.595.316.528.514.728/measured-excitation-functionof-previous-calculations-comparison-calculations-potential.webp)
![Figure 5: (a) Measured fusion cross section for culations for the second system [6] are also reported, basedon a M3Y30Si+30Sicompared to the no-coupling limit and to the CC calcula-tions, based on three different potentials: a Woods-Saxonpotential (Ch10 WS)](https://thumb-us.123doks.com/thumbv2/123dok_us/8123627.1353565/4.595.328.509.103.403/measured-culations-reported-sicompared-coupling-dierent-potentials-saxonpotential.webp)

