Eye and Brain
Dove
press
R E v i E w open access to scientific and medical research
Open Access Full Text Article
The use of SD-OCT in the differential diagnosis
of dots, spots and other white retinal lesions
Elena Zaharova1
Jerome Sherman1–3
1State University of New York’s State
College of Optometry, University Eye Center, New York, NY, USA;
2SUNY Eye institute, New York, NY,
USA; 3New York Eye institute and
Laser Center, New York, NY, USA
Correspondence: Elena Zaharova 4 Bristol Road, Marblehead, MA 01945, USA
Tel +1 781 588 2137 Email zaharovaod@gmail.com
Purpose: To demonstrate the utility of a retinal imaging technique using spectral domain optical coherence tomography (SD-OCT) for creating a B-scan layer-by-layer analysis to aid in the differential diagnosis of various retinal dots, spots, and other white lesions.
Design: Review.
Methods: A retrospective review of imaging studies performed with SD-OCT (Topcon, 3DOCT-2000, Oakland, NJ) at SUNY State College of Optometry.
Results: B-scan layer-by-layer analysis and unique SD-OCT reflectivity patterns of the following retinal white lesions are reviewed in the order of their retinal layer localization: myelinated nerve fiber layer, cotton wool spot, exudates, edema residues, drusen, fundus albipunctatus, Stargardt disease, Bietti crystalline dystrophy, punctate inner choroidopathy (PIC), presumed ocular histoplasmosis syndrome (POHS), post-photocoagulation chorioretinal scarring, and osseous choristoma.
Conclusion: The reviewed images demonstrate the utility of SD-OCT in the identification of the unique characteristics of the presented retinal pathologies. SD-OCT is ideal for retinal layer localization of lesions, thus enhancing the differential diagnosis of retinal dots, spots, and other white lesions. Even though true pathognomonic patterns are rare, highly suggestive findings of certain retinal abnormalities often facilitate immediate recognition and diagnosis.
Keywords: SD-OCT, photoreceptor integrity line, retinal pigment epithelium, white dot syndrome, retinal pathology, imaging
Introduction
Optical coherence tomography (OCT) has revolutionized our approach to retinal disease identification and diagnosis. It is a noninvasive imaging procedure of ocular structures that employs nonionizing optical radiation.1,2 Recent work in the field
of ophthalmic OCT has demonstrated that spectral or Fourier detection methods (SD-OCT) enable OCT imaging with significantly improved speed, resolution, and sensitivity, as opposed to time domain OCT (TD-OCT).3–6 SD-OCT is capable of
obtaining 27,000–40,000 A-scans/second with an axial resolution of 3.5–6 µm,1,7 as
opposed to an acquisition speed of 400 A-scans/second, as in TD-OCT.2 Thus, SD-OCT
imaging results in considerable improvement in image acquisition speed and resolution, minimizing the well-known limitations of TD-OCT, such as limited retinal nerve fiber layer (RNFL) resolution, operator error, and increased motion artifacts.1,2 The unique
capability of SD-OCT technology is to provide a layer-by-layer analysis of the retina with a resolution highly superior to contact lens fundus ophthalmoscopy and/or fundus photography. Clinically detectable drusen by ophthalmoscopy, for example,
Eye and Brain downloaded from https://www.dovepress.com/ by 118.70.13.36 on 22-Aug-2020
For personal use only.
Number of times this article has been viewed
This article was published in the following Dove Press journal: Eye and Brain
Dovepress
Zaharova and Sherman
is 30 µm8 and resolution of fundus photography is 25 µm,9
whereas axial resolution of SD-OCT has been reported to be 3.5–6 µm.1,7 The high sensitivity of this instrument provides
entirely new imaging capabilities and, therefore, has signifi-cant impact on diagnosis and decision making.
SD-OCT is often referred to in literature as “optical biopsy method” due to its extraordinary ability to provide information on ocular subsurface structures with retinal layer-by-layer analysis, otherwise obtainable only by histology.3
The interface between different retinal layers is determined by changes in reflective properties between the tissues.1 One
of the most important new SD-OCT developments secondary to the higher resolution is the recognition and clinical impor-tance of the photoreceptor integrity line (PIL),10 also referred
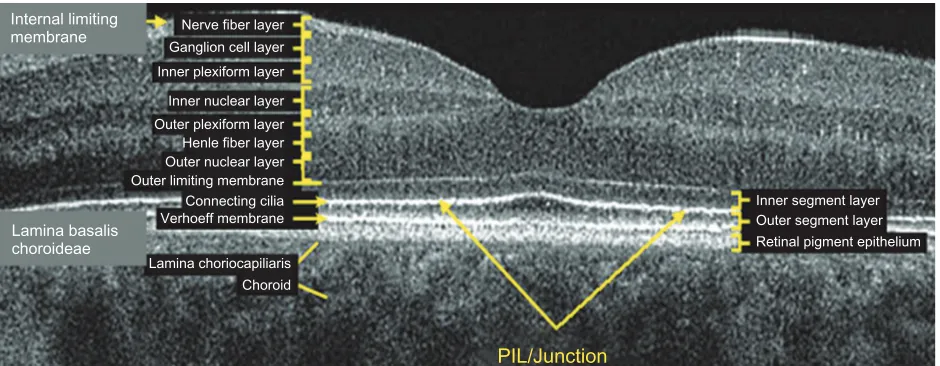
to as the IS/OS line. PIL represents the junction between the inner (IS) and outer (OS) segments of the photoreceptors (Figure 1). Even though it is barely visible on histological sections, PIL is highly reflective with SD-OCT imaging. Recent histological studies have shown that the second hyper-reflective outer retinal OCT band, currently attributed to IS/ OS junction, is likely due to mitochondria packing geometry and the organelle’s high refractive index (1.4).11 Costa et al
suggested that the inner layer, which is identical to the PIL reported in this study, could not be visualized with OCT imaging due to either a missing or disrupted PIL in the eyes of patients with outer retinal disorders.12 Moreover, studies
have shown that the integrity of the PIL is associated with visual function.13,14 Shin et al have recently reported that
the length of a disrupted PIL on SD-OCT in patients with retinal vein occlusion is closely associated, if not predictive, of visual outcome.14 High reflectivity and integrity of the
PIL has been found to be independent of age and low scan sensitivities.10 In normal eyes, PIL is as visible as the retinal
pigment epithelium (RPE). If the PIL disappears while the RPE is still visible, it is likely that the PIL is abnormal in this region of the retina.
The current uses of SD-OCT are extensive and include retinal nerve fibre layer (RNFL) analysis, vitreomacular interface evaluation, and macular abnormalities. This study will explore SD-OCT characteristics of some common retinal and choroidal pathologies that present as white lesions: myelinated nerve fiber layer, cotton wool spot, exudates, edema residues, drusen, fundus albipunctatus, Stargardt disease, Bietti crystalline dystrophy, punctate inner choroidopathy (PIC), presumed ocular histoplasmosis syndrome (POHS), post-photocoagulation chorioretinal scarring, and osseous choristoma. In this study, the above retinal white dots, spots, and other lesions are categorized based on the retinal layer where they are thought to be found. The pathologies that affect the inner retina are myelinated nerve fiber layer and cotton wool spot. Retinal lesions that are typically localized to the outer retina are exudates and edema residues. Retinal pigment epithelium (RPE) abnormalities are further subdivided into sub-RPE deposits such as in drusen and fundus albipunctatus and RPE migration and/or atrophy cases such as in Stargardt disease, Bietti crystalline dystro-phy, PIC, POHS, and post-photocoagulation chorioretinal scarring. In this study, B-scan analysis of retinal layers and unique SD-OCT reflectivity patterns of the white deposits in each of the above conditions are presented, stressing the importance of SD-OCT imaging, and the evaluation of PIL and RPE integrity in the differential diagnosis.
Internal limiting membrane
Lamina basalis choroideae
Nerve fiber layer Ganglion cell layer Inner plexiform layer
Inner nuclear layer Outer plexiform layer Henle fiber layer
Inner segment layer Outer segment layer Retinal pigment epithelium Outer nuclear layer
Outer limiting membrane Connecting cilia Verhoeff membrane
Lamina choriocapiliaris Choroid
PIL/Junction
Figure 1 Layer-by-layer B-scan SD-OCT display of normal retina. Abbreviation: SD-OCT, spectral domain optical coherence tomography.
Eye and Brain downloaded from https://www.dovepress.com/ by 118.70.13.36 on 22-Aug-2020
Dovepress SD-OCT in the diagnosis of white retinal lesions
Methods
This study presents a retrospective review of imaging studies performed with SD-OCT (Topcon, 3DOCT-2000, Oakland, NJ) at the SUNY State College of Optometry. The B-scan image of the PIC case included in this study was taken with Spectralis OCT (Heidelberg Engineering, Carlsbad, CA).
Results
inner retinal lesions
Myelinated retinal nerve fiber layer (MRNF)
MRNF is reported to be present in approximately 1% of the population. Histological studies show the presence of oligodendrocyte-like glial cells and the surrounding myeli-nation that is thought to be due to developmental anomaly or acquired insult.15 Generally, during embryogenesis the
process of myelination should stop at the level of the lamina cribrosa due to the dense aggregation of astrocytes that acts as a barrier.15 Abnormal migration of oligodendrocyte-like
cells into the retina results in MRNF formation and is thought to happen either prior to the development of the barrier func-tion of lamina cribrosa or due to the abnormal dislocafunc-tion of the glial cells as a result of a temporary loss of the barrier function of the lamina cribrosa.15 The condition is usually
asymptomatic; however, wide-spread myelination is associ-ated with increased degree of axial myopia and hypoplastic disc in the affected eye.15 Usually no treatment is indicated
unless neovascularization or vitreous hemorrhage complica-tions arise.15 Clinically, MRNF appears as white or gray-white
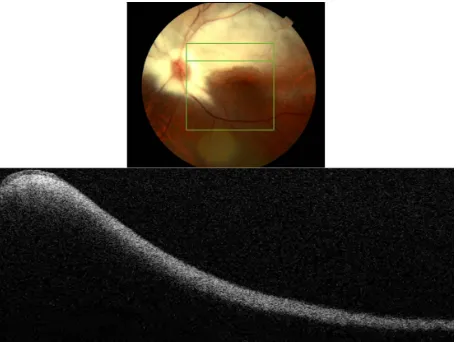
striated patches with feathery edges (Figure 2). Myelination can be localized to the vascular arcades, be contiguous with the disc, or be separate from it. The size depends on the sever-ity of developmental anomaly ranging from small 1–2DD (1500–3000 µm) to large, extending into the posterior pole and mid-periphery.
B-scan SD-OCT reflectivity pattern
Figure 2 shows hyper-reflective thickened RNFL. The increased thickness of the RNFL completely blocks the view of underlying structures. The increase in thickness of MRNF closer to the disc, the part of retina where RNFL is the thickest, should be noted.
Cotton wool spots (CWS)
CWSs develop secondary to focal ischemia associated with occlusion of precapillary arterial flow.16–19 Blood flow
abnormality, rather than a simple infarct is thought to cause an ischemic event.19 There are numerous retinal vascular
and systemic diseases associated with formation of cotton
wool spots.16–18 There can be an ischemic etiology, embolic,
infectious, tractional, traumatic, or simply idiopathic.16 CWSs
are comprised of swollen ganglion cell axons that expand as much as 10-fold (to some 5–15 µm in diameter) due to focal ischemic events.19 Light microscopy studies have revealed the
presence of cytoid bodies within a swollen axon.16–19 Cytoid
bodies form due to the accumulation of intracytoplasmic organelles that were interrupted in their normal axoplasmic flow.16–18 Clinically, CWSs appear as slightly elevated white
or yellow-white lesions with cloud-like or fluffy borders (Figure 3).16–18 CWSs are typically localized to nerve fiber
layer and develop at the border of large ischemic areas. The typical size of CWSs is ,0.25 DD (,400 µm). They usually resolve within 5–12 weeks, but may persist for 1–2 years in diabetic patients.17,18
B-scan SD-OCT reflectivity pattern
Figure 3 shows a hyper-reflective thickened area within the RNFL that appears as a nodular shape rather than continuously thickened RNFL. The retinal layers underneath the CWS are “masked” by the thickened nerve fibers.
Outer retinal lesions
Hard exudates
There are numerous retinal vascular diseases associated with hard exudates, including diabetic retinopathy, hypertensive retinopathy, retinal venous obstruction, retinal arterial macroaneurysm, radiation retinopathy, Coat’s disease, and capillary hemangioma.20 Exudates are frequently associated
Figure 2 Fundus photograph (top) showing MRNF; the B-scan line on the fundus photograph has the same width as the B-scan SD-OCT image (bottom); SD-OCT
image demonstrates thickened RNFL due to MRNF, thickness of which increases closer to the optic nerve head.
Abbreviations: SD-OCT, spectral domain optical coherence tomography; RNFL,
retinal nerve fiber layer; MRNF, myelinated retinal nerve fiber layer.
Eye and Brain downloaded from https://www.dovepress.com/ by 118.70.13.36 on 22-Aug-2020
Dovepress
Zaharova and Sherman
with choroidal neovascular membrane (CNVM) formation in the wet form of age-related macular degeneration (ARMD). The pathophysiology of exudates is described by chronic localized leakage of plasma as a result of vasodilation.20
This causes a deposition of lipid, which can be visualized clinically as waxy white-yellow lesions with distinct margins (Figure 4). Exudates are mainly composed of lipoprotein and lipid-filled macrophages. The deposition is thought to occur
in the outer plexiform layer (OPL) of the retina. The size of exudates is usually small, ranging between 15–55 µm, with those smaller than 25 µm invisible to ophthalmoscopy and fundus photography.20 The lipid deposits typically develop
at the junction of normal and edematous retina, arranging themselves as clumps and rings, which are commonly termed a circinate ring in diabetic retinopathy and a macular star in hypertensive retinopathy. It generally takes months to years for exudates to reabsorb.20
B-scan SD-OCT reflectivity pattern
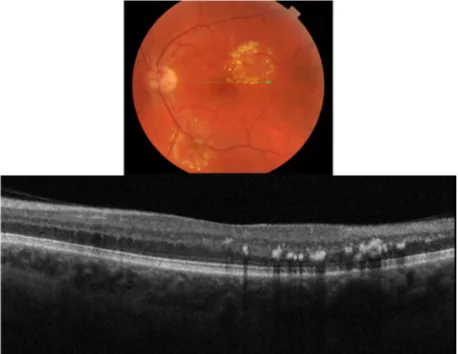
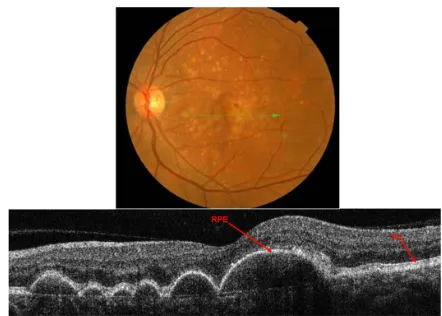
Our SD-OCT images of patients with exudates confirm the location of the deposits in and around OPL retinal layer (Figure 4). Deposits present as hyper-reflective minute dots at the level of OPL. One hundred percent of the time the differential diagnosis between drusen and exudates can be made by layer localization of the deposits in question (Figure 5). Figure 5 shows fundus photography (top) and its corresponding SD-OCT image (bottom) demonstrating a B-scan through the two different types of deposit: exudates (blue square) and drusen (red arrow).
Figure 6 illustrates the example of superior resolution of SD-OCT in comparison to fundus photography. Nearly all of the hard exudates in this horizontal section are invisible to ophthalmoscopy but easily detected with SD-OCT. By reviewing all 128 horizontal sections in the 6 × 6 mm box, 405 exudates were detected with an SD-OCT; whereas only 20 were visualized with ophthalmoscopy, a 20-fold sensitivity improvement.
Subretinal deposits/edema residues/retinal precipitates
Edema residues, also referred to as subretinal deposits or retinal precipitates, are commonly seen in patients with central serous chorioretinopathy (CSC); 86% of patients with CSC were reported to present with white deposits in the area of retinal detachment.9 Edema residues begin as
minute yellowish deposits of granular material that are believed to contain photoreceptor outer segment debris.9
Later these deposits coalesce together into dense confluent patches of amorphous extravascular fibrinous material.9
Clinically, edema residues are similar in appearance to hard exudates (Figure 7), presenting as waxy white-yellow lesions with distinct margins.21 Deposits are variable in size
ranging from small (10–20 µm) to large (200–300 µm).9
Generally, edema residues are located in front of the RPE layer and they are highly confined to the detached area of retina.9
Figure 3 Fundus photograph (top) showing CWS (blue rectangle) in the left eye of
a patient with diabetic retinopathy; the B-scan line on the fundus photograph has the
same width as the B-scan SD-OCT image (bottom); SD-OCT image demonstrates thickened RNFL in CWS (blue rectangle).
Abbreviations: SD-OCT, spectral domain optical coherence tomography; RNFL,
retinal nerve fiber layer; CWS, cotton wool spot.
Figure 4 Fundus photograph (top) showing a circinate ring of exudates in the left eye
of a patient with macroaneurysm; the B-scan line on the fundus photograph has the
same width as the B-scan SD-OCT image (bottom); SD-OCT image demonstrates exudate deposits at the level of outer plexiform layer (OPL).
Abbreviation: SD-OCT, spectral domain optical coherence tomography.
Eye and Brain downloaded from https://www.dovepress.com/ by 118.70.13.36 on 22-Aug-2020
Dovepress SD-OCT in the diagnosis of white retinal lesions
B-scan SD-OCT reflectivity pattern
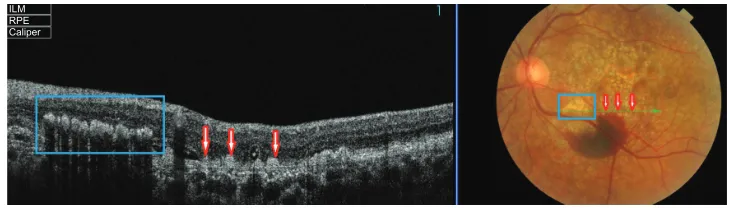
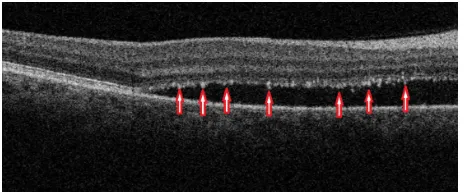
Figure 8 demonstrates edema residues that appear as hyper-reflective deposits (red arrows) within the area of retinal detachment. SD-OCT images confirm the location of sub-retinal deposits to the photoreceptor outer segment layer. These subretinal precipitates are virtually pathognomonic of CSC.
Retinal pigment epithelium (RPE) lesions
Sub-RPE deposits Drusen
Drusen deposits are commonly associated with ARMD and dominant drusen. ARMD is known to be the leading cause of irreversible legal blindness in people over 60 years of age.22
It is characterized by the progressive loss of central vision due to degeneration, dysfunction, and subsequent death of photoreceptor cells.23 Drusen-induced RPE degeneration has
been hypothesized to account for the loss of photoreceptor cells.22,23 The largest single component of drusen is lipid,
mainly esterified and unesterified cholesterol and phosphati-dylcholine.24 There are also other components such as
poly-saccharides, glycosaminoglycans, and protein molecules that
mediate proinflammatory and immune processes 22,24 Cellular
components within drusenoid deposits have been found to be RPE debris, lipofuscin, and melanin.22 All types and sizes of
drusen, including subclinical drusen smaller than 63 µm, have been reported to result in photoreceptor abnormalities, not affecting horizontal, amacrine, bipolar, and ganglion cells.23
Three types of drusen have been recently described: hard, subretinal drusenoid deposits, and soft.24 In this study, hard
drusen will be further subdivided into cuticular and infiltrative based on the SD-OCT reflective characteristics. Clinically, hard drusen appears as multiple densely packed small yellow-white nodular deposits of lipid-rich material (Figures 9 and 10). Typically it is 50–75 µm in size. The location of the deposits distinguishes hard drusen from subretinal drusenoid deposits. ILM
RPE Caliper
Figure 5 Fundus photograph (right) showing two different types of deposit: exudates (blue rectangle) and drusen (red arrow) in the left eye of a patient with wet ARMD; the B-scan line on the fundus photograph has the same width as the B-scan SD-OCT image (left).
Abbreviations: ARMD, age-related macular degeneration; SD-OCT, spectral domain optical coherence tomography.
Figure 6 Cross-section of a scanned fundus image (top); the B-scan line on the fundus photograph has the same width as the B-scan SD-OCT image (bottom).
Abbreviations: SD-OCT, spectral domain optical coherence tomography; ARMD, age-related macular degeneration.
Figure 7 Fundus photograph of the left eye showing edema residues inside the area
of CSC (enlarged).
Abbreviation: CSC, central serous chorioretinopathy.
Eye and Brain downloaded from https://www.dovepress.com/ by 118.70.13.36 on 22-Aug-2020
Dovepress
Zaharova and Sherman
Subretinal drusenoid deposits are similar in appearance to hard drusen and are similar in size (50–75 µm) (Figure 11). However, in comparison to hard drusen, as Spaide and Curcio24 reported, drusenoid-material is located above rather
than below the RPE layer. Soft drusen can be distinguished more easily from the other types of drusen based on their larger size (63–1000 µm in diameter).24 It appears as
yellow-white, dome-shaped, lipid-rich deposits with softer borders (Figure 12). Similar to the hard drusen, soft drusen deposits are located between the RPE and Bruch’s membrane.
B-scan SD-OCT reflectivity pattern
Cuticular hard drusen appear as discrete dome-shaped elevations of RPE layer due to the deposits external to the RPE basement membrane and solid in appearance (Figure 9).
It can be clearly visualized with SD-OCT imaging that the RPE layer is intact and elevated with sub-RPE deposits beneath it. Elevations have about the same height-to-width ratio. Another important distinguishing feature of cuticular hard drusen is the presence of PIL that sits on top of the dome-shaped structures. Even though it is thinner than in unaffected parts of retina, the PIL is generally present and intact.
Infiltrative hard drusen, on the other hand, appear drastically different with SD-OCT (Figure 10). Multiple discrete deposits infiltrate through the RPE and PIL with disruption of both layers.
Subretinal drusenoid deposits are conical in shape and have a more punctuate appearance. SD-OCT images show with great resolution the fact that deposits are localized between the RPE and the PIL layer (Figure 11). PIL is intact and slightly elevated with an intact outer limiting membrane sitting on top of it. In contrast to hard drusen, however, the RPE layer is not elevated because the deposits are sitting on top of it, rather than underneath.
Soft drusen exhibit a classical appearance with sub-RPE deposits that result in a pronounced elevation of the RPE (Figure 12). SD-OCT reveals elevated mounds or dome-shaped structures with less reflective material inside as compared with the solid-appearance of a hard drusen. Large elevated drusen are typically associated with a compromised PIL above the deposits, which can be clearly visualized with the SD-OCT B-scan. Another important feature of soft drusen is that in some cases it is possible to visualize Bruch’s membrane, which appears as a thin reflective layer that lies flat at the base of a soft drusen. Generally Bruch’s membrane is masked by the
Figure 8 B-scan SD-OCT image demonstrating edema residues confined to the
level of photoreceptor outer segment layer in CSC.
Abbreviations: SD-OCT, spectral domain optical coherence tomography; CSC, central serous chorioretinopathy.
Figure 9 Fundus photograph (top) showing hard cuticular drusen in the right eye
of a patient with ARMD; the B-scan line on the fundus photograph has the same
width as the B-scan SD-OCT image (bottom) which demonstrates the appearance
of hard cuticular drusen.
Abbreviations: SD-OCT, spectral domain optical coherence tomography; ARMD, age-related macular degeneration.
Figure 10 Fundus photograph (top) showing hard infiltrative drusen in the left eye of
a patient with ARMD; the B-scan line on the fundus photograph has the same width
as the B-scan SD-OCT image (bottom) which demonstrates the appearance of hard infiltrative drusen.
Abbreviations: SD-OCT, spectral domain optical coherence tomography; ARMD, age-related macular degeneration.
Eye and Brain downloaded from https://www.dovepress.com/ by 118.70.13.36 on 22-Aug-2020
Dovepress SD-OCT in the diagnosis of white retinal lesions
RPE shadow; however, when the RPE is compromised, it is possible to localize the presence of Bruch’s membrane.
Geographic atrophy
Analysis of fundus photography images of the right and left eyes of the patient who presented with subretinal drusenoid
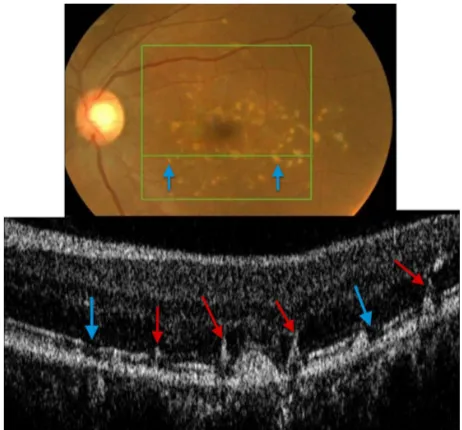
deposits revealed one area of deposits that appeared different from the rest (Figure 13). SD-OCT imaging was done through the region of interest (marked by a blue arrow). As Figure 13 shows, B-scan reveals missing PIL and the external limiting membrane, along with the easily visualized Bruch’s membrane, the presentation consistent with geographic atrophy. Drusenoid deposits, marked by red arrows, surround the area of geographic atrophy.
Fundus albipunctatus (fundus albi)
Fundus albi (FA) is a rare form of congenital stationary night blindness (CSNB) characterized by minute white dots and a delayed course of dark adaptation.25 The condition is
stationary and nonprogressive.25 A combination of FA and
cone dystrophy (CD) has been reported in several studies.27
CD and FA have been linked by a mutation in the 11-cis retinol dehydrogenase (RDH5) gene with autosomal reces-sive inheritance reported in at least 6 families.25–27RDH5 is
expressed predominantly in the RPE cells and plays a role in the visual cycle,26,27 which can explain the symptoms of
night blindness. The composition of the white deposits is unknown, but they have been reported to be localized to the level of the RPE.27
Clinically, FA presents as a large number of discrete monotonous subretinal white or pale-yellow deposits in the perimacular area and mid-periphery (Figures 14 and 15). The deposits are usually best visualized with a green-separation filter which localizes deposits to the retinal rather than the choroidal layer. The white dots usually fade slowly over decades.
Overlay Grid
Figure 11 Fundus photograph (top) showing subretinal drusenoid deposits in the
right eye of a patient with ARMD; the B-scan line on the fundus photograph has
the same width as the B-scan SD-OCT image (bottom) which demonstrates the
appearance of subretinal drusenoid deposits.
Abbreviations: SD-OCT, spectral domain optical coherence tomography; ARMD, age-related macular degeneration.
Figure 12 Fundus photograph (top) showing soft drusen in the left eye of a patient
with ARMD; the B-scan line on the fundus photograph has the same width as the
B-scan SD-OCT image (bottom) which demonstrates the appearance of soft drusen.
Abbreviations: SD-OCT, spectral domain optical coherence tomography; ARMD, age-related macular degeneration.
Figure 13 The B-scan line on the fundus photograph (top) has the same width as the B-scan SD-OCT image (bottom) demonstrating one area of geographic atrophy (blue arrow) surrounded by multiple subretinal drusenoid deposits (red arrows).
Abbreviation: SD-OCT, spectral domain optical coherence tomography.
Eye and Brain downloaded from https://www.dovepress.com/ by 118.70.13.36 on 22-Aug-2020
Dovepress
Zaharova and Sherman
B-scan SD-OCT reflectivity pattern
SD-OCT imaging reveals numerous hyper-reflective dots (red arrows) larger than the thickness of the PIL that appear to straddle through the PIL, extending into the inner and outer photoreceptor layer (Figure 14). SD-OCT shows with great precision their location anterior to the RPE. All retinal layers, including the RPE, PIL, and external limiting membrane are present and grossly intact, resulting in good visual acuity unless CD is present concomitant with FA.
Figure 15 shows SD-OCT image of a 6-year-old patient with FA. In comparison to the adult fundus shown in Figure 14, early FA appears to start as subretinal deposits between the PIL and the RPE layers (red arrow). The typical straddling through the PIL and extending into the inner and outer photoreceptor layer is likely to be associated with the longstanding FA deposition.
RPE migration and RPE atrophy
Fundus flavimaculatus (FF)/Stargardt disease
Stargardt disease is the most common juvenile macular dystro-phy, accounting for approximately 7% of all juvenile macular dystrophies.28 It can present with or without white-yellow
retinal deep lesions, that are called fundus flavimaculatus (FF). FF and Stargardt are variants of the same hereditary disease, sharing a similar genetic background.28 They are both
inher-ited as an autosomal recessive trait that is due to a mutation in the ABCA4 gene.28 The composition of the deposits is
pres-ently unknown, and they exhibit variable patterns and shapes of hyper-reflective material.28,29 Clinically they appear as deep
more-yellow-than-white ill-defined retinal lesions, commonly referred to as flecks in the literature.28,29 Even though they
appear similar to drusen deposits, FF flecks are more likely to have fishtail, rather than round shapes (Figure 16). Flecks can be localized in the perifoveal region or can be scattered throughout the posterior pole and mid-periphery.28,29
Figure 14 The B-scan line on the fundus photograph (top) has the same width as the B-scan SD-OCT image (bottom) demonstrating the appearance of white deposits (red arrows) in fundus albi.
Abbreviation: SD-OCT, spectral domain optical coherence tomography.
Figure 15 The B-scan line on the fundus photograph (top) has the same width as the B-scan SD-OCT image (bottom) demonstrating the appearance of early deposits in fundus albi (red arrow).
Abbreviation: SD-OCT, spectral domain optical coherence tomography.
Figure 16 Fundus photograph (top) showing white FF flecks in the left eye of a
patient with Stargardt disease; the B-scan line on the fundus photograph has the
same width as the B-scan SD-OCT image (bottom) demonstrating areas of RPE migration (red arrows) and areas of RPE dropout (blue arrows).
Abbreviations: SD-OCT, spectral domain optical coherence tomography; FF, fundus
flavimaculatus; RPE, retinal pigment epithelium.
Eye and Brain downloaded from https://www.dovepress.com/ by 118.70.13.36 on 22-Aug-2020
Dovepress SD-OCT in the diagnosis of white retinal lesions
B-scan SD-OCT reflectivity pattern
FF flecks appear very different from drusen deposits. RPE pigment migration (red arrows) to the inner retina is clearly observed (Figure 16), leaving areas of RPE dropout (blue arrows) consistent with a yellow-white appearance clinically. Up to date, there are no histology reports available of the composition of FF flecks, likely due to the fact that they represent areas of RPE dropout.
Bietti crystalline dystrophy (BCD)
Bietti crystalline dystrophy is an autosomal recessive retinal dystrophy characterized by a triad of glistening intrareti-nal crystals, RPE atrophy and hypertrophy, which is also known as tapetoretinal degeneration and choroidal sclero-sis.30 Crystal deposits have been reported to be composed
mainly of cholesterol or cholesterol ester with complex lipid inclusions.31 Mutation in the CYP4V2 gene was found
to be associated with BCD.31 This gene codes for a protein
involved in fatty acid metabolism.31 According to the recent
literature, BCD is associated with abnormally high levels of triglycerides and cholesterol storage in the body, though direct correlation to any specific systemic disease has not yet been established.31
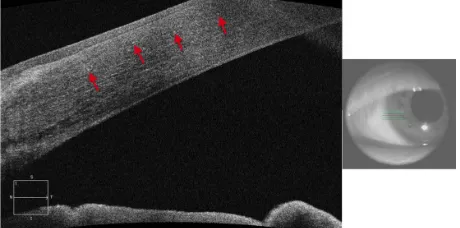
Clinically, BCD is characterized by the presence of min-ute crystal deposits scattered along the posterior pole and mid-periphery, retinitis pigmentosa-like pigment clumping, and atrophic appearing retina with easily visualized choroidal vasculature, which is also known as choroidal sclerosis (Figure 18). The literature also reports the presence of yellowish crystals in multiple types of cells, including choroidal fibroblasts, corneal keratocytes, and conjunctival and skin fibroblasts. Anterior segment OCT reveals hyper-reflective crystal deposits within the cornea at the limbus (Figure 17).
B-scan SD-OCT reflectivity pattern
Perhaps one of the most revealing characteristics of BCD is a complete absence of the PIL (Figure 18). A thin Bruch’s layer can be easily visualized due to the extreme RPE thin-ning. Small highly-reflective dots are seen on the anterior surface of Bruch’s membrane with more subtle hyper-reflective dots scattered throughout inner retinal layers (blue arrows).
Punctate inner choroidopathy (PIC)
PIC is a part of the White Dot Syndromes family, which is a group of disorders characterized by multiple whitish inflammatory lesions located at the level of the outer retina
and choroid.32,33 PIC normally affects young myopic women
between the ages of 20 to 45 years of age. It presents as small multifocal well-circumscribed hypopigmented and pigmented fibrotic scars often located in both eyes (Fig-ure 19). The color can be gray-white or yellow with a cuff of pigment at the level of the inner choroid and retinal pigment epithelium (RPE). It often resembles signs of ocular histo-plasmosis (POHS) and unless an active vitritis is present, it is often difficult to distinguish between the two diseases. In this paper, we will show how SD-OCT imaging can be used to differentiate between the two entities. When active, PIC can be symptomatic with blurred vision up to 20/200 and complaints of photopsia.
Figure 17 Anterior segment SD-OCT image demonstrating hyper-reflective crystals (red arrows) in the limbus area of the eye of a patient with Bietti crystalline dystrophy (BCD).
Abbreviation: SD-OCT, spectral domain optical coherence tomography.
Figure 18 Fundus photograph (top) showing BCD triad, glistening crystal deposits,
tapetoretinal degeneration and choroidal sclerosis, in the left eye of a patient with BCD; the B-scan line on the fundus photograph has the same width as the B-scan
SD-OCT image (bottom) demonstrating the appearance of crystalline deposits and
the absence of PiL and RPE layers.
Abbreviations: BDC, Bietti crystalline dystrophy; SD-OCT, spectral domain optical coherence tomography.
Eye and Brain downloaded from https://www.dovepress.com/ by 118.70.13.36 on 22-Aug-2020
Dovepress
Zaharova and Sherman
B-scan SD-OCT reflectivity pattern
SD-OCT shows a complete loss of all retinal layers at the level of white lesions (Figure 19). The RPE and PIL cannot be visualized, and even Bruch’s membrane and choriocapillaris are missing in the area of the defect. This finding is virtually pathognomonic of PIC. The SD-OCT image of POHS, on the other hand, differs significantly from PIC (Figure 20), showing elevated rather than atrophic RPE and PIL layers.
Figure 19 Fundus photographs (top) showing white lesions in the right eye of a patient with PIC; the B-scan line on the fundus photograph (top-left) has the same width as the B-scan SD-OCT image (bottom) demonstrating missing retinal layers
in the area of the lesion.
Abbreviations: PiC, punctate inner choroidopathy; SD-OCT, spectral domain optical coherence tomography.
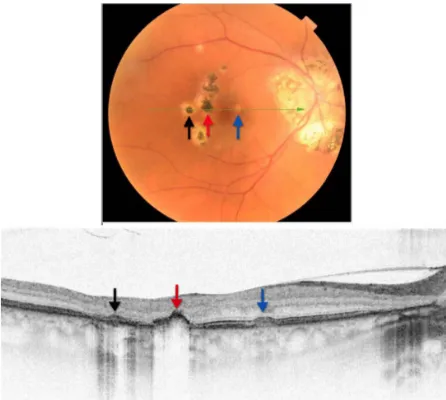
Figure 20 Fundus photograph (top) showing hypo- and hyper-pigmented lesions
in the right eye of a patient with POHS; the B-scan line on the fundus photograph
has the same width as the B-scan SD-OCT image (bottom) demonstrating the three
different types of lesions: the area of pigment deposition surrounded by the area of
RPE atrophy (black arrow), RPE migration (red arrow) and drusen-like apigmented pigment deposition (blue arrow).
Abbreviations: SD-OCT, spectral domain optical coherence tomography; RPE, retinal pigment epithelium; POHS, presumed ocular histoplasmosis.
Figure 21 The B-scan line on the fundus photograph (top) has the same width as the B-scan SD-OCT image (bottom) demonstrating the appearance of chorioretinal
atrophy.
Abbreviation: SD-OCT, spectral domain optical coherence tomography.
Figure 22 The B-scan line on the fundus photograph (top) has the same width as the B-scan SD-OCT image (bottom) demonstrating the appearance of osseous choristoma.
Abbreviation: SD-OCT, spectral domain optical coherence tomography.
Going from left to right, the B-scan through the three different types of chorioretinal lesions in POHS show the area of pigment deposition surrounded by the area of RPE atrophy (black arrow), RPE migration (red arrow), and drusen-like apigmented pigment deposition (blue arrow).
Eye and Brain downloaded from https://www.dovepress.com/ by 118.70.13.36 on 22-Aug-2020
Dovepress SD-OCT in the diagnosis of white retinal lesions
benign and silent nature of the tumor, no treatment is usually recommended. However, argon laser treatment can be used if choroidal neovascularization develops.34
B-scan SD-OCT reflectivity pattern
As Figure 22 shows, SD-OCT imaging of osseous choristoma reveals intact RPE, PIL, and external limiting membrane layers. Areas of thickened retina can be observed; however, no mass under the retina and no retinal atrophy is associated with osseous choristoma.
Conclusion
Retinal spots, dots, and other white lesions can often present a diagnostic challenge for clinicians. The aforementioned cases, summarized in Table 1, demonstrate the importance of SD-OCT in the identification of the unique B-scan SD-OCT reflectivity patterns of the presented retinal abnor-malities. SD-OCT is an ideal diagnostic tool to localize various deposits to a specific retinal layer, thus enhancing the differential diagnosis of retinal white dots and spots. Knowing how to interpret images of this remarkable technology can provide significant insight into characteristic features of these conditions often facilitating immediate diagnosis.
Table 1 Summary of B-scan SD-OCT reflectivity patterns of the presented dots, spots and other white retinal lesions
Condition SD-OCT reflectivity pattern Associated figure
Inner retinal lesions
MRNF Hyper-reflective thickened RNFL Figure 2
Cotton wool spots (CWS) Nodule-shaped hyper-reflective thickened area within the RNFL Figure 3
Outer retinal lesions
Hard exudates Hyper-reflective minute dots at the level of OPL Figure 4
Edema residues Hyper-reflective deposits within the photoreceptor outer segment layer Figure 8 RPE lesions/sub-RPE deposits
Cuticular hard drusen Discrete dome-shaped sub-RPE deposits; RPE is elevated; PiL is thinner, but present and intact
Figure 9
Infiltrative hard drusen Discrete sub-RPE deposits that infiltrate through the RPE and PIL; disrupted RPE and PIL Figure 10 Subretinal drusenoid deposits Punctuate deposits localized between the RPE and the PiL layers; RPE is not elevated;
intact RPE and PiL
Figure 11
Soft drusen Sub-RPE deposits; RPE is largely elevated; compromised PiL above the deposits; visualization of Bruch’s membrane
Figure 12
Geographical atrophy Localized absence of PiL and RPE layers; visualization of Bruch’s membrane Figure 13 Fundus albi Hyper-reflective deposits located anterior to RPE; straddling through the PIL; intact RPE
and PiL
Figure 14
RPE lesions/RPE migration and RPE atrophy
Fundus flavimaculatus RPE migration, leaving areas of RPE dropout Figure 16
Bietti crystalline dystrophy Hyper-reflective dots on top of Bruch’s membrane; complete absence of PIL; attenuated RPE; visualization of Bruch’s membrane
Figure 18
PiC Complete loss of all retinal layers, including Bruch’s membrane, at the level of white lesions Figure 19
POHS Pigment deposition; RPE migration and atrophy Figure 20
Post-PRP chorioretinal scar RPE atrophy, absence of PiL, visualization of Bruch’s membrane Figure 21 Osseous choristoma Thickened inner retina, intact RPE and PiL, no mass observed Figure 22
Abbreviations: MRNF, myelinated retinal nerve fiber layer; RNFL, retinal nerve fiber layer; OPL, outer plexiform layer; CWS, cotton wool spots; RPE, retinal pigment
epithelium; PiL, photoreceptor integrity line; PiC, punctate inner choroidopathy; POHS, presumed ocular histoplasmosis syndrome; PRP, pan-retinal photocoagulation.
Chorioretinal scar
Factored into the differential diagnosis of white retinal lesions is the atrophic chorioretinal scar. This case presents a patient who underwent sectoral pan-retinal photocoagulation (PRP) argon laser treatment of the left eye secondary to a polyploidal neovascular membrane. B-scan SD-OCT imaging revealed severe chorioretinal atrophy that resulted in complete absence of all retinal layers, including the RPE, PIL, and external limiting membrane (Figure 21).
Osseous choristoma
Osseous choristoma is defined as a congenital tumor con-sisting of ectopic osseous tissue in the choroid.34 It is more
prevalent in Caucasians and is reported more frequently in women than men. It is composed of bony trabeculae with numerous osteocytes and occasional osteoclasts.34
Fundo-scopically, osseous choristoma appears yellowish-white to sometimes reddish in color (Figure 22).34 It can be elevated
ranging from 0.5 to 2.00 mm elevation.35 The size ranges
from 1.5 × 2 DD to 9 × 15 DD.35 It has been reported that
RPE can show areas of depigmentation and areas of RPE clumping; whereas, retina overlying the tumor can show focal degeneration of outer segments.34 Given the relatively
Eye and Brain downloaded from https://www.dovepress.com/ by 118.70.13.36 on 22-Aug-2020
Eye and Brain
Publish your work in this journal
Submit your manuscript here: http://www.dovepress.com/eye-and-brain-journal
Eye and Brain is an international, peer-reviewed, open access journal focusing on clinical and experimental research in the field of neuro-ophthalmology. All aspects of patient care are addressed within the journal as well as basic research. Papers covering original research, basic science, clinical and epidemiological studies, reviews and
evaluations, guidelines, expert opinion and commentary, case reports and extended reports are welcome. The manuscript management system is completely online and includes a very quick and fair peer-review system, which is all easy to use. Visit http://www.dovepress.com/ testimonials.php to read real quotes from published authors.
Dovepress
Dove
press
Dove
press
Zaharova and Sherman
Disclosure
The authors report no conflicts of interest in this work.
References
1. Chen TC, Cense B, Pierce MC, et al. Spectral domain optical coher-ence tomography: ultra-high speed, ultra-high resolution ophthalmic
imaging. Arch Ophthalmol. 2005;123(12):1715–1720.
2. Alam S, Zawadzki RJ, Choi S, et al. Clinical application of rapid serial fourier-domain optical coherence tomography for macular imaging.
Ophthalmology. 2006;113(8):1425–1431.
3. Podoleanu AG. Optical coherence tomography. Br J Radiol. 2005;
78(935):976–988.
4. Kim JS, Ishikawa H, Gabriele ML, et al. Retinal nerve fiber layer thickness measurement comparability between time domain optical
coherence tomography (OCT) and spectral domain OCT. Invest
Ophthalmol Vis Sci. 2010;51(2):896–902.
5. Xi P, Mei K, Bräuler T, Zhou C, Ren Q. Evaluation of spectrometric
parameters in spectral-domain optical coherence tomography. Appl
Opt. 2011;50(3):366–372.
6. Watanabe Y, Itagaki T. Real-time display on Fourier domain optical coherence tomography system using a graphics processing unit.
J Biomed Opt. 2009;14(6):060506.
7. Srinivasan VJ, Adler DC, Chen Y, et al. Ultrahigh-speed optical coherence tomography for three-dimensional and en face imaging of the retina and optic nerve head. Invest Ophthalmol Vis Sci. 2008;49(11): 5103–5110.
8. Sarks SH, Arnold JK, Killingsworth MC, Sarks JP. Early drusen formation in the normal and aging eye and their relation to age related maculopathy; a clinicopathological study. Br J Ophthalmol. 1999; 83(3):358–368.
9. Wang M, Sander B, la Cour M, Larsen M. Clinical characteristics of subretinal deposits in central serous chorioretinopathy. Acta Ophthalmol Scand. 2005;83(6):691–696.
10. Sherman J, Yannuzzi LA, Madonna RJ, Nath S, Bababekova Y. The
Photoreceptor Integrity Line: As Revealed by Spectral Domain OCT. New York: Lulu.com; 2008.
11. Litts K, Messinger J, Sloan K, Spaide R, Curcio C. Sources of reflectivity in optical coherence tomography (OCT) of retina: candidates near the inner-outer segment (IS/OS) junction. Abstract 1322/A259.ARVO Conference; May 2, 2011; Fort Lauderdale, FL. Available at:
http://www.abstract-sonline.com/plan/ViewAbstract.aspx?mID=2684&sKey=
a9534887-8f0d-44c9-9838-df773b6c095b&cKey=
7f02ab5d-342b-430f-8-dc1-4e2bc2114dbb&mKey=
%7B6F224A2D-AF6A-4533-8BBB-6A8D7B26EDB3%7D. Accessed September 16, 2011.
12. Costa RA, Calucci D, Skaf M, et al. Optical coherence tomography 3: automatic delineation of the outer neural retinal boundary and its influ-ence on retinal thickness measurements. Invest Ophthalmol Vis Sci. 2004;45(7):2399–2406.
13. Ota M, Tsujikawa A, Murakami T, et al. Association between integrity of foveal photoreceptor layer and visual acuity in branch retinal vein
occlusion. Br J Ophthalmol. 2007;91(12):1644–1649.
14. Shin HJ, Chung H, Kim HC. Association between integrity of foveal
photoreceptor layer and visual outcome in retinal vein occlusion. Acta
Ophthalmol. 2011;89(1):e35–e40.
15. Tarabishy AB, Alexandrou TJ, Traboulsi EI. Syndrome of myelinated retinal nerve fibers, myopia, and amblyopia: a review. Surv Ophthalmol. 2007;52(6):588–596.
16. Arroyo JG. Cotton-wool spots may challenge diagnosis. Review of Opthalmology serial on the Internet: April, 2004 cited April 15, 2004. Available at: http://www.revophth.com/content/d/retinal_insider/ i/1332/c/25556/. Accessed April 10, 2011.
17. Gomez ML, Mojana F, Bartsch DU, Freeman WR. Imaging of
long-term retinal damage after resolved cotton wool spots. Ophthalmology.
2009;116(12):2407–2414.
18. Schmidt D. The mystery of cotton-wool spots – a review of recent and
historical descriptions. Eur J Med Res. 2008;24;13(6):231–266.
19. McLeod D. Why cotton wool spots should not be regarded as retinal
nerve fiber layer infarcts. Br J Ophthalmol. 2005;89(2):229–237.
20. Kanski JJ. Clinical Ophthalmology: A Systematic Approach. 5th ed.
Philadelphia, PA: Butterworth Heinemann Elsevier; 2007
21. Wang M, Munch IC, Hasler PW, Prünte C, Larsen M. Central serous
chorioretinopathy. Acta Ophthalmol. 2008;86(2):126–145.
22. Umeda S, Suzuki MT, Okamoto H, et al. Molecular composition of drusen and possible involvement of anti-retinal autoimmunity in two different forms of macular degeneration in cynomolgus monkey
(Macaca fascicularis). FASEB J. 2005;19(12):1683–1685.
23. Johnson PT, Lewis GP, Talaga KC, et al. Drusen-associated degeneration
in the retina. Invest Ophthalmol Vis Sci. 2003;44(10):4481–4488.
24. Spaide RF, Curcio CA. Drusen characterization with multimodal
imaging. Retina. 2010;30(9):1441–1454.
25. Hirose E, Inoue Y, Morimura H, et al. Mutations in the 11-cis retinol dehydrogenase gene in Japanese patients with Fundus albipunctatus.
Invest Ophthalmol Vis Sci. 2000;41(12):3933–3935.
26. Nakamura M, Hotta Y, Tanikawa A, Terasaki H, Miyake Y. A high associ-ation with cone dystrophy in Fundus albipunctatus caused by mutassoci-ations of
the RDH5 gene. Invest Ophthalmol Vis Sci. 2000;41(12):3925–3932.
27. Niwa Y, Kondo M, Ueno S, Nakamura M, Terasaki H, Miyake Y. Cone and rod dysfunction in fundus albipunctatus with RDH5 mutation:
an electrophysiological study. Invest Ophthalmol Vis Sci. 2005;
46(4):1480–1485.
28. Ergun E, Hermann B, Wirtitsch M, et al. Assessment of central visual function in Stargardt’s disease/fundus flavimaculatus with ultrahigh-resolution optical coherence tomography. Invest Ophthalmol Vis Sci. 2005;46(1):310–316.
29. Wirtitsch MG, Ergun E, Hermann B, et al. Ultrahigh resolution optical
coherence tomography in macular dystrophy. Am J Ophthalmol. 2005;
140(6):976–983.
30. Drenser K, Sarraf D, Jain A, Small KW. Crystalline retinopathies. Surv Ophthalmol. 2006;51(6):535–549.
31. Li A, Jiao X, Munier FL, et al. Bietti crystalline corneoretinal dystrophy
is caused by mutations in the novel gene CYP4V2. Am J Hum Genet.
2004;74(5):817–826.
32. Essex RW, Wong J, Fraser-Bell S, et al. Punctate inner choroidopathy: clinical features and outcomes. Arch Ophthalmol. 2010;128(8): 982–987.
33. Quillen DA, Davis JB, Gottlieb JL, et al. The white dot syndromes. Am
J Ophthalmol. 2004;137(3):538–550.
34. Kim BH, Henderson BA. Intraocular choristoma. Semin Ophthalmol.
2005;20(4):223–229.
35. Gass JD. New observations concerning choroidal osteomas. Int
Ophthalmol. 1979;1(2):71–84.
Eye and Brain downloaded from https://www.dovepress.com/ by 118.70.13.36 on 22-Aug-2020