*
Corresponding author: [email protected]
Fission Product Appearance Rate Coefficients in Design Basis
Source Term Determinations – Past and Present
Pedro B.Perez1,*andJohn N.Hamawi2 **
1
AREVA SAS, Lyon, France 2
AREVA INC, Marlborough, MA, U.S.A.
Abstract. Nuclear power plant radiation protection design features are based on radionuclide
source terms derived from conservative assumptions that envelope expected operating experience. Two parameters that significantly affect the radionuclide concentrations in the source term are failed fuel fraction and effective fission product appearance rate coefficients. Failed fuel fraction may be a regulatory based assumption such as in the U.S. Appearance rate coefficients are not specified in regulatory requirements, but have been referenced to experimental data that is over 50 years old. No doubt the source terms are conservative as demonstrated by operating experience that has included failed fuel, but it may be too conservative leading to over-designed shielding for normal operations as an example. Design basis source term methodologies for normal operations had not advanced until EPRI published in 2015 an updated ANSI/ANS 18.1 source term basis document. Our paper revisits the fission product appearance rate coefficients as applied in the derivation source terms following the original U.S. NRC NUREG-0017 methodology. New coefficients have been calculated based on recent EPRI results which demonstrate the conservatism in nuclear power plant shielding design.
1 Introduction
Nuclear power plant (NPP) occupational doses are maintained ALARA by both design and operating practices. Operating plant occupational collective doses have decreased over the years demonstrating ALARA is being successfully practiced. NPPs are designed with radiation protection requirements that reflect the ICRP three fundamental principles of radiation protection [1]:
x Justification,
x Optimization of Protection, and
x Application of Dose Limits
Optimization is an important part in establishing design requirements for NPP radiation protection features. The design process includes consideration of source term, system layout, shielding material selection and ambient dose equivalent rate targets.
The design basis shielding source term has a direct impact on the plant design and cost associated with construction and ultimately decommissioning. Bulk-wall shield thicknesses are derived from the source term and dose rate targets. The end result could be an over-sized shield for normal operations impacting building dimensions. This would also raise a question if
ALARA
resources were properly allocated in the design
.Shielding source terms are derived to envelope expected operating experience. Assumptions are selected
to be conservative and provide operational margins. Two variables that are particularly important are failed fuel fraction and fission product appearance rate coefficients. These two input variables significantly affect the radionuclide concentrations in the source term.
Failed fuel fraction may be a regulatory based assumption, such as the 0.25% in the U.S. Nuclear regulatory Commission (NRC) licensing basis [2] and [6]. Appearance rate coefficients are not specified as a regulatory requirement, but have been referenced to NUREG-0017 [3] in many U.S. Final Safety Analysis Reports (FSAR) and approved Design Certifications [4], as well as applications under review by the NRC.
Shielding methods have been improved over the years with exceptional advances in 3D Monte Carlo modelling capabilities. Yet the shielding design basis source terms did not advance at all over the past 50 years until EPRI published in December 2015 an updated ANSI/ANS 18.1 basis document [5]. New appearance rate coefficients can be derived from the recent EPRI data for current and future nuclear power plant shielding designs.
It should also be pointed out that failed fuel fraction assumption and fission product appearance rate coefficients are also applied in calculating initial source term for radiological consequences from design basis accidents. Another application is in the design of radioactive effluent processing systems. These examples are based on the U.S. NRC licensing basis; however,
other design applications may also benefit from an updated appearance rate coefficients.
2 Appearance Rate Coefficients
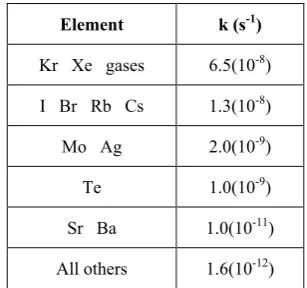
Fission product appearance rate coefficients express the transport of fission products from the fuel pellet to the reactor coolant. The physical processes have been studied experimentally and theoretically. Early work in the U.S. and Canada included perforated fuel rods operated in test loops, and fission products were measured in the coolant and purification media. Reference [8] is an example of the early work. These measurements and calculations provided a simplified “effective appearance rate” coefficient (k); that is fission product transfer from the pellet to the coolant including gap region interactions. These coefficients are publically documented in NUREG-0017 [3], for PWRs, and are provided in Table 1.
Table 1.NUREG-0017 PWR Appearance Rate Coefficients
Element k (s-1)
Kr Xe gases 6.5(10-8) I Br Rb Cs 1.3(10-8) Mo Ag 2.0(10-9)
Te 1.0(10-9)
Sr Ba 1.0(10-11) All others 1.6(10-12)
The coefficients (k) in Table 1 are called “effective” in the present work because they represent a single transfer mechanism. In fact, the symbol “k” is also used to avoid confusion with modern models.
Additional experiments and recent theoretical models have generally accepted that the fission product release rates involve two physical processes [9]:
x -1), and
x -1)
Experimentally, these two release rate coefficients can be individually measured. However, measurements in a commercial nuclear power plant can only provide radionuclide concentrations. This radiochemistry data along with fuel failure detection methodology can characterize the fuel rod damage.
3 RCS Source Terms
Multiple radiological source terms are used in a nuclear power plant design basis. The normal operations source term is often based on operating experience. ANSI/ANS 18.1 [10] has been the reference source term for U.S. plants. This source term, however, is outdated and reflects operating experience from early nuclear power plants. Recently EPRI has documented updated plant data reflecting improved fuel performance. Another source term is for shielding and following NRC guidance assumes a non-mechanistic 0.25% failed fuel fraction [6].
Other source terms used for accident analyses may also apply the appearance rates to establish an initial condition for reactor coolant concentrations [7]. Accident source terms are not treated in the present work.
Reactor coolant system (RCS) source terms used for shielding calculations are derived by applying a failed fuel fraction and effective appearance rate coefficients. A simplified expression is provided in ANSI/ANS 18.1 that is based on mass balance with radioactive decay:
Ci= Rii (1)
Where: Ci= concentration of ithnuclide (Bq/g),
Ri= release rate of ithnuclide (Bq/s),
M = coolant mass (g)
i= decay constant for ithnuclide (s-1)
thnuclide (s-1)
! !" # removal mechanism.
Release rate (Ri) in Equation (1) is the product of the
core inventory, failed fuel fraction and appearance rate coefficient. It is also referred to as the radionuclide appearance rate and is solved for all the fission products. Figure 1 provides a simplified diagram of a typical calculation with ELISA-2 [11].
Figure 1.Schematic of ELISA-2 Model
Source terms for shielding have been based on older appearance rate coefficients that may be too conservative. These are applied in conjunction with a non-mechanistic fuel failure fraction and can result in oversizing shielding. EPRI has recently published updated radionuclide concentrations from operating power plants. The data provides an opportunity to update the appearance rate coefficients and remain fully within the U.S. regulatory framework.
4 Updated Appearance Rate Coefficients
Appearance rate coefficients can now be re-evaluated. The EPRI report includes recent U.S. plant measured RCS concentrations and plant specific operating information. The raw data in the EPRI report was
Source (Bq) (Core)
Source injection rate:
Core Inventory × Appearance Rate Coefficient × Failed Fuel Fraction
(RCS) Volume (m3)
Mass (kg)
Coolant Purification Coolant Letdown Flow
obtained from the EPRI Chemistry Monitoring and Assessment Database that included over 60 PWR plants. Ten (10) plants were selected for use in updating ANSI/ANS 18.1.
The recommended RCS concentrations for the reference plant, along with the reference-plant specific variables (i.e., volumes, flow rates, filtration efficiencies, etc.) and the simplified model in Equation (1), were used
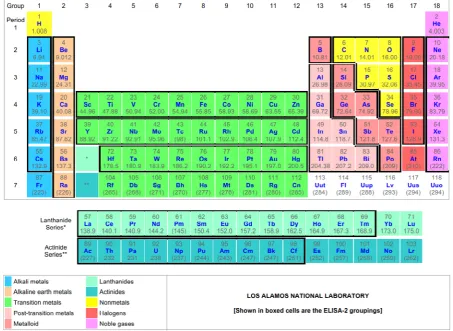
in this work with ELISA-2 to back calculate “effective” appearance rate coefficients consistent with NUREG-0017 [3]. The first step was to group the elements for input to ELISA-2 according to the breakdown of the Periodic Table of the Elements shown in Figure 2 (from Los Alamos). This grouping can be modified based on the application; for example, radiological consequences of design basis accidents.
Figure 2.ELISA-2 Element Grouping
The second step was to prepare an ELISA2 computer run with the model in Figure 1. The assumed failed fuel fraction is consistent with the NUREG-0017 assumption of 0.12% [3]. This failed fuel assumption is necessary for the following two reasons: First, it allows a comparison of effective appearance rate coefficients based on updating the source term. Second, there is no failed fuel fraction information in the EPRI report [5].
The RCS concentrations calculated were compared to the measured concentrations in the EPRI report [5]. The third and final step was to adjust the effective appearance rate coefficients to arrive at calculated-to-measured (C/M) ratios close to unity by iterative ELISA-2 analyses. Our approach is simple and fully within the NRC regulatory guidance in SRP 11.1 [2].
The final EPRI based effective appearance rate coefficients obtained from ELISA-2 analyses with an assumed failed fuel fraction of 0.12% are compared to the NUREG-0017 based values in Table 2. Elements in groupings represented by bold font in Table 2 can be directly compared to NUREG-0017 results (i.e., Table 1).
The updated appearance rate coefficients in Table 2 can now be applied to demonstrate the impact on design basis primary coolant source terms.
Example Applications
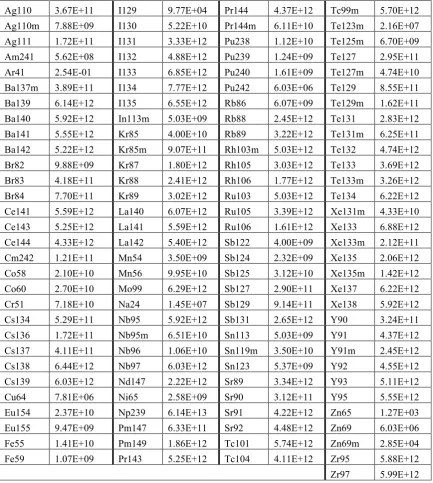
The updated appearance rate coefficients in Table 2 can now be applied to demonstrate the impact on design basis primary coolant source terms. The ELISA-2 model depicted in Figure 1 is next applied to the reference plant described in Reference [5]. A full-core inventory based on 3340 MW-thermal, 5% U-235, 3 cycles is generated through use of ORIGEN-ARP. Table 3 lists the core inventory.
Table 2.Appearance Rate Coefficients.
Element Grouping
NUREG-0017 ELISA-2
k (s-1)
Noble Gases
Ne Ar Kr Xe Rn 6.5(10
-8
) 6.7(10-10) Halogens
F Cl Br I 1.3(10
-8
) 3.1(10-10) Alkali Metals
Li Na K Rb Cs 1.3(10
-8
) 2.1(10-10) Alkali Earth Metals
Be Mg Ca Sr Ba Ra 1.0(10
-11
) 1.6(10-10)(a) Transition Metals – Grp 1
Sc Ti V Cr Mn Fe Co Ni Cu Zn 1.6(10
-12
) 1.5(10-8)(b) Transition Metals – Grp 2
Y Zr Nb Mo Tc Ru Rh Pd Ag Cd 2.0(10
-9
) 3.3(10-12) Transition Metals – Grp 3
Hf Ta W Re Os Ir Pt Au Hg 1.6(10
-12
) 3.3(10-12)(c) Post Transition Metals
Al Ga In Sn Tl Pb Bi 1.6(10
-12
) 9.2(10-10) Metaloids
B Si Ge As Sb Te Po 1.0(10
-9
) 1.6(10-10) Non-Metals
C N O P S Se 1.6(10
-12
) 1.6(10-10)(d) Lanthanides
La Ce Pr Nd Pm Sm Eu Gd Tb Dy Ho Er Tm 1.6(10
-12
) 3.3(10-12)(e) Actinides
Ac Th Pa U Np Pu Am Cm Bk Cf 1.6(10
-12
) 6.7(10-15)
(a) No data. Assumed to be the same as the Metaloid elements. Strontium and Barium elements are in the same group as Tellurium, per RG 1.183 [7].
(b) These are mostly activation products. The appearance rate coefficient is based on the calculated core inventory which includes structural-material activation. There is reasonably good comparison for all measured elements in this group.
(c) No data. Set the same as for Transition Metals Group 2.
(d) No data. Assumed to be the same as the Metaloid elements. Selenium is in the same group as Tellurium, per RG 1.183 [7].
Table 3.Core Inventory (MBq)
Ag110 3.67E+11 I129 9.77E+04 Pr144 4.37E+12 Tc99m 5.70E+12 Ag110m 7.88E+09 I130 5.22E+10 Pr144m 6.11E+10 Te123m 2.16E+07
Ag111 1.72E+11 I131 3.33E+12 Pu238 1.12E+10 Te125m 6.70E+09 Am241 5.62E+08 I132 4.88E+12 Pu239 1.24E+09 Te127 2.95E+11 Ar41 2.54E-01 I133 6.85E+12 Pu240 1.61E+09 Te127m 4.74E+10 Ba137m 3.89E+11 I134 7.77E+12 Pu242 6.03E+06 Te129 8.55E+11
Ba139 6.14E+12 I135 6.55E+12 Rb86 6.07E+09 Te129m 1.62E+11 Ba140 5.92E+12 In113m 5.03E+09 Rb88 2.45E+12 Te131 2.83E+12 Ba141 5.55E+12 Kr85 4.00E+10 Rb89 3.22E+12 Te131m 6.25E+11 Ba142 5.22E+12 Kr85m 9.07E+11 Rh103m 5.03E+12 Te132 4.74E+12
Br82 9.88E+09 Kr87 1.80E+12 Rh105 3.03E+12 Te133 3.69E+12 Br83 4.18E+11 Kr88 2.41E+12 Rh106 1.77E+12 Te133m 3.26E+12 Br84 7.70E+11 Kr89 3.02E+12 Ru103 5.03E+12 Te134 6.22E+12 Ce141 5.59E+12 La140 6.07E+12 Ru105 3.39E+12 Xe131m 4.33E+10
Ce143 5.25E+12 La141 5.59E+12 Ru106 1.61E+12 Xe133 6.88E+12 Ce144 4.33E+12 La142 5.40E+12 Sb122 4.00E+09 Xe133m 2.12E+11 Cm242 1.21E+11 Mn54 3.50E+09 Sb124 2.32E+09 Xe135 2.06E+12 Co58 2.10E+10 Mn56 9.95E+10 Sb125 3.12E+10 Xe135m 1.42E+12
Co60 2.70E+10 Mo99 6.29E+12 Sb127 2.90E+11 Xe137 6.22E+12 Cr51 7.18E+10 Na24 1.45E+07 Sb129 9.14E+11 Xe138 5.92E+12 Cs134 5.29E+11 Nb95 5.92E+12 Sb131 2.65E+12 Y90 3.24E+11 Cs136 1.72E+11 Nb95m 6.51E+10 Sn113 5.03E+09 Y91 4.37E+12
Cs137 4.11E+11 Nb96 1.06E+10 Sn119m 3.50E+10 Y91m 2.45E+12 Cs138 6.44E+12 Nb97 6.03E+12 Sn123 5.37E+09 Y92 4.55E+12 Cs139 6.03E+12 Nd147 2.22E+12 Sr89 3.34E+12 Y93 5.11E+12 Cu64 7.81E+06 Ni65 2.58E+09 Sr90 3.12E+11 Y95 5.55E+12
Eu154 2.37E+10 Np239 6.14E+13 Sr91 4.22E+12 Zn65 1.27E+03 Eu155 9.47E+09 Pm147 6.33E+11 Sr92 4.48E+12 Zn69 6.03E+06 Fe55 1.41E+10 Pm149 1.86E+12 Tc101 5.74E+12 Zn69m 2.85E+04 Fe59 1.07E+09 Pr143 5.25E+12 Tc104 4.11E+12 Zr95 5.88E+12
Table 4.RCS Concentration with Updated Appearance Rate Coefficients (Bq/m3)
Ag-110 2.15E+02 I-129 5.63E+00 Pr-144 2.66E+06 Tc-99m 3.13E+06 Ag-110m 4.84E+03 I-130 1.64E+06 Pr-144m 2.62E+04 Te-123m 6.41E+02 Ag-111 1.00E+05 I-131 1.83E+08 Pu-238 1.40E+01 Te-125m 2.00E+05 Am-241 7.03E-01 I-132 1.53E+08 Pu-239 1.55E+00 Te-127 8.26E+06 Ar-41 5.58E-06 I-133 2.68E+08 Pu-240 2.00E+00 Te-127m 1.42E+06 Ba-137m 1.51E+07 I-134 4.58E+07 Rb-86 2.32E+05 Te-129 1.10E+07 Ba-139 2.47E+07 I-135 1.47E+08 Rb-87 6.60E-07 Te-129m 4.80E+06 Ba-140 1.71E+08 In-113m 8.58E+05 Rb-88 8.28E+07 Te-131 8.75E+06
Ba-141 4.73E+06 Kr-85 2.61E+08 Rb-89 4.88E+06 Te-131m 1.39E+07 Ba-142 2.62E+06 Kr-85m 4.88E+07 Rh-103m 3.02E+06 Te-132 1.24E+08 Br-82 4.40E+05 Kr-87 2.76E+07 Rh-105 1.58E+06 Te-133 3.55E+06 Br-83 4.56E+06 Kr-88 8.24E+07 Rh-106 9.89E+05 Te-133m 7.97E+06 Br-84 2.17E+06 Kr-89 1.91E+06 Ru-103 3.05E+06 Te-134 1.17E+07 Ce-141 3.44E+06 La-140 3.78E+07 Ru-105 6.26E+05 Xe-131m 1.26E+08 Ce-143 2.46E+06 La-141 4.37E+06 Ru-106 9.89E+05 Xe-133 9.29E+09 Ce-144 2.66E+06 La-142 2.71E+06 Sb-122 1.03E+05 Xe-133m 1.44E+08 Cm-242 1.51E+02 Mn-54 9.75E+06 Sb-124 6.87E+04 Xe-135 4.63E+08 Co-58 5.82E+07 Mn-56 5.55E+07 Sb-125 9.28E+05 Xe-135m 4.39E+07
Co-60 7.54E+07 Mo-99 3.33E+06 Sb-127 7.77E+06 Xe-137 4.77E+06 Cr-51 1.97E+08 Na-24 3.36E+02 Sb-129 8.14E+06 Xe-138 1.68E+07 Cs-134 2.07E+07 Nb-95 3.63E+06 Sb-131 2.83E+06 Y-90 1.46E+06 Cs-136 6.49E+06 Nb-95m 3.99E+04 Sn-113 8.57E+05 Y-91 3.08E+06 Cs-137 1.60E+07 Nb-96 4.50E+03 Sn-119m 5.96E+06 Y-91m 3.28E+07 Cs-138 2.88E+07 Nb-97 2.43E+06 Sn-123 9.14E+05 Y-92 2.11E+07 Cs-139 3.47E+06 Nd-147 1.31E+06 Sr-89 9.88E+07 Y-93 1.55E+06 Cu-64 1.20E+04 Ni-65 1.41E+06 Sr-90 9.30E+06 Y-95 5.56E+04 Eu-154 1.46E+04 Np-239 6.46E+04 Sr-91 6.06E+07 Zn-65 3.54E+00 Eu-155 5.81E+03 Pm-147 3.89E+05 Sr-92 2.74E+07 Zn-69 1.44E+03
Table 5 provides the RCS photon spectra (MeV/sec-m3) for an RCS volume of 345.5 m3corresponding to all radionuclides including dissolved noble gases in Table 3. The RCS spectra in Table 4 can be used to demonstrate the different shielding requirements.
Table 5.RCS photon spectra (MeV/sec-m3) MeV NUREG ELISA-2 NUREG/ELISA2
0.01 4.18E+08 5.18E+06 80.6 0.025 3.74E+08 7.54E+06 49.7 0.0375 1.39E+10 1.50E+08 92.5 0.0575 1.12E+07 9.77E+05 11.4 0.0850 2.69E+10 2.89E+08 93.0
0.125 2.95E+08 3.04E+06 97.1 0.225 9.47E+09 1.62E+08 58.4 0.375 4.06E+09 9.91E+07 41.0 0.575 1.56E+10 4.47E+08 34.9 0.850 1.60E+10 4.75E+08 33.6 1.25 1.38E+10 5.50E+08 25.0 1.75 9.17E+09 2.35E+08 38.9 2.25 1.38E+10 1.77E+08 77.9 2.75 2.28E+09 3.33E+07 68.5 3.50 3.97E+08 5.86E+06 67.8
5.00 7.15E+07 7.65E+05 93.5
Figure 3 depicts a simple MicroShieldTM Point Kernel model of a vessel. This hypothetical tank is 500 cm long, 38 cm in radius with a wall thickness of 2 cm. The content will be RCS liquid with concentrations corresponding to 0.12% failed fuel fraction.
Figure 3.Shielding Model
The absorbed dose rate in air at 1 meter from the tank was calculated with the spectra in Table 5. Concrete shielding is placed between the source and receptor to
reduce the absorbed dose rate to less than 10 μGy/h. The difference in shield thickness is a direct impact on a nuclear power plant civil works. Table 6 presents the dose rate results.
Table 6.Absorbed Dose in Air
Concrete Shielding
Absorbed Dose (μGy/h) NUREG ELISA2
None 1528 40
15 cm 340 8
50 cm 8 0.2
The difference in calculated dose rate due to updating appearance rate coefficients is immediately noticed when comparing unshielded absorbed dose rate. The RCS source term based on the NUREG-0017 photon spectra is 3.8 times greater.
A concrete shield of 50 cm would be required to lower the absorbed dose to 8 μGy/h with the NUREG-0017 spectra. On the other hand, only 15 cm of concrete would be required with the updated design basis radionuclide appearance rates calculated with ELISA2 in this present work.
The difference in concrete volume is significant when considering the civil works in a nuclear power plant. This example demonstrates the importance of source term assumptions in the design of nuclear power plants and supports updating ANSI/ANS 18.1.
Radionuclide source terms are used in many areas of designing nuclear power plants. The appearance rate of radionuclides and failed fuel fraction are two important design inputs used to generate source terms such as the shielding 0.25% failed fuel fraction in the U.S.N.R.C. Appearance rate coefficients currently applied in design work have not been updated since NUREG-0017 [3] was published in 1976.
Appearance rate coefficients can now be updated from a recent EPRI report [5] following the NUREG-0017 methodology. The present work demonstrates appearance rate coefficients predicted assuming 0.12% failed fuel fraction are generally much lower in comparison to historical values. The new coefficients demonstrate the conservatism in nuclear power plant source terms for shielding designs.
Radiation protection design features will continue to be ALARA when based on updated appearance rate coefficients reflecting modern fuel performance. The updated methodology would reduce the risk of over-sized shielding for normal operations impacting building dimensions and construction cost as well as the cost associated with ultimately decommissioning the nuclear power plant.
References
1. ICRP, 2007. The 2007 Recommendations of the International Commission on Radiological Protection. ICRP Publication 103. Ann. ICRP 37 (2-4) (2007).
2. U.S. Nuclear Regulatory Commission, NUREG-0800, Section 11.1 (2016).
3. U.S. Nuclear Regulatory Commission, NUREG-0017, Revision 0 (1976).
4. Westinghouse AP1000 Design Control Document, Revision 19, Tier 2, Chapter 11, Radioactive Waste Management (2011).
5. EPRI-3002005404, Advanced Nuclear Technology: Reactor Coolant Radiological Source Terms for Normal Operations – Updated and Revised Methodology. EPRI, Palo Alto, CA (2015).
6. U.S. Nuclear Regulatory Commission, Regulatory Guide 8.8, Revision 3 (1978).
7. U.S. Nuclear Regulatory Commission, Regulatory Guide 1.183 (2000).
8. J.D. Eichenberg, et al, WAPD-183, Bettis Plant, United States Atomic Energy Commission (1957). 9. EPRI-1019107, Fuel Reliability Monitoring and
Failure Evaluation Handbook: Revision 2. EPRI, Palo Alto, CA (2010).
10. ANSI/ANS-18.1-1999, American Nuclear Society, Radioactive Source Term for Normal Operations of Light Water Reactors, an American National Standard (1999).