Scholarship@Western
Scholarship@Western
Electronic Thesis and Dissertation Repository
7-10-2013 12:00 AM
A Structured Conceptualization of Reasons to Accelerate: Words
A Structured Conceptualization of Reasons to Accelerate: Words
from the WISE
from the WISE
Lynn Dare
The University of Western Ontario Supervisor
Dr. Elizabeth Nowicki
The University of Western Ontario
Graduate Program in Education
A thesis submitted in partial fulfillment of the requirements for the degree in Master of Education
© Lynn Dare 2013
Follow this and additional works at: https://ir.lib.uwo.ca/etd Part of the Gifted Education Commons
Recommended Citation Recommended Citation
Dare, Lynn, "A Structured Conceptualization of Reasons to Accelerate: Words from the WISE" (2013). Electronic Thesis and Dissertation Repository. 1342.
https://ir.lib.uwo.ca/etd/1342
This Dissertation/Thesis is brought to you for free and open access by Scholarship@Western. It has been accepted for inclusion in Electronic Thesis and Dissertation Repository by an authorized administrator of
A STRUCTURED CONCEPTUALIZATION OF REASONS TO ACCELERATE: WORDS FROM THE WISE
by
Lynn Dare
Graduate Program in Education
A thesis submitted in partial fulfillment of the requirements for the degree of
Master of Education
The School of Graduate and Postdoctoral Studies The University of Western Ontario
London, Ontario, Canada
Abstract
Existing research indicates that carefully planned acceleration offers academic benefits
with little social or emotional risk to high-ability learners. However, acceleration is seldom
practiced and little is known about how students perceive acceleration. This study provides a
structured conceptualization of reasons why secondary students chose acceleration through
concurrent enrollment. Participants who were concurrently enrolled at Western University while
in their final year at high school completed a concept mapping exercise based on Trochim’s
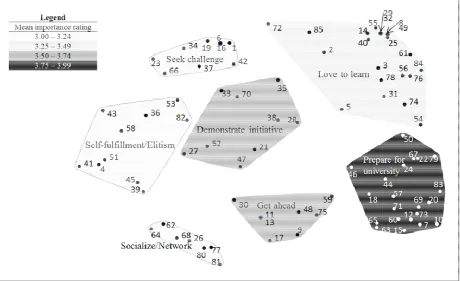
methodology. A seven cluster model provided the best graphical representation of reasons to
choose concurrent enrollment. Key concepts included (a) university preparation, (b)
demonstrating initiative, (c) getting ahead, (d) love of learning, (e) self-fulfilment/elitism, (f)
seeking challenge and (g) networking. Educational, research and concurrent enrollment program
implications are discussed.
Keywords: concurrent enrollment, Trochim’s concept mapping, structured conceptualization,
Acknowledgments
Heartfelt thanks to Dr. Elizabeth Nowicki for her supervision and support.
Table of Contents
Abstract ... i
Acknowledgments... ii
Table of Contents ... iii
List of Tables ... iv
List of Figures ... iv
List of Appendices ... iv
Chapter 1: Introduction and Literature Review ... 1
Programming for High-ability Learners ... 2
Foundations and Types of Acceleration ... 3
Background Research on Acceleration ... 8
Opportunities to Accelerate ... 8
Attitudes towards Acceleration and the Decision to Accelerate ... 9
Concurrent Enrollment ... 11
Self-Determination Theory ... 15
Summary of Study Rationale ... 17
Chapter 2: Program Description and Background on Study Methodology ... 19
Description of Western's Initiative for Scholarly Excellence ... 19
Program Evaluation ... 21
Background on Trochim’s Concept Mapping Methodology ... 22
Chapter 3: Method ... 28
Participants ... 28
Measures ... 28
Procedure ... 29
Chapter 4: Results ... 33
Multi-Dimensional Scaling: Point Map ... 33
Hierarchical Cluster Analysis: Cluster Map ... 37
Importance Ratings ... 44
Summary ... 48
Chapter 5: Discussion ... 49
Cluster One: Prepare for University ... 49
Cluster Two: Demonstrate Initiative ... 51
Cluster Three: Get Ahead ... 52
Cluster Four: Love to Learn ... 53
Cluster Five: Self-fulfillment/Elitism ... 54
Cluster Six: Seek Challenge ... 56
Cluster Seven: Network ... 57
Summary of Motivations Revealed through Cluster Analysis ... 58
Comparison of Study Findings to Benefits of Concurrent Enrollment Identified through the Literature Review ... 59
WISE Program Implications ... 63
Limitations ... 65
Future Research ... 66
Conclusion ... 68
References ... 69
Curriculum Vitae ... 96
List of Tables Table 1 Types of Acceleration... 6
Table 2 Steps in Trochim's Concept Mapping Process ... 25
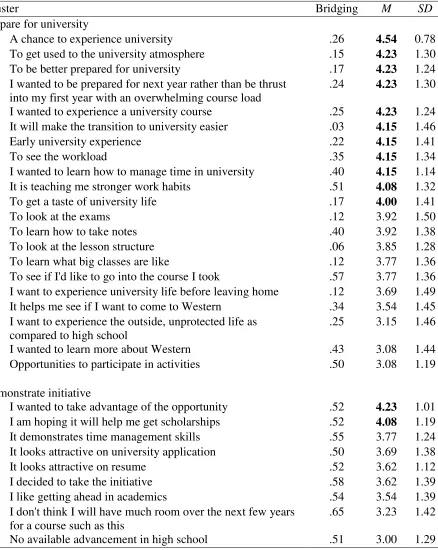
Table 3 Statements in Each Cluster, Statement Bridging Indices and Importance Ratings ... 41
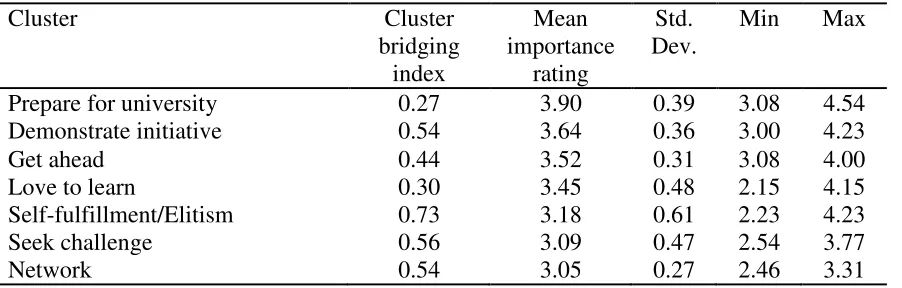
Table 4 Clusters and Cluster Importance Ratings ... 47
List of Figures Figure 1 Multidimensional scaling data point map ... 36
Figure 2 Trochim’s concept mapping seven cluster map ... 39
List of Appendices Appendix A: Ethics Approval ... 81
Appendix B: Letter of Information/Consent ... 83
Appendix C: Message from the WISE Program Coordinator ... 85
Appendix D: Ethics Approval Revision - September 26, 2011 ... 86
Appendix E: WISE Event Study Presentation ... 87
Appendix F: Group Similarity Matrix... 88
Appendix G: Statement Reference Numbers and Point Coordinates for Data Point Map ... 89
Appendix H: Cluster Merge Decision Log... 92
Chapter 1: Introduction and Literature Review
Over 100 years of research around the world has demonstrated that acceleration is the
most effective programming option to meet the unique educational needs of high-ability learners
(Colangelo, Assouline & Gross, 2004a). However, resistance towards acceleration remains
strong among educators (McCoach, & Siegle, 2007; Southern, Jones & Fiscus, 1989) and
misinformation about the practice persists (Smutny, Walker & Meckstroth, 2007; Wood,
Portman, Cigrand & Colangelo, 2010). As a result, acceleration is seldom implemented and often
controversial, especially so in Canada (Kanevsky, 2011b). Consequently, there is a paucity of
research involving accelerants in Canada and very few studies examine the practice from the
students’ perspective. To address this gap in the research and to provide feedback on a unique
accelerative program, this study engaged accelerated students in a structured conceptualization
process. Through Trochim’s concept mapping methodology (Trochim, 1989), high-ability
secondary students shared their motivations to self-select acceleration through concurrent
enrollment in university. The research question for this study was, “What reasons do high-ability
secondary students give for choosing acceleration?”
This thesis is divided into five chapters. Following this introductory chapter and literature
review, chapter two includes a description of the accelerative program from which study
participants are drawn and background to the study methodology. In chapter three I describe the
study method, including procedures and analysis. Results are presented in chapter four,
organized by major categories. Chapter five provides a discussion of the results, including study
limitations, implications for future research and implications for concurrent enrollment
The purpose of this study was to give voice to high-ability students who chose an
accelerative option known as concurrent enrollment. Through this literature review I will outline
the research on the educational practice of acceleration and demonstrate the gap that this study
addresses. To provide context, I will begin this introductory chapter by briefly discussing
programming options for high-ability learners. Next I will describe the basis for acceleration,
various types of acceleration and describe what we know about opportunities to accelerate. Then
I will discuss what the literature tells us about attitudes towards acceleration, review the type of
acceleration known as concurrent enrollment, and consider the applicability of
Self-Determination Theory to this study, concluding with a summary of the study rationale.
Programming for High-ability Learners
Various expressions such as “gifted”, “talented”, “creative” and “high-ability” are used to
describe people who are capable of high performance (Rogers, 2002; Steenbergen-Hu & Moon,
2011). In the past, “giftedness” was narrowly defined as high intellectual performance, and was
measured by using the top 2% as a cut-off score on traditional IQ tests (Winzer, 2002). Today, a
wider definition encompassing intellectual abilities, talents, and intrinsic motivation is
increasingly accepted within the field of education (Gottfried, Gottfried, Cook & Morris, 2005).
In this paper I have chosen to use the term “high-ability learner” because it focuses on the
potential of academically able students and it de-emphasizes restrictive definitions of giftedness
(Steenbergen-Hu & Moon, 2011). It is also a term that is well-accepted within the field of gifted
education. Furthermore, the term “high-ability” is most appropriate for any examination of
acceleration as a programming option. In fact, the National Work Group on Acceleration
gifted programming because students who do not fit narrow criteria for “giftedness” may still be
ideal candidates for acceleration (Colangelo et al., 2010).
It is well recognized among educators and educational researchers that high-ability
learners have special learning needs that differ from the learning needs of typical students. In
general, high-ability learners tend to be more curious, think more abstractly and learn at a faster
rate than their age-mates (Feldhusen, 1982; Winzer, 2002). Preferably, programming for these
students should provide opportunities to allow these students to reach optimum learning levels
(Edmunds & Edmunds, 2008; Feldhusen, 1982). Conversely, when the educational needs of
high-ability learners are not met they often experience frustration and boredom in school
(Colangelo et al., 2004a), a situation which can lead to disengagement (Olenchak, 1999). One
way to accommodate students who demonstrate ability to learn at a faster pace is through
acceleration (Colangelo et al., 2004a; Lubinski, 2004), a programming option that can take many
forms (Kanevsky, 2011b; Southern & Jones, 2004).
Foundations and Types of Acceleration
Pressey (1949, p. 2) defined acceleration as “progress through educational programs
either at rates faster than, or at ages younger than conventional”. More recently, the National
Association for Gifted Children (NAGC, 2004, para. 2) presented a refined definition, “allowing
a student to move through traditional educational organizations more rapidly, based on readiness
and motivation.” This definition reflects student-centred educational practice, taking into account
whether acceleration is a good fit for a student, and whether that student is motivated to learn at a
faster pace.
Programmed acceleration is geared towards the student’s capacity to learn (Southern &
to matching curriculum pace to ability, acceleration may help to avoid boredom by teaching
high-ability students “only what they don’t already know” (Stanley, 2000). For school systems
seeking programming options for high-ability students, acceleration can be a cost effective
alternative as it utilizes existing curricula and moves the student through the system more
quickly (King, 2012).
Some researchers label the practice of adjusting curriculum pace to match student
learning as appropriate developmental placement (Lubinski & Benbow, 2000) or
developmentally appropriate teaching practice (McConnaha, 1997) rather than acceleration.
Lubinski and Benbow (2000) argued that just as students who are developmentally delayed
require the pace of the curriculum be adjusted to their needs, high-ability students also deserve
appropriate placement. They applied the theory of work adjustment, a theory proposed for adults
in the work force, to students and their educational adjustment. According to theory of work
adjustment, educational adjustment involves competence and fulfillment. Competence, or the
degree of satisfactoriness, is governed by how well a student’s abilities fit the ability
requirements of the environment. Fulfillment, or satisfaction, occurs when personal needs
correspond to the rewards provided by the environment. When these two dimensions co-occur,
the person and environment act in harmony, a condition which fosters a long-lasting, stable
relationship.
According to theory of work adjustment, optimal development occurs in an educational
setting when students’ needs are met and their abilities are challenged (Lubinski & Benbow,
2000). The educational implications of theory of work adjustment suggest that educational
programming should seek a harmonious match between high-ability students and their learning
harmonious match can be achieved by modifying the curriculum according to students’ learning
preferences, including provision of accelerative options for high-ability students who are
motivated and ready for a quicker pace (Kanevsky, 2011a).
Although acceleration is often thought of as grade-skipping, in practice it can take many
forms which may be programmed singly or in combination (Rogers & Kimpston, 1992).
Southern and Jones (2004) defined eighteen types of acceleration, which may be classified as
content-based or grade-based (Kanevsky, 2011b). Table 1 provides a brief description of each of
these types. Typically, content-based acceleration involves increasing the rate at which new
material is presented, whereas grade-based acceleration involves moving students into settings
with older students. In practice, overlap exists between the two types depending on how the
acceleration is programmed. For example, Kanevsky (2011b) classified concurrent enrollment as
content-based acceleration, but this form of acceleration may involve the student taking courses
with older students. Accelerative options may be undertaken singly or in combination, and
students may engage in different types of acceleration over the course of their school career.
Before implementing any accelerative option, careful consideration of the individual
student and environment must be made. Decision-makers, including educators and parents, must
be mindful of the student’s academic profile, socio-emotional development and personal
preferences (NAGC, 2004). Ideally, decisions about acceleration should be informed by research
and reflect best-practices (Colangelo et al., 2010). In the next section, I will summarize two
meta-analyses of acceleration research and then describe opportunities to accelerate, before
Table 1
Types of Acceleration
Type of Acceleration Description
Content-based acceleration
Advanced placement Student takes standardized post-secondary courses,
generally offered through their high school
Concurrent enrollment Student is enrolled at one level, but takes a course at a
higher level
Correspondence courses Student takes advanced coursework beyond normal school
instruction
Credit by examination Student “challenges” a course for credit
Curriculum compacting Introductory, drill and practice activities are reduced
resulting in more instructional time for advanced content
Extracurricular programs Student takes courses outside of regular school hours
(evenings, weekends, summer programs).
International Baccalaureate
Programs
Interdisciplinary curriculum set by the International
Baccalaureate Organization, internationally recognized
Mentoring Student is paired with a mentor or expert tutor for advanced
instruction
Single-subject or subject
matter acceleration
For one or more subjects, student is either placed in classes
with older peers or works with materials from higher Grades
(Table 1 continued)
Type of Acceleration Description
Grade-based acceleration
Combined classes Often called “split grades”, students in two or more
consecutive grades are enrolled in one class
Continuous progress Student is given content according to own pace of progress
– results in acceleration when the student progresses more
rapidly through the material than his/her age mates
Early admission to
Kindergarten
Students enter Kindergarten at a younger than regular age
Early admission to Grade 1 Students enter Grade 1 at a younger than regular age
Early entrance to middle
school or high school
Student is moved ahead of chronological-age peers at
transition to middle or high school
Early graduation from high
school
Student graduates from high school in 3 ½ years or less;
may be accomplished by increased coursework, concurrent
enrollment, extracurricular and/or correspondence courses.
Grade-skipping Student is placed one full grade ahead of his/her age mates
at any time during his/her school career
Self-paced instruction Similar to continuous progress, but the student has control
over pacing decisions
Telescoping curriculum Similar to curriculum compacting, except reduced
Background Research on Acceleration
Many researchers have studied the educational practice of acceleration, resulting in
numerous quantitative studies on the effects of acceleration. In general, research has focused on
two areas of impact – academic achievement and social/emotional adjustment. Two
meta-analyses, written by prominent authors in the field of gifted education, are worthy of mention
because of the comprehensive summaries they provide. Colangelo et al. (2004b) examined
studies conducted between 1932 and 1991 and found that accelerants consistently out-performed
non-accelerants in measures of academic achievement (median Cohen’s effect size = 0.8). Social
and emotional measures, including educational plans, liking for school, participation in activities,
and self-acceptance/personal adjustment, tended to produce mixed but mostly small effect sizes
(from -0.41 to 0.77). More recently, Steenbergen-Hu and Moon (2011) examined 38 studies on
acceleration conducted between 1984 and 2008 and found positive effects for academic
achievement (Hedge’s g effect size = 0.396) and social-emotional adjustment (Hedge’s g effect
size = 0.141) comparing accelerated to non-accelerated same-age peers. Based on the research, it
can be strongly argued that high-ability students benefit from accelerative practices and that
acceleration options should be readily available. However, as discussed in the section below,
opportunities to accelerate remain scarce. Thus, the current study on how students view
concurrent enrollment offered insight into why learners actively choose this option.
Opportunities to Accelerate
Despite the research demonstrating positive academic outcomes for accelerants, few
opportunities to accelerate exist. In a recent nationwide survey, the first attempt to quantify
opportunities to accelerate across Canada, Kanevsky (2011b) examined to what extent different
for and practice of acceleration was found to be inconsistent, with boards tending to espouse
support for acceleration without having accelerants within their board. At the provincial level,
the Association for Bright Children (ABC) of Ontario surveyed school boards across Ontario on
their gifted education policies (ABC, 2011). Out of thirty respondents, only five school boards
had a policy on acceleration. ABC identified only one example of concurrent enrollment
available in Ontario: the Western Initiative for Scholarly Excellence (WISE) program. Taken
together, these findings indicate that programs actively supporting acceleration of high-ability
students are rare and therefore worthy of attention. Much can be learned from those who do
experience acceleration and it is especially valuable to conduct research in an environment where
such opportunities are infrequent. Participants for this study were drawn from WISE, a unique
accelerative program for high-ability secondary students.
In an educational environment where accelerative opportunities are proven to be
beneficial and yet remain rare, researchers have attempted to understand this discrepancy by
examining educators’ attitudes towards acceleration. Attitudes towards acceleration are relevant
to this study because recommendations about acceleration often originate from teachers (Rambo
& McCoach, 2012). A brief overview of research findings on attitudes towards acceleration is
presented in the following section, providing contextual background to the decision to accelerate.
Attitudes towards Acceleration and the Decision to Accelerate
High-ability students are a decidedly diverse group (Rogers, 2002). As mentioned,
decision-makers must seek the best possible match between the student and the accelerative
option when considering acceleration. Ideally, the decision to accelerate is made jointly by
parents, educators and the student, working together as a team to meet the best interests of the
acceleration inevitably play a role. Within the team, educators are often the source of information
about accelerative options - parents may turn to educators for information on educational options
for their high-ability child (Yoo & Moon, 2006) and conversely, educators may seek to involve
families in the planning process (Hertzog & Bennett, 2004).
Educators’ attitudes towards acceleration are well-documented (Bain, Bliss, Choate &
Brown, 2007; Rambo & McCoach, 2012; Southern, Jones & Fiscus,1989; Wood, Portman,
Cigrand & Colangelo, 2010) and generally reflect concern regarding social interactions and
socialization skills. These concerns persist despite research showing that acceleration has little
effect on social and emotional measures (Colangelo et al., 2004b; Steenbergen-Hu & Moon,
2011). Teachers’ skepticism toward acceleration can bias expectations for accelerants
(Hoogeveen, van Hell & Verhoeven, 2005) and influence the decision to accelerate (Rambo &
McCoach, 2012).
In the field of gifted education, few studies address the role of parents in their children’s
education (Moon, Kelly & Feldhusen, 1997; Morawska & Sanders, 2008). Although some
studies investigate the influence of family environment on high-ability children (Garn,,
Matthews & Jolly, 2010; Schilling, Sparfeldt & Rost, 2006; Sowa & May, 1997), I was unable to
locate a single study which systematically examined parents’ attitudes towards acceleration per
se.
My review of published research revealed that few studies have directly investigated
students’ attitudes towards acceleration, although some information on their attitudes may be
gleaned from the literature. One recent study with high-ability students in grades 3 to 8 (n = 416)
showed they rate acceleration as one of the most desirable practices in educational programming
learn with students who matched their pace in order to maintain a motivating, developmentally
appropriate level of challenge” (Kanevsky, 2011a, p. 295). In a 10-year longitudinal study
involving 320 profoundly gifted students, more than half (57%) took college courses while still
in high school (Lubinski et al., 2001). Most students (71%) expressed favourable attitudes
towards acceleration and among those who were dissatisfied with their accelerated studies most
wished they had more opportunities to accelerate. Although these studies suggest students hold
positive attitudes towards acceleration, they do not systematically analyze students’ specific
motivations to accelerate if given the option.
While it may be appropriate for educators and parents to make informed decisions on
behalf of younger children, involving students in educational decisions becomes increasingly
important as the student matures. Secondary students considering concurrent enrollment in
university are ideally situated to be active in the decision-making process as they prepare for
next steps after high school graduation. In the following sections, I will summarize existing
research on this particular type of acceleration.
Concurrent Enrollment
As previously mentioned, “concurrent enrollment” (or “dual enrollment”) means a
student is enrolled in two levels of schooling at the same time (Kanevsky, 2011b). For example,
when a student is working towards a university credit while simultaneously working towards a
high school diploma, s/he is concurrently enrolled in both high school and university and earning
separate credits at each level. In this study, I use the term concurrent enrollment to avoid
confusion with Ontario Ministry of Education dual credit programs. (Students enrolled in an
and college credit.) The literature review in this section culminates in a list of perceived benefits
of concurrent enrollment which will be compared to the findings of this study.
Concurrent enrollment differs from Advanced Placement and International Baccalaureate
accelerative programs for high-achieving secondary students in that concurrently enrolled
students take genuine university courses rather than courses designed for high school students
(Poelzer & Feldhusen, 1997). University courses are generally regarded to be at an academic
level above that offered in high school (McConnaha, 1997). Although some recent literature
describes state-subsidized dual enrollment programs implemented across the United States in
response to the No Child Left Behind Act of 2001 (Dodge, 2012; Dutkowsky, Evensky, &
Edmonds, 2006; Jordan, 2001), these studies do not address programs for high-ability students.
In fact, very few studies have systematically investigated concurrent enrollment for this
population (Rogers, 2008; Swanson, 2010). Kanevsky’s (2011b) study on policies and practices
provides some insight into the lack of research on this topic.
In her survey of acceleration practices in Canada, Kanevsky (2011b) found just over one
quarter (26.1%) of school boards across the country reported students participated in concurrent
enrollment in the 2006-2007 school year. Among provinces with more than 150,000 students,
participation rates varied between 5.9% in Quebec to 53.1% in British Columbia. Ontario had the
second highest participation rate with one out of three (29%) school boards having at least one
student concurrently enrolled during the school year. However, these rates may not be truly
representative. The overall survey response rate was 44.5%, meaning less than half of all school
boards responded, and the researchers suggested that those who did respond “represented the
districts that were most actively engaged in acceleration” (Kanevsky, 2011b, p. 173). Also,
participated in that form of acceleration. Perhaps the paucity of research is a reflection of the
rarity of concurrent enrollment practices. The current study begins to address this gap in the
literature.
Among the published research, I did find two studies involving primary research on
concurrent enrollment for high-ability students. Wolf and Geiger (1986) surveyed students,
parents and high school counsellors at three U.S. universities to assess experiences with
concurrent enrollment. Among responses from 212 study participants, the two reasons most often
given for participating in concurrent enrollment were “to reduce boredom in high school” and “to
get a head start in college”. In considering the study results, Wolf and Geiger (1986) noted three
strengths; concurrent enrollment: (a) gives high school students access to a wider variety of
courses, (b) offers an alternative way to meet the needs of high achieving students, and (c)
provides an opportunity for improved communication between school systems and
post-secondary institutions.
The second study I found on concurrent enrollment for high-ability students was
qualitative, comprising semi-structured interviews with 20 students in a previously
undocumented dual enrollment program at the University of Chicago (McConnaha, 1997). The
study aimed to provide a psychoeducational profile of students in the program. Results showed
dually enrolled students were highly motivated and had positive attitudes and self-concepts.
However, further investigation is needed to reveal precise motivations for these students to
engage in concurrent enrollment.
An examination of the broader literature base, including discussion papers on the move
toward dual enrollment in the U.S. (Dodge, 2012; Dutkowsky, Evensky, & Edmonds, 2006;
schools and students involved in concurrent enrollment programs. Among post-secondary
institutions, these programs can “acquaint high school students with the university” (Wolf &
Geiger, 1986, p. 220). Universities may utilize this relationship-building with prospective
applicants as a recruitment strategy. At the secondary school level, high schools may seek out
concurrent enrollment programs to expand the range of educational opportunities they can offer
their highly able students (Karnes & Chavin, 1982). Most relevant to this study are benefits to
students. Identified benefits include the following:
• exposure to more challenging, advanced curriculum content (Rogers, 2002)
• opportunity to engage in a wider range of academic courses than available through
the local high school (Dodge, 2012; Karnes & Chauvin, 1982; Wolf & Geiger, 1986)
• opportunity to pursue specific academic areas of interest in greater depth (Rogers,
2002)
• exposure to university life helps familiarize students the with demands and
expectations of university level work (Wolf & Geiger, 1986)
• shorter length of time spent in post-secondary education due to earning university
credits while still in high school (McConnaha, 1997)
By comparing these identified benefits to students’ reasons for participating in WISE, we
can determine whether participants in this study viewed these posited ideas as important benefits.
In considering the factors that influence reasons to accelerate, one further piece of the
puzzle is the link between high-achievers and motivation. Motivation theory forms a useful
conceptual framework to understand what drives people to do the things they do. In the
following section, I will review self-determination theory and describe how it applies to this
Self-Determination Theory
There are several theories and models of motivation (e.g. expectancy-value theory, goal
theory, attribution theory), the most current are based upon a cognitive view that assumes
individuals have a conscious awareness when making choices about their behavior
(Clinkenbeard, 2012). I have chosen Deci and Ryan’s (1985) self-determination theory to guide
this study because it has been thoroughly researched within the field of education (e.g. Niemiec
et al, 2006; Patrick, Skinner & Connell, 1993; Roth, Assor, Niemiec, P., Ryan & Deci, 2009;
Ryan, Stiller & Lynch, 1994) and it describes the supports necessary to foster the self-determined
motivation (Clinkenbeard, 2012) that has been linked to academic achievement (Gottfried,
Gottfried, Cook & Morris, 2005; Vallerand, Gagné, Senécal & Pelletier, 1994.) When applied to
education, self-determination theory is concerned with the factors that promote in students
“genuine enthusiasm for learning and accomplishment and a sense of volitional involvement in
the educational enterprise” (Deci, Vallerand, Pelletier & Ryan, 1991, p. 325). Therefore,
self-determination theory provides a suitable framework for this study of volitional involvement in
concurrent enrollment. Self-determination theory describes two basic types of motivation:
intrinsic and extrinsic. Intrinsic motivation comes from internal interest or enjoyment in a task
whereas extrinsic motivation is dependent upon the performance of the task for reward or
outcome (Garn, Matthews & Jolly, 2010). In this study, an example of intrinsic motivation would
be a student spending leisure time on academic work for pure enjoyment. In contrast, an example
of extrinsic motivation would be a student engaging in a course because it is free. Educators
recognize intrinsic motivation as an important phenomenon because it “results in high-quality
Research with high-achieving students has found that, in general, they score higher on
measures of academic intrinsic motivation than cohort comparison groups. In a longitudinal
study with 104 students, Gottfried, Gottfried, Cook and Morris (2005) compared adolescents
with high academic motivation to a cohort comparison group and found that those with high
academic motivation had higher math and reading achievement on Woodcock-Johnson
standardized tests and higher grade point average in high school. Vallerand, Gagné, Senécal and
Pelletier (1994) compared intrinsic motivation of gifted and regular elementary students (n =
135) using Harter’s Intrinsic/Extrinsic Orientation Scale. Gifted students showed higher levels of
intrinsic motivation than the comparison group. Taken together, these results gave rise to the
expectation that participants in this study, high-achieving students who self-select acceleration,
were likely to cite reasons that stem from intrinsic motivations for their participation in
concurrent enrolment.
The division between intrinsic and extrinsic motivations is a high-level distinction, based
on whether behaviour is undertaken because an activity is inherently interesting (intrinsic) or has
a separate consequence (extrinsic). Self-determination theory expands this division by proposing
various sub-types of extrinsic motivation which vary in degree of autonomy (Ryan & Deci,
2000). In this view, extrinsic motivation exists along a continuum. At the lowest level of
autonomy, behaviour is externally regulated and prompted by external reward, such as free
tuition. At the highest level of autonomy, reasons for externally rewarded behaviour become
internalized. The person acts for external reasons that are integrated into that individual’s set of
goals based on values and needs. To give a contextual example, a student who engages in
educational activities because s/he believes it to be valuable for his/her chosen career is
Deci, 2000). Self-determined extrinsic motivation is the most desirable form of extrinsic
motivation and, like intrinsic motivation, it is autonomous and without conflicting emotions
(Ryan & Deci, 2000). It remains distinct from intrinsic motivations because the behaviour is
performed because of its “presumed instrumental value with respect to some outcome that is
separate from the behaviour” (Ryan & Deci, 2000, p. 62).
Self-determination theory proposes that three conditions promote the development of
self-determined motivation: (a) autonomy, the need to feel a measure of control, (b) competence,
the need to feel capable within an environment, and (c) relatedness, the need to feel connected
with others (Deci & Ryan, 1985). According to self-determination theory, social environment
can reinforce or impede tendencies toward engagement and growth depending upon whether the
three basic psychological needs are met. We can see a correspondence of ideal conditions
described by self-determination theory and theory of work adjustment. Recall, theory of work
adjustment proposes that an environment which fosters competence and fulfillment leads to
positive educational adjustment. Self-determination theory proposes that a confluence of
autonomy, competence and relatedness supports the intrinsic motivation that research has shown
to be related to high-achievement. In short, competence is a key factor in fostering both positive
adjustment and intrinsic motivation. These theories guide our understanding of the current study
results, by framing the findings in terms of the conditions necessary for an ideal educational
environment.
Summary of Study Rationale
A review of the research to date revealed the following ideas. High-ability students have
special needs which should be met through learner-centered programming. Acceleration is one
sub-types of acceleration varies, with few studies focused on university-level concurrent
enrollment for high-ability students (Karp, Calcagno, Hughes, Jeong & Bailey, 2007; Swanson,
2010). Key stakeholders in the decision to accelerate are educators, parents and the students
themselves. Although some studies have investigated educators’ attitudes towards acceleration
(Bain, Bliss, Choate & Brown, 2007; Southern et al., 1989; Wood, Portman, Cigrand &
Colangelo, 2010), I was unable to find a study that gave voice to students’ reasons for choosing
to accelerate. Therefore, it is appropriate that a study of students’ reasons for self-selecting
acceleration be conducted. These reasons will then be compared to the proposed benefits of
concurrent enrollment revealed through this literature review, framed within self-determination
theory (Deci & Ryan, 1985) and theory of work adjustment (Lubinski & Benbow, 2000).
The primary purpose of this study was to better understand the phenomenon of
concurrent enrollment from the students’ perspective and give voice to students who have chosen
this accelerative option. The findings illustrate what attracts high-ability learners to engage in
concurrent enrollment. Also, this study provides a graphical representation of reasons to choose
concurrent enrollment which may contribute to the development of programs for high-ability
secondary students. Program planners at Western and other post-secondary institutions can use
this information to develop programs that respond to the needs of high-ability students.
As the WISE program has no prior formal evaluation, this study served a secondary
purpose; the resulting framework of participants’ expectations identified the most attractive
aspects of the program. This framework can be used in program planning and development and
forms a baseline evaluation of participants’ needs. This evaluative component of the study is
Chapter 2: Program Description and Background on Study Methodology
Given the scant research in the area of concurrent enrollment for high-ability students, an
examination of the Western Initiative for Scholarly Excellence (WISE) program provided an
excellent opportunity to add to our understanding of this type of acceleration. In this chapter I
will provide background on the WISE program and program entry requirements to illustrate the
sample frame for this study. Next I will give a brief overview of program evaluation and its
applicability to this study. This chapter concludes with a review of the study methodology,
Trochim’s concept mapping.
Description of Western's Initiative for Scholarly Excellence
Since 1979, Western University has offered a unique accelerative option to high school
students – the WISE program. This program gives high achieving students in grades 11 and 12
the opportunity to take one university course while still enrolled in high school. Kanevsky
(2011b) categorized this type of acceleration as concurrent enrollment. The program accepts up
to 100 applicants each academic year and in 2012-2013, ninety-five students participated. A
program coordinator provides one-on-one advice to students who apply to and participate in the
program. In addition to completing a university credit, WISE students can meet other program
participants and connect with the university through various WISE social events. The WISE
program coordinator organizes and manages these events.
To qualify for the WISE program, students must be full-time secondary students working
towards completion of their Ontario Secondary School Diploma (OSSD), with a minimum of 22
credits completed. Students must have at least an 85% average in Grades 10 and 11 if they have
not taken any Grade 12 courses; if they have one or more Grade 12 university preparation
be nominated by a principal, guidance counsellor or teacher at their secondary school and be
registered in sufficient courses to fulfill university admission requirements. In the context of this
study, participants in the WISE program have demonstrated high-ability because they fit the
criteria for acceptance into WISE. To be clear, WISE students form a subset of high-ability
learners; their high achievement demonstrates high-ability. It should be noted that some learners
identified within the educational system as high-ability students do not reach the achievement
levels demonstrated by WISE students, and the subset of high-ability, lower achievement
learners is not represented in this study.
The university does not charge tuition fees for courses taken through the WISE program;
in other words, participation in the program is free and students can earn a university credit
without charge. WISE students select a university course from the range of options offered to
regular first-year university students. Upon successful completion the course credit is added to
the participating student’s university transcript. This credit may be applied towards a degree at
Western or transferred to another post-secondary institution. WISE students may take courses on
campus or through distance education, although the majority of WISE students live within
commuting distance of Western’s campus in London, Ontario. In consultation with teachers,
parents, and the WISE coordinator, students self-select this accelerative option. The importance
of educators’ attitudes towards acceleration cannot be over-emphasized, as they play a key role
in making accelerative decisions (Wood, Portman, Cigrand & Colangelo, 2010). Furthermore,
educators are the gatekeepers for accelerants who require permission to accelerate; nomination
by an educator is a requirement for entry into the WISE program. It is conceivable that some
Despite the longevity of the WISE program, now entering its thirty-fourth year, and its
popularity evidenced by high enrollment numbers, the WISE program has had no formal
evaluation. Therefore the opportunity to gather information on acceleration from program
participants served a two-fold purpose: to explore students’ attitudes towards concurrent
enrollment and to provide evaluative feedback to the program coordinator.
Program Evaluation
Program evaluation and academic research share the same research techniques (Vogt,
2007) meaning it is both possible and practical to combine academic research and evaluation
within the same study. Evaluators and researchers regularly use the same data collection tools,
such as document review, surveys, and interviews, and their corresponding analyses. Indeed, the
line the between evaluation and research is fuzzy and hinges more on the intended audience and
use of study findings than the techniques involved. In this study, participants were drawn
exclusively from the WISE program, so the findings are useful to both research and evaluation
audiences.
Program evaluation seeks to determine what a program does, how it does it and whether
the outcomes are feasible, effective and intended. Broadly speaking, program evaluation may be
categorized as formative or summative, depending on whether the evaluation centres on
processes of the program or program outcomes respectively. Within those broad categories,
sub-types of evaluation relate to the focus or purpose of the work. Formative evaluation includes the
following: needs assessment, evaluability assessment, structured conceptualization,
implementation and process evaluations (Trochim, 2006). Summative evaluation includes the
following: outcomes, impacts, cost-benefit analysis, secondary analysis and meta-analysis. The
When applied to program evaluation, structured conceptualization can assist stakeholders
to “define the program or technology, the target population, and the possible outcomes”
(Trochim, 2006). Simply put, the evaluator seeks to understand how a group perceives the
phenomenon under investigation (Trochim, 1989). In this study, I sought to understand the many
and various reasons that high-ability students have for participating in the WISE program. One
way to accomplish this conceptualization was through Trochim’s concept mapping. In the
following section I will describe this methodological approach in detail.
Background on Trochim’s Concept Mapping Methodology
Within the field of gifted education, researchers have used quantitative measures of
academic achievement and social/emotional effects to examine the impact of acceleration.
Indeed, sufficient evidence has been collected on these two dimensions to justify the
meta-analytic studies described in chapter one (Colangelo et al., 2004b; Steenbergen-Hu & Moon,
2011). Data on attitudes toward acceleration has been systematically collected from educators
and counselors using survey methodologies (Bain, Bliss, Choate & Brown, 2007; Southern et al.,
1989; Wood, Portman, Cigrand & Colangelo, 2010); however, little is known about parents’ and
students’ attitudes towards acceleration (L. Kanevsky, personal communication, February 22,
2013). Among various types of acceleration, research into concurrent enrollment has tended to
focus on dual enrollment programs for at-risk students and further research into concurrent
enrollment for high-ability learners is warranted. Therefore, to examine how accelerants viewed
concurrent enrollment, I needed a methodology that was appropriate for exploratory studies and
that gave voice to the students. Ideally, a qualitative approach would allow students to share
opinions in their own words but I also wanted a methodology that supported rigorous analysis.
generation and data organization, and so is particularly well suited to the research question in this
study. In the following sections, I will describe the strengths of Trochim’s concept mapping,
provide examples of Trochim’s concept mapping studies, and outline the steps involved.
Many researchers have recognised the unique strengths of Trochim’s concept mapping as
a participatory, mixed method approach and it has been used extensively in exploratory research
applications (Cousineau, Franko, Ciccazzo, Goldstein & Rosenthal, 2006; Daughtry & Kunkel,
1993; Goodyear, 2002; Poole & Davis, 2006). It is generally acknowledged that qualitative
approaches provide openness and flexibility, attributes that are well suited to areas of new
research. Trochim’s concept mapping is ideal in exploratory studies such as this investigation
because of the highly adaptable approach to gathering participants’ unrestrained input.
Participants actively contribute ideas in their own words and then organize those ideas through
sorting and rating activities (Kane & Trochim, 2007). The researcher facilitates data generation
and organization, then completes statistical analyses resulting in a graphical representation of the
conceptualization. According to Kunkel et al. (1999, p. 196), Trochim’s concept mapping is
especially useful in exploratory studies because “it seeks for conceptual rather than statistical
significance and for meaning rather than necessary generalizability”. Trochim’s concept
mapping’s systematic, participatory approach means it is well-adapted to social research (Rosas
& Kane, 2012; Sutherland & Katz, 2005).
Within social research, Trochim’s concept mapping is widely used in the areas of health
and social work (Rosas & Kane, 2012) and is also applicable to educational research (Everall,
Truscott & Paulson, 1999; Trudeau et al., 2011). In one educational application, Kunkel, Chapa,
Patterson and Walling (1995) conducted Trochim’s concept mapping with students in Grade 7, 8
Trochim’s concept mapping has also been used with students in Grades 10 and 12 to facilitate
the development of a conceptual framework used in program planning, development and
evaluation for the Manitoba School Improvement Program (Sutherland & Katz, 2005). In another
example, Daughtry and Kunkel (1993) completed a Trochim’s concept mapping study with
college age students to understand their experiences of depression. Trochim’s concept mapping
has been used in both large and small scale projects (Rosas & Kane, 2012) and could
accommodate as many participants as are currently enrolled in the WISE program. Alternatively,
as was the case in this study, the results of Trochim’s concept mapping are equally valid with a
smaller group of volunteer participants.
The typical concept mapping process can be broken down into six steps, shown in Table
2 (Trochim, 1989). The first step, project preparation, involves selecting participants and
developing a focus for the data collected through brainstorming and rating. In step 2, participants
brainstorm statements and the researcher then edits the raw statements for uniqueness and clarity.
In step 3, participants structure the data by sorting the generated ideas into categories, and also
rating those ideas along specified dimensions appropriate to the study. At step 4, the researcher
applies mathematical analyses to the structured data, resulting in clusters of ideas and averaged
ratings. Next, the clusters are defined and labeled, a process which may be completed by the
research team and/or may involve the participants. In the final step, the researcher creates visual
displays of the data such as cluster and rating maps. Through completion of these six steps,
Trochim’s concept mapping provides statistically based graphs and charts which illustrate
Table 2
Steps in Trochim's Concept Mapping Process
Step Activities
1. Prepare Project • Select participants
• Develop focus for brainstorming and rating
2. Generate Ideas • Brainstorm statements
• Edit statements for clarity and to eliminate
duplication
3. Structure Ideas • Sort statements
• Rate statements
4. Concept Mapping Analysis • Analyze data (multidimensional scaling,
hierarchical cluster analysis, and average ratings)
5. Label Concepts • Define clusters and add labels
6. Create Maps • Create visual displays as appropriate (point map,
Although the final concept maps are a result of a well-defined process, Trochim’s
concept mapping data collection steps are highly flexible. In early studies, Trochim (1989)
collected data through focus groups; more recently Trochim’s concept mapping has been applied
to the analysis of open-ended survey responses (Jackson & Trochim, 2002), email responses
(Borner, Glahn, Stoyanov, Kalz & Specht, 2010; Stoyanov & Kirschner, 2004), and individual
written responses (Kunkel, Chapa, Patterson & Walling, 1995; Petrucci & Quinlan, 2007). In this
study, Trochim’s concept mapping’s flexibility was utilized to provide multiple ways to
participate. Trochim’s concept mapping is also flexible in the sorting and rating step; participants
can complete sorting and rating activities in focus group settings, in individual interviews, or
online. Again, an adaptable approach was preferred for this study to accommodate participants
who were geographically dispersed and had busy schedules.
The Trochim’s concept mapping approach to data collection and analysis offers several
relevant benefits. In Trochim’s concept mapping, participants brainstorm responses to a focus
prompt, increasing the likelihood that the data reflects participants’ unconstrained range of
experiences with a phenomenon (Kunkel, Chapa, Patterson & Walling, 1995). Students’
motivations to self-select concurrent enrollment were wide-ranging and differed from person to
person, so this methodology allowed individuals to offer their own unique suggestions, rather
than respond to ideas emanating from the researcher via structured surveys. Grouping and rating
of the data was also performed by participants. Thus the final conceptualization was based upon
multiple participants’ perceptions about the complete set of ideas, rather than an external
analyst’s interpretation of the data. A traditional approach to analyzing qualitative data would
involve the analyst reading through the statements, identifying ideas and coding similar ideas
In Trochim’s concept mapping, each participant offers his or her own interpretation of how the
complete set of ideas group together and these interpretations are then mathematically overlaid
using statistical techniques to produce one conceptualization for the group. In this way,
Trochim’s concept mapping results in findings that closely echo the voice of the group and the
statistical analyses lend an air of robustness to the data interpretation.
In addition to exploratory studies (Borner, Glahn, Stoyanov, Kalz & Specht, 2010;
Brown, 2004; Brown, Sigvaldason & Bednar, 2004; Daughtry & Kunkel, 1993; Kunkel, Chapa,
Patterson & Walling, 1995; Ries, Voorhees, Gittelsohn, Roche & Astone, 2008), Trochim’s
concept mapping has been used in numerous program evaluations (Ridings et al., 2011;
Sutherland & Katz, 2005; Trochim, Cook & Setze, 1994; Trochim, Marcus, Masse, Moser &
Weld, 2008; Trudeau et al., 2011; Yampolskaya, Nesman, Hernandez & Koch, 2004) and so
Chapter 3: Method
Participants
All participants in this study were high-achieving secondary students involved in
concurrent enrollment through the WISE program. Participants were full-time secondary
students registered in sufficient courses to fulfill university admission requirements. Participants’
high-achievement was demonstrated through meeting the enrollment criteria for WISE.
Participation occurred in two phases: data generation and data sorting/rating. A total of 21 WISE
students participated in the first phase. This number exceeds the minimum recommended sample
size required to capture a variety of opinions and provide clear results (Kane & Trochim, 2007).
In the second phase, a total of 13 WISE students completed the sort/rate activity, sufficient to
provide robust results (Kane & Trochim, 2007). Sorters were in Grade 11 (n = 1) and Grade 12
(n = 12). Eleven of the sorters were female, two were male.
Measures
Methods used to collect data in response to the focus prompt, “We’d like to better
understand the many reasons high-achieving students have for participating in the WISE
program. Think of as many reasons as you can, and please list below” included interviews and
written responses. Methods used to facilitate sorting and rating of the generated responses
included interviews and online use of proprietary Concept Systems Global (CSG) software.
Statements were rated on a five-point scale where 1= not important and 5 = very important.
Concept Mapping Software. CSG is a proprietary web-based application designed
exclusively for use with Trochim’s concept mapping methodology. A CSG license was
purchased for this study from Concept Systems Incorporated (available at
Procedure
Ethics Approval and Consent. Ethics approval for this study was obtained from the
Faculty of Education Sub-Research Ethics Board on 16th May 2012 (see Appendix A, including
revision granted on 23rd August 2012). Prior to participation, all participants received
information on the study and were briefed on informed consent (see Appendix B). Participants
were given a choice of ways to participate and could take part in the study in-person or online.
Those who participated in-person signed consent forms. Online participants were deemed to
have consented by their voluntary actions in completing the study activities electronically.
Sampling Procedure. The sample frame consisted of the 95 students enrolled in the
2012-2013 WISE program and all 95 WISE students were invited to participate. 21 students
volunteered to participate, comprising 22% of program participants. Recruitment began in
October 2012 at which time the program coordinator sent an email to all students enrolled in
WISE notifying them about the study and inviting them to participate (see Appendix C). The
students were asked to contact me directly via Western e-mail if they wished to participate in the
study. This recruitment strategy yielded a low response rate (n = 4). As a next step, I obtained
ethics approval to give a brief PowerPoint presentation about the study at a WISE event on 13th
October 2012 (see Appendix D). The presentation included a short description of the study
purpose and methodology, outlined the two phases of participation, and reviewed informed
consent (see Appendix E for complete presentation). In addition, I distributed the letter of
information and consent to event attendees who indicated an interest in the study. Students had
the opportunity to ask questions about the study and submit their names and email contact
Statement generation. In phase one data generation, participants brainstormed
statements in response to the focus prompt. Participants submitted responses: (a) by email (n=7),
(b) in-person during an interview at their school (n=1), or (c) in-person written responses during
the WISE event (n=13). Participants who submitted written responses (electronic or in-person)
tended to submit either short-form sentences or bullet point responses suitable for sorting/rating.
The sole interview respondent was given a copy of the focus prompt prior to the interview and
had prepared a list of bullet point responses, which formed the basis of the interview. The
interview was audio recorded and individual statements from the recording were extracted per
Kane and Trochim (2007).
Statement preparation. Statements were prepared for sorting and rating using the
procedures outlined by Kane and Trochim (2007). First the raw statements from phase one were
entered into an Excel spreadsheet. Statements were then edited for clarity and compound ideas
were split. Next the researcher and research supervisor independently reviewed the statements to
derive a list of unique, relevant statements. We examined each raw statement and applied the
following data cleaning rules: (a) omit statements that do not respond directly to the focus
prompt, and (b) delete repetitions. Data cleaning was completed in Excel, with each statement
coded as “u” for unique, “r” for repeated concept or “d” for does not respond to the focus
prompt. The two reviewers then cross-referenced the independent coding to compile the final list
of statements. This process eliminated irrelevant and redundant statements and also reduced the
list of statements to a manageable size.
Statement sorting. In the second participation phase, participants sorted and rated the
statements generated in phase one. Participants completed the sorting and rating in one of two
interviews were scheduled prior to launching the online data collection in order to run-through
the instructions before posting them online. In each case, the interview took place in a quiet room
at the participants’ school. I gave the participant a stack of cards with one statement printed on
each card, and asked the participant to sort the statements into piles in a way that “makes sense”
to them. Participants were directed to make as many piles as they liked, not to create categories
such as "miscellaneous" or "other”, and that some statements could be sorted by themselves.
Participants appeared to understand the instructions without difficulty and were able to complete
the sorting without further instruction. In each case, after the participant had finished sorting, we
secured the cards into their piles using paper clips to preserve the sort. Participants then wrote a
label that best represented the category on the back of the last card in the pile. Following the
interviews, I inputted the data from these in-person manual sorts into the CSG application, using
the same host site as the online participants. In this way, I was able to ensure the online data
collection tools worked smoothly.
As mentioned, online participation in sorting and rating was facilitated through the CSG
application. The CSG software allowed participants in this study to submit their input
electronically, at a time and place that was convenient for them. Participants received an email
with a user name and password as well as a link to the online application host site that they used
to access the concept mapping software. Instructions on how to complete the sorting and rating
activities were provided online at the host site and participants were encouraged to email me
with any questions or concerns about completing the study activities. For online sorting,
participants grouped the statements together by clicking and dragging statements from an
solitaire. Participants then gave each pile a label that best represented the category by typing in a
label in the appropriate box on-screen.
Statement Rating. As with the sorting activity, participants completed the rating activities
either in-person (n = 2) or online (n = 11). Interview participants wrote a numeric rating from 1 to 5
on the front of each statement card. Data from the in-person ratings were manually inputted into the
CSG application. Online participants entered a numeric rating for each statement from a drop-down
menu via the host site.
Data Analysis and Data Display. Participants generated a total of 127 raw statements in
the first phase of data collection. In a sample of 69 concept mapping studies, Rosas and Kane
(2012) found studies averaged 96.32 statements (SD = 17.23) with a range of 45 to 132.
However, Kane and Trochim (2007) recommend fewer than 100 statements for sorting and rating
to minimize participant fatigue. The statement preparation process resulted in a list of 85 unique
statements for sorting and rating in the second phase of this study. Following data generation,
sorting and rating, CSG software was used to complete the data analyses and produce the data
Chapter 4: Results
Data analysis in Trochim’s concept mapping involves multidimensional scaling to
produce a point map and hierarchical cluster analysis to produce a cluster chart of the sorted data
(Trochim, 1989). Together these charts provide a structured visual display of how participants
conceptualize the phenomenon under study. The analyses, results, and charts for this study are
detailed below.
Multi-Dimensional Scaling: Point Map
The first step in data analysis is to determine the relationship between the statements that
were generated in response to the focus prompt. This determination is made by applying
two-dimensional non-metric multitwo-dimensional scaling to the statement sorts (Trochim, 1989).
Multidimensional scaling is a set of data analysis techniques that display the structure of
distance-like data as a geometrical picture. In this case, the distance between statements is
indicative of how often those statements were sorted together. For each participant, the results of
their sort were put into a binary matrix that has as many rows and columns as there are
statements, that is an 85 x 85 matrix. All of the values in this matrix were either zero or one,
where ‘1’ indicates the statements in that row and column were sorted together and ‘0’ means
they were not sorted together. Individual sort matrices were added together to obtain the
combined group similarity matrix (see Appendix F). Values in the matrix cells indicate how
many participants sorted that pair of statements together.
Multidimensional scaling analyzes the group similarity matrix and assigns each statement
a location in space (Kane & Trochim, 2007). Theoretically, multidimensional scaling can assign
a location based on multiple dimensions. In practice, two-dimensional scaling is used to create a
assigned a number for reference purposes and these numbers act as labels on the output chart. I
used the CGS software to apply multidimensional scaling and derive the set of x-y coordinates
for each data statement (see Appendix G for a list of statement reference numbers and
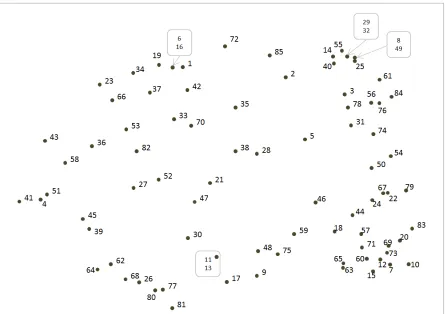
coordinates). The resultant mathematical model is plotted as a data point map (see Figure 1). The
point map shows each statement as a data point in a spatial relationship with all the other
statements according to how participants sorted the statements. Statements that are closely
related are positioned near each other, for example, statements 29 “I believe that what I am
learning is interesting” and 32 “I'm interested in a particular area of study” are plotted in the
same position on the data point map because all 13 sorters in the study grouped them together.
Figure 1 shows four statement pairs that were constantly grouped together including: statements
8, “I want to be a lifelong learner” and 49, “I love learning”; statements 6, “I thought I could take
on the challenge” and 16, “I wanted a bit of a challenge in my life that included obstacles I
needed to overcome”; statements 11, “credit” and 13, “early credit”; as well as statements 29 and
32. Statements that are not closely related, that is, statements that were not grouped together by
participants, are graphed further apart.
During multidimensional scaling analysis, the degree of fit between the model and the
way participants sorted the data is calculated using Kruskal’s stress value. Similar to linear
regression, Kruskal’s stress analyzes the squared vertical deviations of the individual data points
from the model. The stress value varies between 0 and 1, where lower values indicate less stress
and better fit. If participants sort statements into similar groups, there will be little stress in the
mathematical model (Petrucci & Quinlan, 2007). Conversely, if participants sort statements into
dissimilar groups, there will be a poor fit when the data points are plotted causing error or stress.
of application (Kane & Trochim, 2007). In this study, Kruskal’s stress value was 0.2777, which
Figure 1. Multidimensional scaling data point map showing spatial relationship between the 85
generated statements. Statements are labeled by number (see Appendix G for a list of statements
and their reference numbers).
Note. Distance between statements indicates degree of similarity, similar statements are closer
Hierarchical Cluster Analysis: Cluster Map
Following multidimensional scaling, I conducted hierarchical cluster analysis, again
utilizing CSG software. In cluster analysis, data points are grouped together according to their
proximity on the point map. The x-y coordinates derived from the multidimensional scaling
analysis serve as input for the analysis. Trochim’s concept mapping uses an agglomerative
approach; initially each data point is considered a unique cluster which is then merged with the
other data points resulting in successively fewer clusters. The ultimate number of clusters is a
qualitative decision made by the researcher based on the continuity of the statements within each
cluster (Kane & Trochim, 2007). For example, in deciding between a 15 or 14 cluster model, the
researcher examines which two clusters would merge to form the 14-cluster model and decides
whether the statements in the merging cluster fit together or are two distinct themes. The
resultant model should provide the best possible conceptual fit with the data. In addition to
considering conceptual fit in the cluster analysis, the researcher can also examine bridging
indices. Bridging indices, which vary between 0 and 1, indicate how often a statement is sorted
with other statements on the map (Petrucci & Quinlan, 2007). A bridging index near 1 indicates
that a statement bridges different concepts on the map. Conversely, an ‘anchor’ statement, with a
bridging value near 0, is most likely the best indicator of content in that area of the map (Kane &
Trochim, 2007). Bridging indices are also calculated for each cluster; cluster bridging indices are
the mean of bridging values for all statements within a cluster (Jackson & Trochim, 2002).
In theory, the number of statements in the data set forms the upper limit for the number of
clusters. In practice, the researcher begins cluster analysis by setting upper and lower limits on
the number of clusters that are practical. According to Rosas and Kane’s pooled analysis (2012),