Aus dem Veterinärwissenschaftlichen Department der Tierärztlichen
Fakultät der Ludwig-Maximilians-Universität München
Arbeit angefertigt unter der Leitung von Univ. Prof. Dr. Dr. med. vet. Manfred
Stangassinger
Angefertigt am Lehrstuhl für Physiologie der Technischen Universität München in
Freising-Weihenstephan
(Univ. Prof. Dr. Dr. Heinrich H. D. Meyer)
Metabolic and productive characterisation of multiparous cows grouped
for fat-corrected milk yield and milk protein concentration
Inaugural-Dissertation zur Erlangung der tiermedizinischen Doktorwürde der
Tierärztlichen Fakultät
der Ludwig-Maximilians-Universität München
von Katharina Gellrich, geb. Dolle
aus Wuppertal
Gedruckt mit der Genehmigung der Tierärztlichen Fakultät
der Ludwig-Maximilians-Universität München
Dekan:
Berichterstatter:
Korreferent:
Univ.-Prof. Dr. Braun
Univ.-Prof. Dr. Stangassinger
Priv.-Doz. Dr. Zakhartchenko
Widmung
T
ABLE OFC
ONTENTSI. INTRODUCTION ... 1
II. LITERATURE ... 2
1. Milk composition ... 2
1.1. Lactose ... 2
1.2. Fat ... 2
1.3. Protein ... 3
1.3.1. Composition of milk protein ... 3
1.3.2. Quantification of milk protein fractions ... 4
1.4. Effects on milk and protein composition ... 4
2. Characterisation of metabolic situation in dairy cows ... 6
3. Hepatic gene expression ... 7
4. Intravenous glucose tolerance test ... 8
4.1. Principles of glucose metabolism in ruminants ... 8
4.2. Hormonal regulation of glucose homeostasis ... 9
4.3. Insulin resistance ... 12
4.4. Methods for determination of insulin response ... 12
5. Hydrocortisone and β-hydroxybutyric acid in milk ... 14
III. MATERIALS AND METHODS ... 16
1. Animal experiment ... 16
1.1. Experimental design and experimental animals... 16
1.2. Body weight, body condition and back-fat-thickness ... 17
1.3. Collection of milk samples and measurement of milk composition ... 18
1.4. 100 day performance in previous and current lactation ... 18
1.5. Collection of blood samples and measurement of metabolites ... 18
1.6. Tissue collection ... 19
1.7. Feed restrictions in early and mid-lactation ... 19
1.8. Intravenous glucose tolerance tests ... 20
1.9. Slaughter and tissue collection ... 22
2. Analytical methods ... 22
2.1. Extraction, transcription and real time qPCR of hepatic mRNA ... 22
2.2. Analysis of major proteins in skim milk samples ... 25
2.3. Enzyme immuno assay of progesterone in skim milk ... 27
2.4. Enzyme immuno assay of hydrocortisone in skim milk ... 28
2.5. Analysis of β-hydroxybutyrate in skim milk ... 29
3. Statistical analysis ... 29
3.1. Milk parameters during experimental period ... 30
3.2. Feed restrictions in early and mid-lactation ... 30
3.3. Intravenous glucose tolerance tests ... 30
3.4. Major milk proteins in skim milk ... 31
IV. RESULTS ... 32
Table of contents VI
1.1. Cows and classification ... 32
1.2. Mean milk and blood parameters during 22 weeks of lactation ... 33
1.3. Course of milk parameters during 22 weeks of lactation ... 34
1.4. Course of blood serum parameters during 22 weeks of lactation ... 44
1.5. Body weight, body condition score and back-fat-thickness ... 51
1.6. Cyclicity and health status ... 53
1.7. 100 day milk performance in previous and current lactation ... 54
2. Hepatic mRNA expression during 22 weeks of lactation ... 54
3. Feed restrictions ... 65
3.1. DMI intake and energy balance ... 65
3.2. Milk composition ... 68
3.3. Blood serum metabolites ... 80
3.4. Hepatic mRNA profiles ... 84
4. Intravenous glucose tolerance tests ... 88
4.1. Blood glucose and plasma insulin ... 91
4.2. AUC of blood glucose and insulin ... 96
4.3. Clearance rate of blood glucose ... 98
4.4. Model estimations ... 99
4.5. Milk parameters ... 100
5. Milk protein fractions ... 101
5.1. Composition of milk protein during 22 weeks of lactation ... 101
5.2. Influence of three days feed restriction on milk protein composition ... 108
V. DISCUSSION ... 116
1. Experimental animals ... 116
2. Hepatic mRNA expression during lactation ... 119
3. Feed restrictions ... 121
4. Intravenous glucose tolerance tests ... 125
5. Milk protein fractions ... 127
VI. CONCLUSION ... 129
VII. SUMMARY ... 130
VIII. ZUSAMMENFASSUNG ... 131
IX. REFERENCE LIST... 133
L
IST OF ABBREVIATIONSACACA acetyl-CoA carboxylase α
ACADVL acyl-CoA dehydrogenase, very long chain
ACTB actin beta
ap ante partum
AUC area under the curve
BCS body condition score
BFT back-fat-thickness
BHBA β-hydroxybutyric acid/β-hydroxybutyrate
BW body weight
cDNA complementary desoxyribonucleic acid
CF correction factor
CN casein
CPT1A carnitine palmitoyltransferase
Cq quantitative cycle
CR clearance rate
CS citrate synthase
CTSL cathepsin L
d day
Da Dalton
DMI dry matter intake
EB energy balance
ECHS1 enoyl CoA hydratase 1
EDTA ethylenediamine-tetraacetic acid
EIA enzyme immuno assay
EIF4B eukaryotic translation initiation factor 4B
EP European Pharmacopoeia
FPR milk fat to milk protein ratio
FR feed restriction
GAPD glyceraldehyde-3-phosphate dehydrogenase
GLUT glucose transporter
GPAM glycerol-3-phosphate acyltransferase
H3F3A H3 histone family 3A
HEC hyperinsulinaemic euglycaemic clamp
HGC hyperglycaemic clamp
HMGCS2 3-hydroxy-3-methylglutaryl-coenzyme A synthase 2 HNF4A hepatocyte nuclear factor 4A
HOMA-IR homeostatic model assessment of insulin resistance
HPLC high performance liquid chromatography
IGF1 insulin-like growth factor 1
INSR insulin receptor
IR insulin resistance
ivGTT intravenous glucose tolerance test
LA lactalbumin
LD lactation diet
LfL Bavarian State Institute of Agriculture, Landesanstalt fuer Landwirtschaft
LG lactoglobulin
MEC mammary epithelial cells
MJ mega joule
mRNA messenger ribonucleic acid
MS mass spectrometry
List of abbreviations VIII
NEFA non-esterified fatty acids
NEL netto energy lactation
PAGE polyacrylamide gel electrophoresis
PBST phosphate buffered saline Tween-20
PC pyruvate carboxylase
PCK1 phosphoenolpyruvate carboxykinase, cytosolic PCK2 phosphoenolpyruvate carboxykinase, mitochondrial
pp postpartum
PPARA peroxisome proliferator activated receptor α QUICKI quantitative insulin sensitivity check index
RD restriction diet
RT room temperature
RT-qPCR real time quantitative polymerase chain reaction
SCC somatic cell count
SDS sodium dodecyl sulphate
SLC2A solute carrier family 2
SREBF1 sterol regulatory element binding transcription factor 1
TAT tyrosine aminotransferase
tBR total bilirubin
TMB tetramethylbenzidine
TNFA tumour necrosis factor α
USP United States Pharmacopoeia
I.
I
NTRODUCTIONMilk protein yield has become the major economic output of the dairy industry. In 2010, 47.5% of collected milk was devoted to protein dependent production of cheese, including cream, curd and pulled curd cheese (Bundesministerium für Ernaehrung, 2011). This demand is reflected by the paying system of dairy industry: in 2011, the dairy industry paid for one kg milk (4.2% milk fat and 3.4% milk protein) 34.5 ± 1.2 €-cent, corrected by 2.70 €-cent for percentage fat and 4.10 €-cent for percentage protein (dairy factory Weihenstephan, Freising; Topagrar, 2011).
Milk protein yield is mainly depending on milk yield (correlation 0.92), but also on milk protein content (correlation 0.10; Teepker and Swalve, 1988). After focussing on efforts to increase milk yield during the last decades, special emphasis of genetic selection is nowadays also devoted to other traits including milk protein content (Lipkin et al., 2008).
Regardless of the economic value of milk protein yield, cows with elevated protein content could have metabolic advantages in comparison to their herd mates with equal protein yield as a result of lower protein content but higher milk yield. The amount of produced milk correlates positively to the lactose yield (0.96; Shahbazkia et al., 2010). Regarding cows with similar milk yield, the energy demand for milk synthesis depends on milk fat and protein content (Kamphues et al., 2004):
𝑚𝑖𝑙𝑘𝑒𝑛𝑒𝑟𝑔𝑦 �𝑀𝐽𝑘𝑔�= 0.38 ×𝑓𝑎𝑡% + 0.21 ×𝑝𝑟𝑜𝑡𝑒𝑖𝑛% + 1.05.
Consequently, energy demand for synthesis of milk protein is nearly half of the energy demand for the same amount of milk fat. Regarding the critical situation of high yielding dairy cows during the first weeks of lactation, when feed intake regularly lags behind energy demand for milk synthesis, it is worthwhile to select cows with high economic and concurrently low energetic output to decrease risks of typical diseases during early lactation like ketosis, hepatic steatosis, dislocation of abomasum and following events (impaired immune function, metritis, mastitis, lameness). However, selecting cows with low milk fat content is not desirable due to concomitant decrease of milk protein concentration (correlation 0.47), as well as selecting for low milk fat yields which would reduce milk yield (correlation 0.77) and protein yield (correlation 0.82; Teepker and Swalve, 1988).
II. Literature 2
II.
L
ITERATURE1.
Milk composition
Producing a nutritive excretion for the nourishment of the offspring is the evolutional advantage of many mammalian species. However, in the following sections the term milk refers to cow’s milk. Milk is a very complex emulsion, containing approximately 3.0 to 5.0% fat mainly organised in fat globules and around 5% carbohydrates, mainly lactose, but also galactose and glucose in the aqueous phase (Schultz, 1974; Cerbulis and Farrell, 1975). Another nutritive ingredient are the milk proteins (around 3.2 to 3.8%), consisting of 20% whey proteins with the major components α-lactalbumin (α-LA) and β-lactoglobulin (β-LG) and of 80% caseins, divided into major subclasses α-, β- and κ-casein (-CN), arranged in micelles (Swaisgood, 1982; Rodriquez et al., 1985). Further constituents are proteolysed fragments (γ1-3-CN and proteose peptone, plasmin derived from β-CN), cells (mammary epithelial cells or immune cells like leucocytes), but also urea, amino acids, immunoglobulins, lactoferrin, vitamins, minerals and hormones along with electrolytes and other components (Ng-Kwai-Hang et al., 1984; Shutt and Fell, 1985; Palmano and Elgar, 2002). Hereafter, only the major milk components lactose, fat and protein are further described in detail.
1.1.
Lactose
Concentration of lactose is the volume limiting factor for milk synthesis, due to its osmotic activity and its disability to cross the membrane of mammary epithelial cells (MEC; Larson, 1969; Bleck et al., 2009).
The disaccharide lactose consists of glucose and galactose, which is metabolised in MEC from glucose. Lactose is synthesised in the Golgi apparatus of MEC by lactose synthase, which is a complex of α-LA and ubiquitous galactosyltransferase (Larson, 1969; Kuhn et al., 1980). With increasing milk protein content, concentration of lactose synthase increases and concentrations of galactosyltransferase also increase with days of lactation (Bleck et al., 2009). After synthesis, lactose is secreted by exocytose into the mammary alveoli lumen (Shennan and Peaker, 2000). Lactose content in milk of different breeds ranges from 4.66 ± 0.34% in Guernsey, 4.93 ± 0.61% in Holstein to 5.15 ± 0.46% in Brown Swiss cows, but is equally distributed within breeds (Cerbulis and Farrell, 1975).
1.2.
Fat
Milk fat provides the main energy source of milk, whereas milk protein and lactose accounts for half the energy density of milk fat (Emery, 1973). Moreover, lipid droplets contain lipohilic vitamins and other biological active substances (Parodi, 1997; Molkentin, 1999).
nutritional value, but since proteomic studies give new insights, it is obvious, that MFGM proteins are important for cellular processes and defence mechanisms in newborns (Cavaletto et al., 2008). Concentration of milk fat averages 4.34 ± 0.71%, ranging from Jersey (5.42 ± 0.53%), Holstein (3.73 ± 0.32%) to Milking Shorthorn cows (3.58 ± 0.26%; Cerbulis and Farrell, 1975), whereas in Holstein herds mean fat content is 3.684 ± 0.003% (Ng-Kwai-Hang et al., 1984).
1.3.
Protein
Synthesis of milk protein
Precursors for mammary protein synthesis are amino acids extracted from blood or synthesised in MEC. Milk protein synthesis follows the same principles as in other cells: transcription of DNA, translation at the ribosomes of rough endoplasmatic reticulum and posttranslational modifications (Larson, 1969; Shennan and Peaker, 2000). The genes for the caseins are clustered in close proximity on bovine chromosome 6 and are conserved throughout evolution with αS1-, αS2- and β-CN having a common ancestor whereas κ-β-CN was derived from the fibrinogen gene family (Mercier and Vilotte, 1993). Furthermore, encoding genes for α-LA can be found on chromosome 5 and for β-LG on chromosome 11 (Mercier and Vilotte, 1993).
Some proteins derive from blood and are secreted unchanged into milk by vesicular transport across MECs or by paracellular migration (e.g. BSA, immunoglobulins; Larson and Gillespie, 1957; Shennan and Peaker, 2000). During lactation in healthy cows, the transcellular path predominates whereas in cows suffering inflammation of mammary gland, tight junctions between MEC are becoming leaky and the paracellular way gains importance (Shennan and Peaker, 2000; Hogarth et al., 2004).
1.3.1. Composition of milk protein
Depending on their solubility at pH 4.6 and 20°C, milk proteins are divided into indissoluble caseins and soluble whey proteins (Swaisgood, 1982).
Casein
According to De Marchi et al. (2009), the casein fraction of milk mainly comprises of αS1-, αS2-, β- and κ-CN in concentrations of 31.3, 10.8, 36.9 and 9.3% of total protein. Morris (2002) observed 42.8, 19.4 and 11.7% of total protein for αS-, β- and κ-CN. All of the caseins bind calcium and this binding capacity is proportional to the phosphate content (Swaisgood, 1992). During migration through the cytoplasm, caseins cluster with calcium and phosphate to micelles (Walstra, 1999). Individual caseins exhibit varying structures: αS1-CN bears 199 amino acids (23.0 kM), two hydrophobic and one polar group and assembles with itself stepwise. Furthermore αS2-CN consists of 207 amino acids (25.0 kM), can contain a disulfide bond, is the most hydrophilic of the caseins and assembles also stepwise to build polymers (Morris, 2002). Moreover, β-CN consists of 209 amino acids (24.0 kM) and acts as a detergent due to its amphiphilic character because of the highly charged polar N-terminal region and the hydrophobic C-terminal region. Self-assembly of β-CN produces large spherical aggregates (Morris, 2002).
II. Literature 4
providing solubility of micelles in aqueous media and it can also be uniformly distributed within micelles. The higher the κ-CN content at the periphery of micelles, the bigger they grow (92 - 142 nm; Carroll and Farrell, 1983). Composited of 169 amino acids (19.0 kM), it is cleaved by rennet into its hydrophobic portion para-kappa-casein and the hydrophilic portion caseinomacropeptide, therefore causing the micelles to agglutinate (Hallen et al., 2010). Moreover, during heat-induced coagulation, κ-CN interacts with β-LG (Morris, 2002).
Whey protein
Already in ancient times, healthy aspects of whey were known. Nowadays the underlying proteins and bioactive peptides are revealed, which account for effects on satiety and therefore obesity management or influence blood pressure (Barth and Behnke, 1997; Clare and Swaisgood, 2000; D'Amato et al., 2009). Apart from minor constituents like BSA, immunoglobulins and lactoferrin, whey consist mainly of proteins α-LA and β-LG. De Marchi et al. (2009) reported 3.2 and 9.3% of total protein for α-LA and β-LG and according to Morris (2002) α-LA, β-LG, immunoglobulin G and BSA account for 3.1, 13.3, 2.5 and 1.4% of total protein.
The more abundant whey protein β-LG comprises of 178 amino acids (18.3 kM) and binds hydrophobic and amphiphilic molecules like hexane, palmitic acid, vitamin D or retinol (Sawyer, 2003; Farrell Jr et al., 2004). As mentioned before the 123 amino acid containing globular protein α-LA is part of the complex for synthesis of lactose (Kuhn et al., 1980). Furthermore α-LA binds calcium, zinc and other metals due to its classification as calcium metalloprotein (Farrell Jr et al., 2004).
1.3.2. Quantification of milk protein fractions
For separation and quantification of milk protein fractions and for analysis of genetic varieties, methods often apply high performance liquid chromatography (HPLC). In HPLC, protein solutions together with solvents are pumped through a column filled with specific materials like silica beads with or without carbon chains. Proteins attach according to size, ionisation or other properties to these fillings and duration of migration varies for different proteins (Bordin et al., 2001; Bonfatti et al., 2008; Bonizzi et al., 2009). Moreover, HPLC coupled to mass spectrometry (MS) has also been used. Principle of MS is based on a separation by the ratio of mass to charge: samples are vaporized, ionised (e.g. by laser or electrospray), the ions are guided through an electromagnetic field, where a separation according to ratio of mass to charge occurs and ions are detected by an electron multiplier (Galvani et al., 2001; Fröhlich and Arnold, 2006; Boehmer et al., 2010). To obtain single peptides for analysis in MS, protein solutions are subjected to a two-dimensional polyacrylamide gel electrophoresis (PAGE) followed by trypsin digestion. In 2D-PAGE, proteins are first separated according to their isoelectric point by isoelectric focussing and then according to their molecular weight by sodium dodecyl sulphate electrophoresis (SDS; O'Farrell, 1975). Despite of the high power of resolution and separation, 2D-PAGE and also SDS-PAGE are very time consuming and have low throughput rates. Goetz et al. (2004) and Wu et al. (2008) showed that miniature electrophoresis on microfluidic chips offers a fast and reliable alternative for conventional SDS-PAGE. On these chips, all steps of traditional gel electrophoresis can be performed: gel preparation, sample loading, separation (reducing or non reducing conditions), staining and destaining and detection. Integration is done automatically with the possibility of manual integration (Agilent 2100 Expert Software).
1.4.
Effects on milk and protein composition
Genetics
From the middle of the 20th century, dairy cows have been selected for milk and fat yield (Schultz, 1974). Since then, new developments in molecularbiology have altered traditional breeding programs. Rolleri et al. (1956) have shown, that different breeds vary in milk protein composition: On the one hand, Holstein cows show lowest total casein, α- and β-CN, on the other hand, cows of the Ayrshire breed have less milk α-CN compared to Brown Swiss, Guernsey and Jersey cows. Nowadays breeders have a deeper understanding of the mechanisms underlying these variations due to comprehension of most of the impacts of genetic polymorphisms on milk protein composition or the detection of quantitative trait loci for protein composition (Martin et al., 2002; Schopen et al., 2009). All these factors together represent a new breeding system according not only to conventional breeding values (e.g. performance of offspring) but also to the genomic breeding value (Hayes et al., 2009). After decades of selecting for milk yield and fat yield, emphasis today shifts towards milk protein yield and concentration (Lipkin et al., 2008).
Lactation
Independent of the genetic equipment, milk composition alters with progressing lactation. During the first days, secretion of mammary gland provides immune components for the newborn. Concentrations of fat, protein, immunoglobulins and lactoferrin are higher in colostrum and several low abundance proteins appear in colostrum which are not found in mature milk (Kehoe et al., 2007; Stelwagen et al., 2009). With ongoing lactation, milk fat, protein and immunoglobulin concentrations decrease and reach levels of mature milk. Protein concentration in Brown Swiss cows shows a nadir at 3.0% around week (wk) 4 postpartum (pp) and increases from wk 8 pp until wk 44 pp (to 4.0%; Schlamberger et al., 2010). Especially in high yielding cows, milk fat concentration is comparative high in early lactation due to the metabolic imbalance caused by enormous acceleration of produced milk yield, concurrent insufficient energy intake and resulting mobilisation of body fat tissue (Grummer et al., 2004; Ingvartsen, 2006).
Additionally with increasing numbers of lactation, dairy cows produce more milk (maximum in 4th or 5th lactation), but concentrations of main components remain relatively constant (Waite et al., 1956; Ng-Kwai-Hang et al., 1984; Ray et al., 1992).
Feeding
Besides genetic and lactational effect, feeding has also a high but complex influence on milk and milk protein composition: adequate amounts of rumen-undegradable protein and energy intake, suitable roughage supply and improved peri-parturient feeding regime avoiding over-conditioning of dry cows optimise milk protein concentration (Sutton, 1989; Jouany, 1994; Santos et al., 1998; Pop et al., 2001; Brun-Lafleur et al., 2010). Moreover, energy-insufficient rations especially in early lactation provoke body fat mobilisation and therefore increasing milk fat concentration and milk fat to milk protein ratios (FPR).
The composition of dietary fat may influence the ratio of short to long fatty acids in milk fat (Palmquist et al., 1993; Sigl et al., 2010). Moreover during restricted pasture allowance, Auldist et al. (2000) found 4% increase of caseins and 9% decrease of whey proteins as well as declining milk yield and fat concentration. Elevation of available protein in small intestine by infusion of proteins resulted only in decrease of β-LG (-4.7%; Mackle et al., 1999).
Management and environment
II. Literature 6
of dry period and milking frequency also affect milk composition. Madsen et al. and Schlamberger et al. found 0.4% increase of protein concentration at wk 5 pp or respectively throughout 305 day (d) performance in continuously milked cows without drying off at wk 8 ante partum (ap; Madsen et al., 2008; Schlamberger et al., 2010). Furthermore milking frequency in Holstein cows correlates positively to milk yield (0.40) and negatively to milk fat (-0.13) and protein concentration (-0.20; Løvendahl and Chagunda, 2011).
Moreover decreasing temperatures increase protein and casein concentrations in milk and concentrations of all milk proteins increase after a nadir in the 2nd lactation month until end of lactation (Ng-Kwai-Hang et al., 1982; Rodriquez et al., 1985).
Disease
Besides physiological effects, also pathological mechanisms alter milk and protein composition. During infection of mammary gland, milk yield declines resulting in higher concentrations of components and the protein composition is altered towards more whey proteins (especially the blood derived proteins) and less caseins (Munro et al., 1984; Hogarth et al., 2004). These changes are complex and results of studies often contradictory as Seegers et al. (2003) reviewed.
2.
Characterisation of metabolic situation in dairy cows
Due to selection programs over the last decades and favouring of high milk output, high yielding dairy cows have to face enormous changes through the gestation-lactation cycles in their productive life. Prior to parturition, metabolism of dairy cows undergoes tremendous alterations, which involve complex feedback and control mechanisms of reproductive hormones (e.g. increase in estrogens, decrease in progesterone), insulin (increase in blood levels, decrease in tissue sensitivity) as well as diminished anabolic with concurrent increased catabolic situation in adipose and muscle tissue (Ingvartsen and Andersen, 2000).
Moreover, during last weeks before parturition, dry matter intake (DMI) decreases, resulting in increasing nutrient and energy deficit (Drackley, 1999; Ingvartsen and Andersen, 2000; Grummer et al., 2004). Onset of lactation enhances this deficit by direction of glucose to mammary gland due to up-regulation of messenger ribonucleic acid (mRNA) encoding for insulin independent glucose transporters (Bell and Bauman, 1997; Komatsu et al., 2005). To cope with this metabolic imbalance, dairy cows show sophisticated regulation mechanisms: increase of body fat mobilisation and hepatic oxidation of fatty acids, increasing gluconeogenesis and ketogenesis in liver as well as diminished utilisation of glucose by muscle and adipose tissue (Trenkle, 1981; Loor et al., 2005; Nafikov and Beitz, 2007; McCarthy et al., 2010). As a sign of this catabolic situation, specific alterations can be found in blood parameters of cows. Blood glucose decreases and stays on low levels and NEFA increase due to enhanced mobilisation of body fat tissue. The product of hepatic fatty acid oxidation acetyl-CoA is not metabolised in the citric acid cycle because of glucose deficiency and therefore induces ketogenesis (Zammit, 1983).
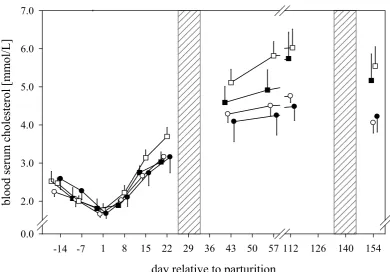
As a function of body fat mobilisation and β-oxidation of fatty acids, blood levels of cholesterol increase from wk 4 ap until wk 13 pp (Graber et al., 2010). Loor et al. (2007) show that during restricted feeding and ketosis, mRNA encoding for enzymes of cholesterol synthesis are decreased. Only 20% of milk cholesterol concentrations are produced in mammary gland, the greater part is produced in liver and transported via blood lipoproteins to mammary gland (Long et al., 1980). Furthermore total bilirubin (tBR) is a hepatic marker for function and integrity of liver cells with extent of hyperbilirubinaemia depending on location of impaired cell function and integrity of cell membranes (Gopinath and Ford, 1972).
intake has its maximum later on, around 10th week pp (Schröder and Staufenbiel, 2006). During this critical timeframe of lactation in cows, several production diseases can occur: ketosis, displacement of abomasum, infections of uterus or mammary gland, hepatic steatosis and reproductive disorders like delayed ovulation, acyclic oestrus or ovarian cysts (Ingvartsen, 2006; LeBlanc, 2010).
Later on in lactation, during mid and late lactation, energy output (for maintenance, milk production, if pregnant for growth of embryo) is covered or exceeded through DMI and energy intake so that body storages can be refilled. Nevertheless, excessive gain of body fat reserves has to be avoided due to the higher risk of obese cows to develop severe problems during parturition or to develop fatty liver syndrome after parturition (Ingvartsen, 2006; Roche et al., 2009).
Feed restriction (FR) is an appropriate tool for enhancing energy deficit in early lactation. Furthermore milk and blood parameters are altered by FR during early or mid-lactation. Diverging results can be found in studies: a 49% FR for three weeks in mid-lactation resulted in declining milk yield (by -10%) and milk protein content (-5%; Gross et al., 2011), whereas 25% FR reduced milk yield by 12% and milk protein concentration from 3.36% to 3.09% (Guinard-Flament et al., 2007). A 51% FR over 5 days during mid-lactation provoked 22% reduction in milk yield and had no effect on milk composition (Velez and Donkin, 2005).
3.
Hepatic gene expression
Several enzymes play important roles in liver metabolism of cows. Hereafter functions of those individual proteins, of which abundances of encoding mRNA were measured, are discussed. Lipid metabolism
Glycerol-3-phosphate acyltransferase (encoding gene GPAM) catalyses the initial step of triacylglycerol synthesis from acyl-CoA (Roy et al., 2006) and acetyl-CoA carboxylase α (encoding gene ACACA) is the rate limiting enzyme for de novo synthesis of long chain fatty acids in liver and adipose tissue (Mao et al., 2001).
In β-oxidation of fatty acids, carnitine palmitoyltransferase 1A (encoding gene CPT1A) is involved as transport enzyme for long chain fatty acids across the mitochondrial membrane by binding to carnitine (van der Leij et al., 2000). Furthermore, acyl-CoA dehydrogenase very long chain (encoding gene ACADVL) catalyses the first step of β-oxidation of long chain fatty acids in liver (van Dorland et al., 2009) and enoyl CoA hydratase 1 (encoding gene ECHS1) reversibly hydrates unsaturated fatty acyl-CoA derivatives to hydroxy-acyl-CoA compounds (Furuta et al., 1980). Furthermore, several transcription factors are involved in regulation of fatty acid metabolism in liver: sterol regulatory element binding transcription factor 1 (encoding gene SREBF1) up regulates GPAM transcription, peroxisome proliferator activated receptor α (PPARA) promotes overall fatty acid oxidation and hepatocyte nuclear factor 4A (HNF4A) enhances fatty acid oxidation as well as gluconeogenesis (Loor et al., 2005). Eukaryotic translation initiation factor 4B (EIF4B) is involved in lipid oxidation due to diminished nutrient availability (Gingras et al., 2001).
During transition period, hepatic mRNAs encoding for these enzymes show higher (CPT1A, ACADVL, ECHS1, PPARA, HNF4A, EIF4B) or lower (GPAM, ACACA, SREBF1) abundances respective to function in lipid catabolism or anabolism (Loor et al., 2005; 2006; 2007).
Protein metabolism
II. Literature 8
(Johnson et al., 1973; Dietrich, 1992) and cathepsin L (CTSL) being a lysosomal cysteine proteinase is also involved (Stearns et al., 1990; Becker et al., 2010).
Carbohydrate metabolism
During gluconeogenesis, the enzyme pyruvate carboxylase (PC) catalyses the irreversible carboxylation of pyruvate to oxaloacetate and cytosolic phosphoenolpyruvate carboxykinase (PCK1) as well as mitochondrial form (PCK2) metabolise oxaloacetate further to phosphoenolpyruvate and carbon dioxide (Aschenbach et al., 2010). Increased activity of these enzymes could be observed by Greenfield et al. (2000) during early lactation, whereas FR induces only PC (Stangassinger and Sallmann, 2004; Velez and Donkin, 2005).
Furthermore, the facilitated glucose transporter member 2 (GLUT2 or solute carrier family 2, member 2; encoding gene SLC2A2) enables passive glucose transport into hepatic cytoplasm and can also be found in kidney and small intestine (Zhao et al., 1993; Zhao and Keating, 2007). Insulin receptor (INSR), part of tyrosine kinase receptor family, is a glycoprotein in cell membranes that binds insulin, which is essential for promoting glucose utilisation, glycogen and fat synthesis and for diminishing catabolism of fat. After three weeks of 49% FR, abundance of INSR mRNA is increased in restricted compared to control cows and in hepatic tissue of cows with fatty liver compared to healthy cows, less mRNA is found (Liu et al., 2010; Gross et al., 2011). Acetyl-CoA from fatty acid oxidation is metabolised by 3-hydroxy-3-methylglutaryl-coenzyme A synthase 2 (HMGCS2) with acetoacetyl-CoA to HMG-CoA, which is an intermediate in cholesterol synthesis and ketogenesis. If oxaloacetate from gluconeogenesis is diminished, HMG-CoA is further metabolised to ketones (van Dorland et al., 2009). In fasting rats, increased activity of hepatic HMGCS2 is found by Hegardt (1999).
As already mentioned, transcription factor HNF4A modulates fatty acid oxidation and furthermore gluconeogenesis by activation of PCK1 transcription (Loor et al., 2005).
Common hepatic metabolism
Citrate synthase (CS) condensates acetyl-CoA and oxaloacetate to citrate, thereby representing the first and pace-making step in citric acid cycle (van Dorland et al., 2009) and high acyl-CoA concentrations from fatty acid oxidation lead to inhibited activity resulting redirection to ketone body synthesis (Ballard et al., 1968).
The cytokine tumour necrosis factor α is involved in systemic inflammation, stimulates the acute phase reaction and TNFA mRNA is up regulated by ad libitum feeding before parturition (Loor et al., 2006). Furthermore, hepatic mRNA of TNFA is up regulated after parturition and is positively correlated with mobilisation of body fat (Loor et al., 2005).
Moreover, mRNA encoding for insulin-like growth factor I (IGF1) produces a protein similar to insulin in molecular structure and function. In humans, it exerts its main function in growth and development of different tissues (Bonefeld and Møller, 2011). During lactation in cows, concentrations of IGF1 are lower compared to dry period and lower in cows compared to bulls or calves (Ronge and Blum, 1989).
4.
Intravenous glucose tolerance test
4.1.
Principles of glucose metabolism in ruminants
These are immediately absorbed and metabolised in the liver, whereas only 10% of carbohydrates can be absorbed as glucose in small intestine (Sutton, 1971; Baird et al., 1980). Already during absorption by epithelium, butyrate is metabolised to BHBA (Stangassinger and Giesecke, 1986; Bell and Bauman, 1997). Feeding influences proportions of occurring volatile fatty acids, e.g. feeding less roughage decreases acetic acid and increases the others (Sutton, 1971).
Gluconeogenesis provides almost all required glucose in cows and is regulated by insulin, growth hormone and glucagon (Aschenbach et al., 2010). Substrates are propionic acid as major substrate, lactate, glycerol and amino acids (Stangassinger and Sallmann, 2004; Nafikov and Beitz, 2007). In contrast to monogastric animals, rate of gluconeogenesis is higher after feeding (Young, 1977). Furthermore, gluconeogenesis prevents excess of volatile fatty acids in blood with its negative effects on appetite or acid-base balance (Aschenbach et al., 2010; Stangassinger, 2010).
Glucose derived from gluconeogenesis is distributed to heart and further on to cells of the body. Transport of glucose into body cells is mediated by facilitated transport systems, called solute carrier family 2 (genes SLC2A and proteins GLUT), by sodium-dependent transporter systems, the sodium/glucose cotransporters (SGLT) and by the myoinositol transporter 1 (HMIT1; Zhao and Keating, 2007). According to sequence similarities, GLUT1 to GLUT13 are divided in three classes: class 1 containing GLUT1-4, class 2 with the fructose transporter GLUT5, GLUT7, 9 and 11, and class 3 (GLUT6, 8, 10, 12 and HMIT1; Joost and Thorens, 2001).
The glucose transporters have different tissue specificities: GLUT1 appears in human placenta, brain, blood-tissue barriers, in bovine mammary gland and at low levels in bovine erythrocytes, adipose and muscle tissue, GLUT2 in liver, pancreatic β-cells, renal tubular cells and at basolateral membrane of small intestine, GLUT3 in human brain and neurons and at low levels in bovine mammary gland, skeletal muscle and duodenum, GLUT4 in all insulin-sensitive tissues like muscle, heart and adipose tissue, GLUT5 at apical membranes of small intestine, in muscle and adipose tissue, in liver and kidney of lactating cows and at low levels in mammary gland and GLUT7 in liver as microsomal glucose transporter (Gould and Holman, 1993; Zhao et al., 1993; Hocquette and Abe, 2000). Furthermore, regarding their controllability by insulin, GLUT4 is called insulin-sensitive and GLUT1, 2, 3 as well as GLUT5 are insulin-insensitive, ensuring the basal requirements of cells (Hocquette and Abe, 2000). In lactation, high levels of insulin-insensitive transporters can be found in mammary gland whereas during dry period, they are observed mainly in adipose and muscle tissue (Komatsu et al., 2005; Zhao and Keating, 2007).
4.2.
Hormonal regulation of glucose homeostasis
In cows, blood glucose is lower (2.5 to 3.3 mmol/L) compared to monogastric animals or calves (3.9 to 6.6 mmol/l; Klinik für Wiederkäuer, 2012). The level of circulating glucose is complex regulated, assuring homeostasis and homeorhesis (Bauman and Currie, 1980; Stangassinger, 2010).
Insulin
Synthesis of insulin occurs in β-islets of pancreas by formation of preproinsulin with acidic A chain, basic B chain and connecting (C-) peptide. After cleavage of amino acids and formation of disulphide bond between A and B chain, proinsulin emerges. Insulin consists after removing of C-peptide of the A chain with 21 amino acids and B chain with 30 amino acids, conjugated by two disulfide bonds between 7th amino acid of A and B chain and between 20th amino acid of A chain and 19th amino acid of B chain. It is stored in granules and very similar amongst mammalians, human insulin differs in only three amino acids from the bovine one (Hsu and Crump, 1989; Hayirli, 2006).
II. Literature 10
leads to increased production of ATP. Afterwards ATP-sensitive potassium channel closes and following cellular depolarisation is the final signal for fusion of insulin granules with plasma membrane (Mineo et al., 1990; Hou et al., 2009). Release of insulin is enhanced by nutrient availability (e.g. glucose, arginine, lysine, long chain fatty acids, calcium), gastrointestinal hormones like glucagon or parasympathetic stimuli and diminished by fasting or exercise, gastrointestinal hormones like somatostatin, sympathetic stimuli and prostaglandin F2α (Hayirli, 2006). Insulin secretion after infusion of glucose is biphasic: storages in pancreatic β-cells are cleared within 10 to 20 minutes and if glucose stimulation lasts, synthesis of insulin is started and immediately secreted (60 - 120 minutes; Hove, 1978). Furthermore in dairy cows, insulin levels in blood are lowest in early lactation (Stangassinger, 2006) and increase with progression of lactation (peak lactation 18.5 µU/ml, mid-lactation 19.9 µU/ml; Bonczek et al., 1988) and is lower in high yielding cows (4.96 µU/ml in high yielding cows during first 50 days after parturition and 7.44 µU/ml in low yielding cows; Gong et al., 2002).
Insulin enhances glucose uptake in peripheral tissues, resulting in enhanced lipogenesis and protein anabolism, stimulates synthesis of glycogen in liver and muscle and inhibits hepatic gluconeogenesis (McDowell, 1983; Hayirli, 2006). After acting on receptors, insulin is released from receptors or depleted by cells of liver and kidney. Degradation of insulin involves endocytosis of the insulin-receptor complex, cleavage by insulin-degrading enzyme (proteolysis), protein disulfide isomerase (formerly glutathione insulin transhydrogenase, cleavage of disulfide bonds) and acidic proteinases in lysosomes (Duckworth et al., 1998).
Glucagon
The 29 amino acids containing peptide hormone glucagon is synthesised in α-cells of Langerhans-islets in pancreas via preglucagon and preproglucagon (Hsu and Crump, 1989; Hayirli, 2006). Release of glucagon is stimulated by low blood glucose levels, but also by postprandial high levels of propionate and butyrate, mainly to avoid insulin-induced hypoglycaemia (Brockman, 1978). Glucagon stimulates glycogenolysis in liver and gluconeogenesis from proprionate, amino acids and lactate (McDowell, 1983; Donkin and Armentano, 1995; Hayirli, 2006) and shows weak positive influence on lipolysis (Brockman, 1979). Furthermore, glucagon decreases milk protein concentration and yield and alters milk protein composition towards more glycosylated κ- and αS2 -CN and less αS2-CN and α-LA without altering milk yield and other components (Bobe et al., 2003; 2009). Rather than absolute concentration, the ratio of insulin to glucagon influences glucose homoeostasis (McDowell, 1983). After a nadir around d 50 pp, ratio of insulin to glucagon increases with progressing lactation and absolute concentrations of glucagon are higher in early lactation compared to later stages (Herbein et al., 1985; Stangassinger, 2011).
When glucagon binds to its hepatic receptor, it is degraded partly by membrane-associated proteinases and partly after endocytosis in endosomes or lysosomes (Authier and Desbuquois, 1991).
Growth hormone (somatotropin)
The peptide hormone somatotropin is synthesised, stored and pulsatile secreted by somatotrophic cells of anterior pituitary gland, stimulated by growth hormone-releasing factor and inhibited by somatostatin. In contrast to insulin, the 191 amino acid containing hormone shows similarity amongst cows and pigs (90%), but not amongst these animals and humans (35%), even though their receptors are similar to human ones (pig 89%, cow 76% receptor similarity; Buonomo and Baile, 1990; Etherton and Bauman, 1998).
glucose uptake, lipogenesis and translocation of GLUT4 in adipose tissue and increased hepatic gluconeogenesis. By elevating glucose levels, somatotropin increases milk quantity after peak yield without altering composition (McDowell, 1983; Etherton and Bauman, 1998). Therefore, one molecule of somatotropin dimerises two of its receptors and induces a signalling cascade. Subsequently, somatotropin is degraded by endocytosis and cleaved by proteinases (Etherton and Bauman, 1998; van Kerkhof et al., 2000).
If ruminants are not fed continuously, somatotropin level decreases with every feeding, stays low for several hours and then increases again until next feeding due to stretch receptors in cranial rumen (McDowell, 1983). With proceeding lactation, somatotropin concentration increases but its ratio to insulin decreases during early lactation, directing amino acids to hepatic gluconeogenesis (Stangassinger, 2006). In feed deprivation, levels of growth hormone increase from 2 ng/mL in fed cows to 4 ng/mL at the second day of feed deprivation (Samuelsson et al., 1996).
Somatostatin
The peptide hormone somatostatin is synthesised in δ-islets of pancreas and in posterior pituitary and is highly conserved within vertebrates (Buonomo and Baile, 1990; Hayirli, 2006). Somatostatin occurs in two forms, one with 14 and the other with 28 amino acids, and is found in central nervous system, pancreas and intestine (Buonomo and Baile, 1990). It inhibits secretion of somatotropin, insulin and glucagon and is secreted with increasing blood levels of glucose, amino and fatty acids (Brockman and Greer, 1980; Brockman and Halvorson, 1981). Elevation of somatostatin levels in blood with concurrent insulin infusions increases insulin effects on tissues and therefore glucose clearance (Rose et al., 1997).
Glucocorticoids
The corticosteroids are produced in the cortex of adrenal glands. In the Zona fasciculata glucocorticoids such as hydrocortisone are produced, in the Zona glomerulosa mineralocorticoids like aldosterone and in the Zona reticularis androgens. Synthesis is under control of neuroendocrine hormones of hypothalamus and pituitary gland.
As a response to decreased blood glucose levels, hydrocortisone stimulates insulin secretion, protein catabolism, decreases milk yield and therefore increases gluconeogenesis (Baird, 1981; McDowell, 1983). Furthermore, Exton (1979) showed that glucocorticoids regulate substrate supply to and modulate pathways of hepatic gluconeogenesis (increase of PCK activity) and exert permissive effects on lipolytic and glycogenolytic action of catecholamines and on stimulation of gluconeogenesis by glucagon and epinephrine.
Levels of glucocorticoids increase during starvation, exercise (Exton, 1979; McDowell, 1983) or after temperature or behavioural stress (Trenkle, 1978; McDowell, 1983) and are involved in long term regulation of energy supply (Trenkle, 1981).
II. Literature 12
Catecholamines
In adrenal medulla synthesised catecholamines adrenaline and noradrenaline are produced from tyrosine which is converted to dopamine, further to noradrenaline and finally to adrenaline which is stored in chromaffin granules. After release into blood, half time is short and the molecules are degraded by methylation or deamination (Molinoff and Axelrod, 1971). Synthesis and release are regulated by acetylcholine from sympathetic nervous system and glucocorticoids (Edwards and Jones, 1993). Due to various receptors (α1, α2, β1, β2, β3) in different tissues, catecholamines exert different effects. Adrenaline shows far higher influence on glucose homeostasis than noradrenaline, it inhibits insulin secretion, promotes glycogenolysis and lipolysis, stimulates glucagon secretion and increases gluconeogenesis leading to increasing blood glucose levels (McDowell, 1983). Under normal conditions, catecholamines are more effective at nerve endings as compared with effects on glucose homeostasis (Exton, 1979). However in stress situations (fight or flight), which can be simulated by infusions of adrenaline, catecholamines show glycogenolytic and lipolytic effects resulting in suppressed insulin secretion or lowering of its effect. Moreover, they promote gluconeogenesis directly and by enhanced glucagon secretion and after end of infusion, insulin levels and glucose utilisation increase steeply (McDowell, 1983). Furthermore, adrenaline distributes glucogenic precursors such as alanin, glycerol and lactate from peripheral tissues to liver and antagonises effect of insulin (Stevenson et al., 1991; Capaldo et al., 1992).
4.3.
Insulin resistance
According to Kahn (1978) IR describes the situation of normal levels of insulin producing only a diminished biological response based on either diminished insulin sensitivity or diminished maximal effect of insulin (insulin responsiveness of tissue) or based on both mechanisms. During diminished insulin responsiveness, no biological response can be achieved even with high insulin levels due to alterations at receptor or post-receptor levels, whereas during decreased insulin sensitivity, only dose-response curve is shifted to the right.
Therefore, IR can have various reasons: at pre-receptor level diminished insulin production and/or increased depletion, at receptor level decreased number of INSR and binding affinity and at post-receptor level impaired signalling pathways and translocation of GLUT (Hayirli, 2006).
During late pregnancy and early lactation in dairy cows, glucose is distributed to foetus or mammary gland (Baird, 1981; Bell, 1995; Bell and Bauman, 1997). In this time period dairy cows experience a more or less severe but physiological IR (Stangassinger, 2006).
Nevertheless, no differences can be observed in expression of insulin responsive glucose transporter mRNA (SLC2A4) in adipose tissue of lactating and dry cows. Furthermore resistin, an inhibitor of adipocyte differentiation, glucose tolerance and promoter of IR, shows higher levels in adipose tissue and lower levels in mammary gland tissue of lactating cows than in dry cows, suggesting a contribution to inhibition of GLUT4 translocation during lactation (Komatsu et al., 2003).
4.4.
Methods for determination of insulin response
Furthermore, model estimations can be applied such as the homeostatic model assessment of insulin resistance (HOMA-IR) or the quantitative insulin sensitivity check index (QUICKI) in humans (Radziuk, 2000; Muniyappa et al., 2008), as well as the revised QUICKI, which can also be applied in cows (Holtenius and Holtenius, 2007; Kerestes et al., 2009; Stengarde et al., 2010). Clamp techniques
The clamp techniques are the gold standard procedures for determination of insulin sensitivity in vivo (Katz et al., 2000; Wallace and Matthews, 2002). However they demand more technical equipment and are more time consuming compared to tolerance tests.
During hyperglycaemic clamps (HGCs), blood glucose levels are elevated by adjusting intravenous glucose infusion rates until blood glucose levels are clamped on a hyperglycaemic plateau (steady state) within 60 minutes (2.78 mmol/l above preinfusion values; Sano et al., 1993). Because of the constant blood glucose, infusion rate reflects endogenous insulin secretion whereas infused glucose is metabolised. Therefore function of pancreatic β-cells can be determined by HGC (Sano et al., 1991; Holtenius et al., 2000).
During hyperinsulinaemic euglycaemic clamp (HEC), two infusions are administered: one with insulin, elevating blood level and clamping it on a hyperinsulinaemic level. Infusion of 1 µg insulin per kg BW per hour resulted in fourfold increase of blood insulin levels (Griinari et al., 1997; Mackle et al., 1999). The second infusion provides glucose to avoid hypoglycaemia and maintain normoglycaemic glucose levels. At the time point when steady state is achieved, glucose infusion rates equals glucose uptake by body cells and therefore reflects insulin responsiveness of tissues. For measurement of peripheral IR (at receptor or post-receptor level), HEC is the most appropriate test in human and veterinary medicine (Holtenius et al., 2000; Muniyappa et al., 2008). Glucose and insulin tolerance test
During ivGTT, insulin sensitivity is indirectly measured (Stangassinger, 2006). A bolus injection of glucose (100 mg per kg BW; Cummins and Sartin, 1987; Roche et al., 2008; 300 mg per kg BW; Grünberg et al., 2011) provokes insulin release from pancreas. Repeated measurements of glucose and insulin levels are done before the injection for basal values and in short intervals for around 120 minutes after injection. These values give information on maximum increase of insulin, half-live and turnover rate of glucose and area under the curve (AUC) of insulin and glucose (Palmquist and Moser, 1981; Opsomer et al., 1999; Murphy et al., 2000; Roche et al., 2008). Glucose tolerance defines the efficiency of homeostatic mechanisms (e.g. cellular uptake, gluconeogenesis, excretion) to restore basal glucose levels (Radziuk, 2000).
Due to lactation and insulin independent partitioning of glucose to mammary gland (Bell and Bauman, 1997), this method provides only marginal insight into insulin responsiveness of peripheral tissue in lactating cows. Nevertheless, advantage of ivGTT is the easy implementation and its non-invasive character, especially in studies with large test numbers.
Instead of glucose a bolus injection of insulin is administered during insulin tolerance tests and decrease of blood glucose levels is measured (Muniyappa et al., 2008). Insulin tolerance tests consume less time compared to ivGTT, blood samples are taken for 15 minutes after injection every 2 minutes. Afterwards, glucose is injected intravenously to avoid hypoglycaemia. Insulin resistance is calculated by logarithmic glucose concentrations (Wallace and Matthews, 2002). Model estimations
II. Literature 14
the correlations of HEC to various indices range from 0.44 for HOMA-IR to 0.61 for RQUICKI in lactating cows.
According to Radziuk (2000), HOMA-IR is calculated with fasted basal blood glucose levels and mean of thrice sampled basal insulin concentrations:
𝐻𝑂𝑀𝐴 − 𝐼𝑅= 𝑏𝑎𝑠𝑎𝑙𝑔𝑙𝑢𝑐𝑜𝑠𝑒 �𝑚𝑚𝑜𝑙𝐿 �22.5×𝑏𝑎𝑠𝑎𝑙𝑖𝑛𝑠𝑢𝑙𝑖𝑛 �µ𝑈𝑚𝐿� × 0.5
The higher HOMA-IR, the higher is IR and the lower is insulin sensitivity. The denominator of 22.5 derives from the product of normal fasting blood glucose (4.5 mmol/L) and insulin (5 µU/mL) in healthy humans (Muniyappa et al., 2008). For using this index in other subjects, basal levels of the respective animal have to be considered. Furthermore in evaluation of IR, the decal logarithm of HOMA-IR provides better correlations compared to HOMA-IR in humans (Muniyappa et al., 2008).
Holtenius and Holtenius (2007) modified the QUICKI according to Katz et al. (2000) with levels of blood NEFA and evaluated its validity in lactating dairy cows:
𝑄𝑈𝐼𝐶𝐾𝐼= �lg�𝑏𝑎𝑠𝑎𝑙𝑖𝑛𝑠𝑢𝑙𝑖𝑛 𝑚𝐿�µ𝑈 + lg�𝑏𝑎𝑠𝑎𝑙𝑔𝑙𝑢𝑐𝑜𝑠𝑒 𝑚𝑔𝑑𝐿 ��−1
𝑅𝑄𝑈𝐼𝐶𝐾𝐼= �lg�𝑏𝑎𝑠𝑎𝑙𝑖𝑛𝑠𝑢𝑙𝑖𝑛 𝑚𝐿µ𝑈�+ lg�𝑏𝑎𝑠𝑎𝑙𝑔𝑙𝑢𝑐𝑜𝑠𝑒 𝑚𝑔𝑑𝐿 �+ lg�𝑁𝐸𝐹𝐴 𝑚𝑚𝑜𝑙𝐿 ��−1
The lower this index, the lower is insulin sensitivity and the higher IR. The RQUICKI is not influenced by week of lactation and shows good correlation to insulin sensitivity during the first 15 weeks of lactation (Hayirli, 2006; Holtenius and Holtenius, 2007).
5.
Hydrocortisone and β-hydroxybutyric acid in milk
Hydrocortisone
As shown before, hydrocortisone is involved in gluconeogenesis by directing amino acids to liver and blood levels increase during fasting or stress, controlled by pituitary adrenocorticotropic hormone and corticotrophin-releasing hormone from hypothalamus.
Measurements of blood levels are inappropriate due to pulsatile secretion of hydrocortisone and elevation during blood sampling procedure (Bitman et al., 1990; Lefcourt et al., 1993). In milk, the situation of hydrocortisone levels in blood is reflected (Bremel and Gangwer, 1978). Milk hydrocortisone is associated with aqueous phase, not with milk fat like other steroid hormones (Butler and Des Bordes, 1980; van der Kolk, 1990). Acute stress situations can only be detected in milk via elevated hydrocortisone levels, if the acute stressor happens within four hours prior to milking (Gwazdauskas et al., 1977; Fox et al., 1981; Verkerk et al., 1998).
Therefore, measurement of hydrocortisone in milk of dairy cows is an appropriate method to determine extent of chronic stress due to automatic milking systems (Abeni et al., 2005), restricted lying behaviour (Fisher et al., 2002) or postpartal hypocalcaemia with downer-cow syndrome (Horst and Jorgensen, 1982; Waage et al., 1984; Forslund et al., 2010).
Especially in high yielding cows, increased pituitary activity with increased reactivity to corticotrophin-releasing hormone as well as reduced adrenocortical reactivity to adrenocorticotropic hormone is observed (Beerda et al., 2004). Furthermore, milk hydrocortisone levels are negatively correlated to milk protein content (Fukasawa et al., 2008) and milk fat concentration (Schwalm and Tucker, 1978).
β-hydroxybutyric acid
In milk, BHBA is secreted if levels in blood exceed metabolising capacity of cells due to enhanced ketogenesis in liver during metabolic imbalance and excessive mobilisation of body fat. Besides loss of appetite, decreasing milk yield, loss of body condition and excitation in the nervous form of ketosis, ketolactia is one of the signs for clinical and without other signs for subclinical ketosis. This disease occurs in early lactation and risk for ketosis increases with number of lactation. Furthermore, cows with ketosis show hyperketonaemia, hypoglycaemia, increased levels of NEFA as well as fatty liver and loss of liver glycogen (Baird, 1982).
In fasted cows, alimentary ketogenesis (production of BHBA in rumen epithelium) decreases until cessation at 3rd day and hepatic ketogenesis increases (Heitmann et al., 1987). Moreover, milk levels of BHBA are influenced by milking interval and sampling time point during milking (Nielsen et al., 2005b). Due to correlation of blood and milk levels of BHBA (0.66; Enjalbert et al., 2001), threshold values for detecting ketosis in cows can be evaluated with BHBA tests in milk (over 0.6 mmol/l; Nielsen et al., 2005a).
Most of tests are provided as semi quantitative tests in form of strips or powder, most relying on the principle of Rothera test, a reaction of nitroprussid with acetone derived from acetoacetate from BHBA metabolism. Positive Rothera test results in different shades of violet, the more acetone, the darker violet appears.
For quantitative measurements, flow injection analysis (Marstorp et al., 1983) or enzymatic test systems are necessary (Stein and Bässler, 1968). According to Bergmeyer and Bernt (1965), BHBA is metabolised by 3-hydroxybutyrate-dehydrogenase to acetoacetate:
ℎ𝑦𝑑𝑟𝑜𝑥𝑦𝑏𝑢𝑡𝑦𝑟𝑖𝑐𝑎𝑐𝑖𝑑+ 𝑁𝐴𝐷+ 3−𝐻𝐵𝐷𝐻�⎯⎯⎯⎯� 𝑎𝑐𝑒𝑡𝑜𝑎𝑐𝑒𝑡𝑎𝑡𝑒+𝑁𝐴𝐷𝐻+ 𝐻+
𝑁𝐴𝐷𝐻+ 𝐻++ 𝐼𝑁𝑇𝑁𝐴𝐷−𝑑𝑒ℎ𝑦𝑑𝑟𝑜𝑔𝑒𝑛𝑎𝑠𝑒�⎯⎯⎯⎯⎯⎯⎯⎯⎯⎯⎯⎯⎯⎯⎯� 𝑁𝐴𝐷++𝑡𝑒𝑡𝑟𝑎𝑧𝑜𝑙𝑖𝑢𝑚𝑐ℎ𝑙𝑜𝑟𝑖𝑑𝑒
III. Materials
and methods
16III.
M
ATERIALS AND METHODS1.
Animal experiment
1.1.
Experimental design and experimental animals
The animal welfare committee of the government of Upper Bavaria, Germany approved this study (AZ 55.2-1-54-2531-110-09) and federal guidelines were followed throughout the experimental period. From August 2009 to January 2011, the animal trial was conducted at the research farm Veitshof of the Technische Universitaet Muenchen in Freising, Germany. Multiparous Holstein-Friesian cows (n = 26), which had been raised at a saxonian dairy farm (AgroProdukt Leubsdorf GmbH, Leubsdorf, Germany), were transported in groups of 4 to 6 animals each to the research farm approximately 4 weeks prior to expected parturition. Cows were selected according to their milk yield and milk protein concentration during lactation in Saxony. According to performance in early lactation (d 23 to 25 pp) at Veitshof, cows were then assigned to four groups: high FCM yield and high milk protein concentration (MP-cows), low FCM yield and low milk protein concentration (mp-cows), high FCM yield and low milk protein concentration (Mp-cows) and low FCM yield and high milk protein concentration (mP-cows). Health status was determined daily and disease was defined as necessary veterinary intervention. In this study retained placenta, ketosis, lameness and mastitis occurred.
Table 1: Components and nutritional valuesof lactation diet (LD). Components,
% LD Nutritional values, % of dry matter LD MJ/kg dry matter LD energetic value, corn silage 60.0 crude ash 6.3 metabolisable energy 11.2
grass silage 23.0 crude protein 16.7 NEL 6.8
hay 4.0 crude fibre 17.2
concentrates 12.0 crude fat 3.4
mineral mix 1.0 non-fibre carbohydrates 56.4
straw 0.0 neutral detergent fibre 37.4
dry matter 45.2 acid detergent fibre 22.4
available crude protein 15.7
ruminal nitrogen
balance 0.1
1.2.
Body weight, body condition and back-fat-thickness
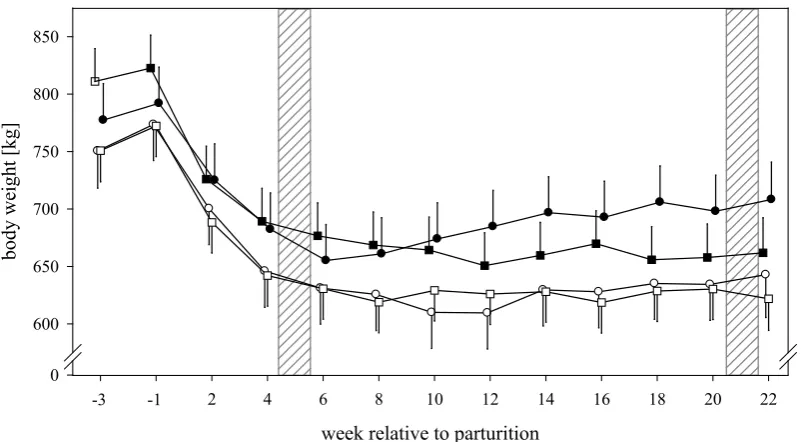
Every two weeks body weight (BW), body condition score (BCS) and back-fat-thickness (BFT) were measured (figure 1). Weighing was conducted using weighing elements underneath the claw stand (FX1, Texas Trading, Windach, Germany). Estimation of BCS was performed according to a five point scale (1 = meagre, 5 = obese) subdivided in quarter points (Edmonson et al., 1989). Thickness of subcutaneous fat was measured via ultrasound with a 7.5 megahertz probe (Universal Ultrasound, Sonovet 2000, Kretztechnik AG, Tiefenbach, Austria) in an area one handbreadth cranial of ischial tuberosity (Schröder and Staufenbiel, 2006), including skin thickness of 6 mm. The same persons conducted measurements of BCS and BFT at all times.
Figure 1: experimental design
III. Materials
and methods
17Table 1: Components and nutritional valuesof lactation diet (LD). Components,
% LD Nutritional values, % of dry matter LD MJ/kg dry matter LD energetic value, corn silage 60.0 crude ash 6.3 metabolisable energy 11.2
grass silage 23.0 crude protein 16.7 NEL 6.8
hay 4.0 crude fibre 17.2
concentrates 12.0 crude fat 3.4
mineral mix 1.0 non-fibre carbohydrates 56.4
straw 0.0 neutral detergent fibre 37.4
dry matter 45.2 acid detergent fibre 22.4
available crude protein 15.7
ruminal nitrogen
balance 0.1
1.2.
Body weight, body condition and back-fat-thickness
Every two weeks body weight (BW), body condition score (BCS) and back-fat-thickness (BFT) were measured (figure 1). Weighing was conducted using weighing elements underneath the claw stand (FX1, Texas Trading, Windach, Germany). Estimation of BCS was performed according to a five point scale (1 = meagre, 5 = obese) subdivided in quarter points (Edmonson et al., 1989). Thickness of subcutaneous fat was measured via ultrasound with a 7.5 megahertz probe (Universal Ultrasound, Sonovet 2000, Kretztechnik AG, Tiefenbach, Austria) in an area one handbreadth cranial of ischial tuberosity (Schröder and Staufenbiel, 2006), including skin thickness of 6 mm. The same persons conducted measurements of BCS and BFT at all times.
Figure 1: experimental design
1.3.
Collection of milk samples and measurement of milk composition
Milk yield was recorded with electronic milk meters (Metatron P21, GEA WestfaliaSurge GmbH, Boenen, Germany). Approximately 500 mL of milk were obtained as proportional subsamples of total milk during each morning and evening milking depending on total amount of milk and milk flow rate. Milk yield data were stored electronically (DairyPlan C21, GEA WestfaliaSurge GmbH, Boenen, Germany). Milk samples for analysis of milk components and protein fractions were taken on d 1 to 10, 12, 15, 17, 20 to 22, 32, 36, 43, 50, 57, 64, 71, 78, 85, 92, 99, 106, 113, 120, 127, 134, 137 and 155 pp. To obtain a representative sample, aliquots of morning and evening milk were composited according to the morning and evening milk yield and 5 aliquots (one with 50 mL and four with 11 mL) were stored at -20°C until analysis of progesterone, hydrocortisone, BHBA and protein fractions. From d 39 pp on, additional milk samples (11 mL) for analysis of progesterone were taken three days after weekly milk sample, resulting in two milk samples per week for progesterone monitoring. These additional milk samples were also stored at -20°C until analysis. For analysis of milk fat, protein, lactose and urea concentration as well as somatic cell count (SCC) and pH, milk samples were stored with acidiol as preserving agent at 4°C until analysis (maximum seven days) in the laboratories of Milchpruefring Bayern e.V. (Wolnzach, Germany). Analysis of total protein, fat, lactose, urea and pH were done by infrared-spectrophotometry (MilkoScan-FT-6000, VOSS GmbH, Rellingen, Germany). Measurement of SCC was conducted by fluorescence-optical counting (Fossomatic-FC, FOSS GmbH, Rellingen, Germany).
1.4.
100 day performance in previous and current lactation
Performances of milk yield, milk protein yield and milk fat yield in Leubsdorf during previous lactation were estimated from at least three milk yield recordings and calculated at LKV Sachsen (Lichtenwalde, Germany). At Veitshof, milk yield, milk fat yield as well as milk protein yield were summarised from weekly means multiplied by number of days, meaning by 7. Afterwards, milk fat yield and protein yield were divided by milk yield, to achieve milk fat and protein concentrations.
1.5.
Collection of blood samples and measurement of metabolites
III. Materials
and methods
191.6.
Tissue collection
Hepatic tissue
Liver biopsies were obtained after milking and before feeding (0650 h). Hepatic tissue was sampled at day of parturition within 24 hours after calving (d 1 pp) and at d 15 and 57 pp. On the right side of the cow, an area of 15 cm × 15 cm was shaved, washed and degreased with 70% ethanol prior to disinfection with iodine solution (Vet-Sept®, Albrecht GmbH, Aulendorf, Germany). Skin, subcutaneous and intercostal muscle tissue was desensitized with local anaesthetic (7 mL procaine hydrochloride, Procasel®, Selectavet, Weyarn, Germany). At the intersection of the 11th intercostal space with an imaginary line running from the tuber coxae to the shoulder joint (Pearson and Craig, 1980), a small incision was made through the skin to admit the trocar (12 Gauge, 2.7 mm) for the blind percutaneous needle biopsy (Bard®MagnumTM, Covington, USA). Approximately 200 mg of liver tissue were obtained and subdivided. One part was deep-frozen in liquid nitrogen and afterwards stored at -80°C. The other aliquot was transferred into RNA stabilisation solution (1 mL RNAlater®, Applied Biosystems, Darmstadt, Germany), incubated over-night at 4°C and stored at -80°C until mRNA extraction.
Muscle tissue
Muscle biopsies were performed after milking and before feeding (0650 h) at day of parturition within 24 hours after calving (d 1 pp) and at d 43 and 113 pp. An area above the intervertebral space of 3rd and 4th caudal vertebra and an area of 20 cm × 20 cm on the caudal upper distal ischial tuberosity, alternating with every biopsy on the right or the left, were washed, shaved and degreased with 70% ethanol prior to disinfection with iodine solution (Vet-Sept®, Albrecht GmbH, Aulendorf, Germany). An epidural anaesthesia (5 mL) was applied between 3rd and 4th caudal vertebra and subsequently skin of upper leg was desensitized (7 mL, both procaine hydrochloride, Procasel®, Selectavet, Weyarn, Germany). To obtain best possible sterile conditions, hands of surgeon were thoroughly washed, disinfected with ethanol and sterile gloves (Vasco OP Protect®, B. Braun Melsungen AG, Melsungen, Germany) worn throughout surgery. An incision of 2-3 cm through the skin was made one handbreadth distal of ischial tuberosity. Subcutaneous tissue was cut until semitendinous muscle became visible. Two pea-sized samples (approximately 600 mg) of semitendinous muscle were removed using surgical scissors. Samples were cut free of visible connective tissue. One aliquot was immediately deep-frozen in liquid nitrogen and stored at -80°C, another aliquot was transferred into RNA stabilization solution (1 mL RNAlater®, Applied Biosystems, Darmstadt, Germany), incubated over-night at 4°C and stored at -80°C. Muscle tissue was sutured continuously with absorbable multifilamentous suture (Surgicryl® PGA, USP 0/EP 3.5, SMI, St. Vith, Belgium) with a hemicyclic circular needle. Subcutaneous tissue and skin were adapted with single sutures, using non-absorbable multifilamentous suture (Dermafil® Green, USP 5/EP 7, SMI, St. Vith, Belgium) and three-eighths outward cutting needle. A sterile bandage was applied to the biopsied area and was renewed every three days. Furthermore, to prevent bacterial inflammations, cows subcutaneously received 1 mg ceftiofur per kg body weight (Excenel RTU®, Pfizer GmbH, Berlin, Germany) at day of biopsy and at the following day. After 10 days, the skin stitches were removed.