Radioactivity in the industrial effluent
disposed soil
R. D. Senthilkumar1,∗, R. Narayanaswamy2
and V. Meenashisundaram3
1 Department of Mathematics and Applied Sciences, Middle East College
of Information Technology - Oman
2 Department of Physics, Annamalai University - Annamalai Nagar
Tamilnadu, India
3 Department of Atomic Energy, Radiation Safety Section, Indira Gandhi
Centre for Atomic Research - Kalpakkam, Tamilnadu, India
Abstract
Studies on radiation and radioactivity distribution in the soils of ef-fluent disposed from the sugar industry in India have been conducted. The external gamma dose rates in air and natural radionuclides ac-tivities in the soils were measured using an Environmental Radiation Dosimeter and a Gamma-ray Spectrometer respectively. The soil sam-ples were also subject to various physico-chemical analyses. This study revealed some remarkable results that are discussed in the article.
1.
Introduction
It is well known that India is one of the countries in the world having the highest background radiation levels [1]. Measurement of natural radioac-tivity in soil is essential to evaluate any change induced by humans in the future and it is also required to trace the movement of radionuclides from the soil reservoir to environmental and biological systems. The primary
∗E-mail:[email protected]
source of radiation received by human beings is from the natural radioac-tivity in soils, which derives essentially from 40K and the radionuclides of the238U and 232Th decay series. The measurement of40K is also useful to agronomists for studies connected with plant nutrients [2].
Sethiyathope is one of the places of Tamilnadu in India, has been identi-fied, from the investigations made by Senthilkumaret al.[3,4], as a polluted area due to the continuous discharge of effluents containing heavy metals with toxic chemicals from the sugar industry. In the present study, an attempt has been made to explore the radiation level and to provide the baseline data for the further assessment of the impact of industrial effluents. Naturally occurring radionuclides, namely,40K, 232Th and 238U, were mea-sured in soil samples of the region, and the resultant dose in air due to these radionuclides was calculated.
2.
Materials and methods
Twenty-two sampling sites have been selected across the polluted area and soil samples were collected according to standard procedures [5]. They were labelled as S1 to S22. For the physico-chemical analyses, soil samples were processed according to the standard methods [6, 7] and the heavy metal concentration was determined using ICP-AES. To find the radioactivity lev-els, the samples were dried in an oven at 110◦C till a constant dry weight was obtained. Then these samples were powdered and sieved through a 150-μm mesh. The processed soil samples were packed in a 250 ml plastic container to its full volume with uniform mass. These containers were sealed hermetically and also sealed externally to ensure that all the daughter prod-ucts of uranium and thorium and in particular, radon isotopes formed do not escape. A time of 30 days was allowed after packing to attain secu-lar equilibrium between 226Ra and its short-lived daughter products. The net-weight of each sample was determined before counting. To reduce the contribution from background radiation while recording the spectrum in the laboratory, the samples were kept in a lead shield with a shielding efficiency of 95 percent [8].
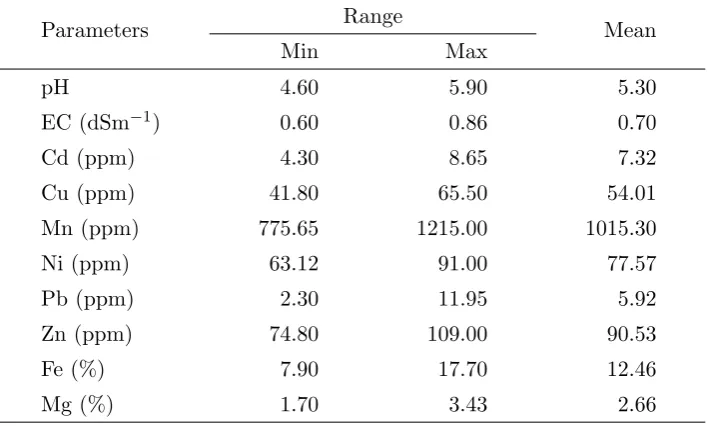
Table I: Physico-chemical parameters of soil samples.
Parameters Range Mean
Min Max
pH 4.60 5.90 5.30
EC (dSm−1) 0.60 0.86 0.70
Cd (ppm) 4.30 8.65 7.32
Cu (ppm) 41.80 65.50 54.01
Mn (ppm) 775.65 1215.00 1015.30
Ni (ppm) 63.12 91.00 77.57
Pb (ppm) 2.30 11.95 5.92
Zn (ppm) 74.80 109.00 90.53
Fe (%) 7.90 17.70 12.46
Mg (%) 1.70 3.43 2.66
3.
Results and discussions
3.1. Physico-chemical analysis of soil
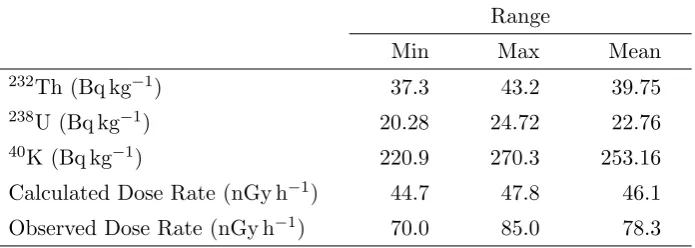
Table II: Activities and exposure dose rates of naturally occurring radionuclides in soil samples.
Range
Min Max Mean
232Th (Bq kg−1) 37.3 43.2 39.75
238U (Bq kg−1) 20.28 24.72 22.76
40K (Bq kg−1) 220.9 270.3 253.16
Calculated Dose Rate (nGy h−1) 44.7 47.8 46.1
Observed Dose Rate (nGy h−1) 70.0 85.0 78.3
essential elements, it is required only in minute amounts. However, higher concentrations of Zn, which varies from 74.8 to 109 ppm, were found in this study. As the natural abundance of Fe and Mg are more in earth, higher concentrations were noticed.
3.2. Gamma-ray spectral analysis of soil
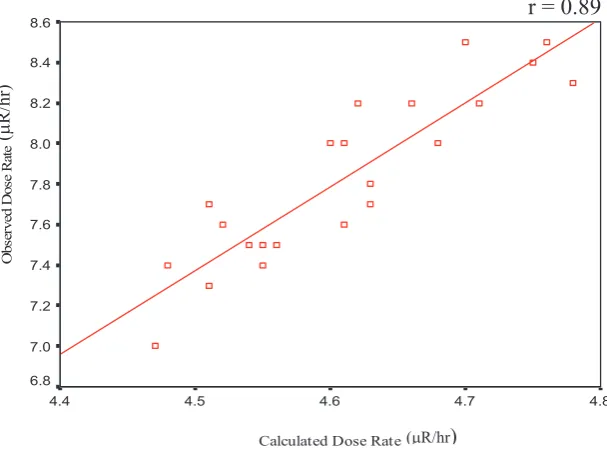
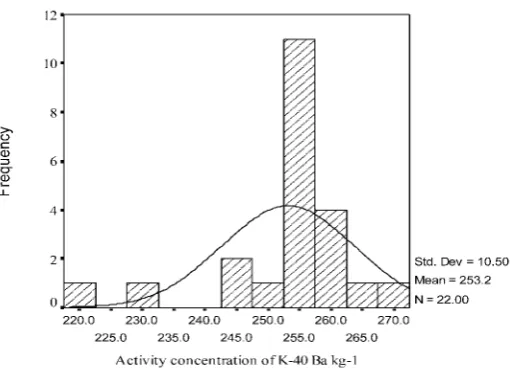
The concentration of primordial radionuclides estimated in the soil samples is presented in table II. The world average concentration of 232Th, 238U and 40K is 30, 35 and 400 Bq kg−1 [13]. When compared to the activity concentration of radionuclides with the world average value,232Th is higher by a factor of 1.33 whereas both,238U and40K, are lower by a factor of 0.62. The external dose rates have been obtained from the soil activity con-centration of the three primordial radionuclides. They are given together with the activity concentration of three primordial radionuclides for the soil samples in table II. A graphic plot [fig. 1] of observed dose rate with that of calculated using UNSCEAR [13] conversion factors yielded a good correla-tion with a co-efficient of 0.89. Figure 2 shows the frequency distribucorrela-tions of the activities of232Th,238U and40K. The activity distributions of232Th and 238U are practically symmetrical, while the left tail in the activity
Calculated Dose Rate
4.8 4.7
4.6 4.5
4.4
et
a
R
es
o
D
de
vr
es
b
O
8.6
8.4
8.2
8.0
7.8
7.6
7.4
7.2
7.0
6.8
r = 0.89
(µR/hr)
(
µ
)r
h/
R
Figure 1: Correlation between calculated and observed dose rates.
Figure 2b: Frequency distribution of238U activities.
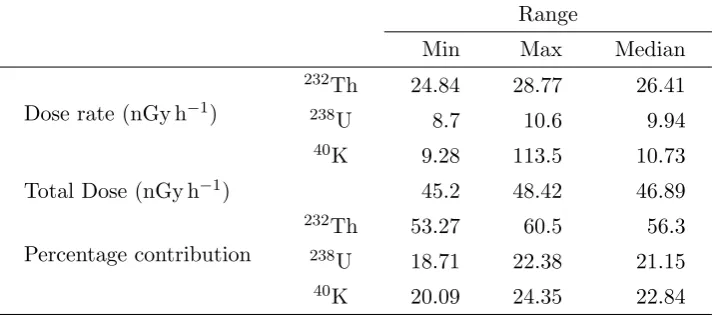
Table III: Gamma does rates from naturally occurring radionuclides.
Range
Min Max Median
Dose rate (nGy h−1)
232Th 24.84 28.77 26.41
238U 8.7 10.6 9.94
40K 9.28 113.5 10.73
Total Dose (nGy h−1) 45.2 48.42 46.89
Percentage contribution
232Th 53.27 60.5 56.3
238U 18.71 22.38 21.15
40K 20.09 24.35 22.84
3.3. Comparison of radioactivities with other environments
It was found that mean activities of238U and232Th were higher by a factor of 1.55 and 2 respectively, when compared to the Indian average values [14]. When compared to the world average values, the activity of232Th is higher by a factor of 1.33, while 238U and 40K are lower in their activities [13].
3.4. Gamma dose rates from naturally occurring
radionuclides
From the concentration of232Th, 238U and40K, the gamma dose ratesDin air were computed using the procedure reported by Becket al. [38] and the results are given in table III.
D= 0.666STh+ 0.429SU+ 0.042SK(nGy h−1), (1)
where, STh,SU, andSKis the specific activity concentration of232Th, 238U and 40K, respectively.
soils, Mishra and Sadasivam [14] have reported these percentage contribu-tions to be 33.6% and 48.7% due to232Th and40K, respectively. The world wide average values reported by UNSCEAR [16] for the radioactive contri-butions to the gamma dose rates in air from 232Th and 40K are 40% and 35%, respectively.
3.5. Correlation between heavy metals and radionuclides
An attempt has been made to study the correlation between the heavy metals and radioactive elements present in soil samples. A good correlation was observed between the 232Th activity and Fe (r = 0.76), Mg (r= 0.66), Pb (r = 0.68), Zn (r = 0.68) and Ni (r = 0.68). These heavy metals (Fe, Mg, Pb, Ni and Zn) are part of the composition of thorium bearing minerals such as Thorlanite, Yttrocrasite, Zirkelite, Brammerire-thorutite series and Polymignite [17]. So this might be one of the reasons that the activity concentration of 232Th is higher than the concentration of 238U in the soil samples.
4.
Conclusion
Gamma-ray spectral analysis of soil samples reveals the presence of 232Th, 238U and40K in all the sites of the studied area. The activity concentration
of 232Th is higher than 238U. A good correlation was observed between 232Th and Fe, Mg, Pb, Zn, and Ni, which are in the composition of thorium
bearing elements. The median of the gamma dose rate of 46.89 nGy h−1, is due to the presence of 232Th, 238U and 40K. It is lower compared to the world average value. The data obtained in this study will serve as a baseline survey for primordial radionuclide concentration in soil.
Acknowledgement
References
[1] Nambi K.S.V., A review of the studies on the high background
radi-ation areas of the world in,III Proceedings of the National Symposium on Environment, Thiruvanandapuram, 1994.
[2] BARC Report, Distribution of Natural Radioactivity and Trace ele-ments in the soils and sands from the high radiation coastal belt of India, Health Physics Division, BARC, Mumbai, 1974.
[3] Senthilkumar R.D., Narayanaswamy R. and Sriramachan-drasekaran M.V.,Journal of Current Science,2(2) (2002) 123.
[4] Senthilkumar R.D. and Narayanaswamy R.,Indian Journal
En-vironmental Protection,22(7) (2002) 746-749.
[5] Baeza A., Delrio M., Miro C.and Pumiagua J.,Journal of Env.
Radioactivity,23(1992) 19.
[6] Piper C.S.,Soil and Plant Analysis (Hans Publishers, Bombay) 1966.
[7] Alam M.D., Hug S.M.I., Shafique S.M. and Alam K.,A
Hand-book on chemical analyses of soil, plant and water (Dhaka, Bungladesh) 1991.
[8] Beck H.L.,The Natural Radiation Environment – II, USDOE
CONF-720805-PL (NTIS, Springfield, Virginia) 1972.
[9] Rao J.K.,Ecol. Env. & Cons., 5 (1999) 391.
[10] Sharma B.L., Sharma S., Prasad K.andSrivastava P.N.,Indian
Journal of Agricultural Chemistry,XXX(1) (1997) 15.
[11] De Han F.A.M. and Zwerman P.J., Pollution of soil in G.H. Bolt
and M.G.M. Bruggenwert, eds,Soil Chemistry (Elsevier, Amsterdam) 1976.
[12] Rosales H.L., Carranza E.A. and Lopez H.M., Environmental
Geology,39(3-4) (2000).
[14] Mishra U.C. and Sadasivam S., J. Sci. Industrial Res., 30 (1971)
59.
[15] Narayana Y., Somashekarappa H.M., Karimalara. N., Avad-hani D.N.and Mahesh H.M.,Health Physics,80(1) (2001) 25.
[16] United National Scientific Committee on the Effects of Atomic Radi-ation, Source and effects and risks of ionizing radiation.Report to the General Assembly with annexes (United Nations, NY) 1982.
[17] Durrance E.L., Radioactivity in Geology (Ellis Horwood Ltd., John