Article
Discrimination of Beer Based on E-tongue and E-nose
Combined with SVM: Comparison of Different
Variable Selection Methods by PCA, GA-PLS and VIP
Hong Men, Yan Shi, Songlin Fu, Yanan Jiao, Yu Qiao and Jingjing Liu *
College of Automation Engineering, Northeast Electric Power University, Jilin 132012, China; [email protected] (H.M.); [email protected] (Y.S.); [email protected] (S.F.); [email protected] (Y.J.); [email protected] (Y.Q.)
* Correspondence: [email protected]; Tel.: +86-432-6480-7283; Fax: +86-432-6480-6238
Abstract: Multi-sensor data fusion of E-tongue and E-nose can provide a more comprehensive and more accurate analysis results. However, it also brings some redundant information, it is a hot issue to reduce the feature dimension for pattern recognition. In this paper, the taste-olfactory data fusion based on E-tongue and E-nose combined with Support Vector Machine (SVM) was used to classify five different beers. First, the taste and olfactory feature information were obtained based on E-tongue and E-nose. Second, the original feature data of single system were fused, then Principal Component Analysis (PCA) was applied to extract principal components, Genetic Algorithm-Partial Least Squares (GA-PLS) was used to select the characteristic variables, 20 subsets were generated with those variables based on the best Variable Importance of Projection (VIP) score. Finally, the classification models based on SVM were established, also c and g of SVM were calculated by Grid Search (GS), Genetic Algorithm (GA), and Particle Swarm Optimization (PSO), the classification results of all subsets were obtained. The results showed that the classification accuracy using data fusion was much higher over single E-tongue and single E-nose, and the variable selection method by VIP had the best classification performance in #12 subset coupled with GA-SVM.
Keywords: E-tongue; E-nose; data fusion; variable selection; patter recognition; beer
1. Introduction
Beer, as a beverage, consumption is only second to water and tea in the world. It is rich in various amino acids, vitamins and other nutrients needed by human body[1, 2], which known as the ‘liquid bread’. Barley germination as the main raw material for beer brewing, which makes beer a low alcohol and nutritious value drink, which can promote digestion, appetizers, spleen, appetite and other functions[3-5]. At the same time, the organic acids reduce excessive excitement and ease the tension.
Beer flavor information is one of the reference factors that reflect the characters of beer. Flavor consists of taste and olfactory information. An important observation was obtained in the psychology literature that the intensity of the senses was overlapped, and people usually mistaken that volatile substances as ‘taste’[6]. When we cannot smell, it is difficult to distinguish apple and potato, red wine and coffee. The odor of food can stimulate people to produce salivation, which improves our sensation. When drink fruit juice with nose squeezed, there are sweet and sour in mouth. Set the nose free after drinking, the fruit juice flavor information will appear, so the taste of food must be fully dependent on both the tongue and nose[7]. Conventional physical and chemical indicators can be carried out to achieve quantitative analysis of beer, but the overall
time-consuming, cannot reflect the flavor characteristics of beer[8-10]. The most used method is the sensory evaluation[11], but the method is quite subjective, which the evaluation result changes with the physical condition, psychological factor and emotion of the tasters. It is time-consuming and low efficiency. E-tongue and E-nose as an objective and effective intelligent bionic instrument could evaluate beer quickly. It operates simple with high precision, time-saving among other advantages make it gradually replaces the traditional detection method. The emerging sensor technology has been developed in food industry[12, 13], medical[14, 15], environmental protection[16, 17] and other fields[18, 19].
The beer favor consists of both taste and olfactory. E-tongue and E-nose can be used as taste-detector and olfactory-detector respectively. This feature of beer is complex due to its composition and concentration. Therefore, E-tongue and E-nose fusion system has a great advantage on getting taste and olfactory overall information.
The combined information based on instrument is called data fusion[20]. Data fusion methods can be divided into data-level fusion (low-level), feature-level fusion (medium-level) and decision-level fusion (high-level). The data-level fusion combines the original sensing information of multiple detection instruments to obtain a new data. The feature-level fusion combines features extracted from the original sensing information of multiple detection instruments. The decision-level fusion combines sensor information after each sensor has made a preliminary determination, then fuse to obtain a final decision. In current researches, most tongue-nose data fusions were mainly low level fusions, less mediate-level fusions were applied, far less high-level fusions were adopted. Hong M. et al. applied data-level fusion of E-tongue and E-nose based on PCA combined with PLS to predict the blending ratio of the old frying oil[21]. Zakaria A. et al. applied data-level fusion of E-tongue and E-nose based on PCA and Linear Discriminant Analysis (LDA) combined with Probabilistic Neural Network (PNN) to classification 18 different samples of honey[22]. Haddi Z. et al. applied data-level fusion of E-tongue and E-nose to improve the recognition result of fruit juice samples[23]. Liu L. et al. applied data-level fusion of E-tongue and E-nose combined with PCA-SVM, PCA-KNN, LLE-SVM and LLE-KNN to classification rice[24]. Banerjee B. et al. applied feature-level fusion from E-tongue and E-nose to classification and prediction of tea taste scores[25]. Hong X. et al. applied four different data fusion approaches to detect the adulteration in cherry tomato juices based on E-tongue and E-nose[26]. The previous research work showed that multi-sensor data fusion between the classification of food and quality assessment is much closer to the human perception mode. However, although data fusion brings about the above advantages, it brings some uninformative, even noisy information. Therefore, seek a way to select the relevant feature variables and find a better expression form are particularly significant to obtain a better classification results.
Figure 1. The graphical abstract for this paper
2. Materials and Methods
2.1 Beer samples
Five different beers were used in this study, and their alcohol degree, original wort concentration, raw materials were copied from the beer bottle labels. Table 1 lists all of these.
Table 1. Characteristics of sampled beers
Brand Alcohol
Content(%vol)
Original Wort
Concentration(°P)
Raw and auxiliary
materials
Landai ≥4.3 11 Water, malt, rice, hops
Xuehua ≥3.3 9 Water, malt, rice, hops
Baiwei ≥3.6 9.7 Water, malt, wheat, hops
Harbin ≥3.6 9.1 Water, malt, rice, hops
Qingdao ≥4.3 11 Water, malt, rice, hops
2.2 Data acquisition of intelligent bionic detection 2.2.1 E-tongue data acquisition
SA-402B E-tongue developed by Japan Insent Company was used to gather beer taste information. The instrument includes sensor array, automatic detection system, data acquisition system and data analysis software. The sensor array consists of five taste sensors based on artificial bimolecular membranes and two reference electrodes. The sensor AAE was applied to detect umami substances. The sensor CT0 was applied to detect salty substances. The sensor CA0 is applied to detect sour substances. The sensor C00 was applied to detect bitter substances. The sensor AE1 was applied to detect astringent substances. The reference electrodes include the positive and negative reference electrodes.
electrode and the reference electrode is measured. Take 40 ml of the tested beer samples, then put into the clean measuring cups. Before the test begins, the sensor was cleaned in the positive and negative cleaning solution for 90s, after which it was cleaned in the reference solution for 120s, and then repeated in another reference solution. After the balance was reached in reference solution, the test got started, 30s for each sample, then cleaned the sensor for 2 times quickly, and returned the reference solution to measure the aftertaste value (cpa), the measurement completed for one time. After each measurement, the sensor cleaning runs automatically. Each beer brand offered 6 samples, and each group of samples repeated the measurement for 3 times. Finally, each brand of beer got 18 sets of data, 90 sets of sample data in total were obtained. The experimental temperature was (20(0.5) , and the relative humidity was (65(2)℃ ((H. The intensity value of each sensor at the 30th second was extracted and analyzed in this study. The SA-402B E-tongue was shown in Figure 2.
Figure 2. The SA-402B E-tongue system
2.2.2 E-nose data acquisition
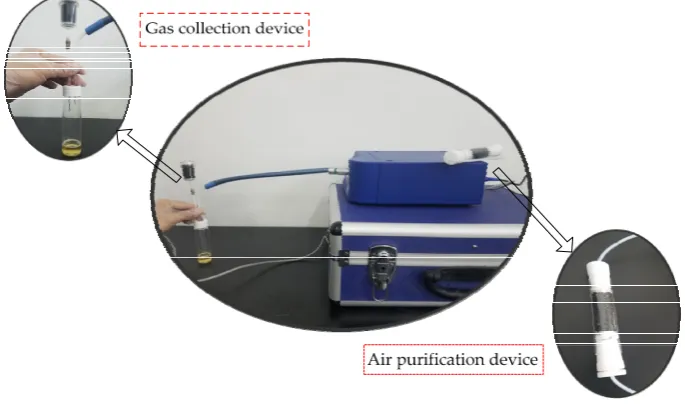
PEN3 E-nose developed by Germany Airsence Company was used to gather beer olfactory information. The instrument includes a gas collection device, a gas detection unit and a air purification device. The gas detection unit includes a sensor array and a pattern recognition analysis and processing system. The sensor array contains 10 metal oxide gas sensors, which can achieve the detection of olfactory cross-sensitive information. The components to be detected by sensors were listed as below: aromatic(W1C), broad range(W5S), aromatic(W3C), hydrogen(W6S), arom-aliph (W5C), broad-methane(W1S), sulfur-organic(W1W), broad-alcohol(W2S), sulfur-chlorine(W2W) and methane-aliphatic(W3S).
The intensity value of each sensor at the 60th second was extracted and analyzed in this study. The PEN3 E-nose system was shown in Figure 3.
Figure 3. The PEN3 E-nose system
2.3 Variable Selection
Principal Component Analysis (PCA) is one of the multivariate statistical analyses. It can transform the data into the new coordinate system, converting the multivariate into several synthetic variables. PCA preserves the useful information of the original variable, reduces the dimension of the multidimensional data set, and extracts the principal component. The number of principal components was calculated according to the maximum variance principle. We determined the number of principal components according to the cumulative contribution rate and practical requirements. In this work, in order to obtain as much information as possible from the original feature variables, we made sure that the principal component with cumulative variance contribution was more than 99(.
GA-PLS first proposed by Leardi ([27], and applied[28, 29].The feature variables of the original feature data were screened by Genetic Algorithm-Partial Least Squares (GA-PLS) to remove redundant variables for constructing the classification model. In the process of variable selection, a randomization test used to determine whether it can be applied to GA-PLS for the original variable feature screening (random test value is less than 5). With the increase of the number of selected variables, the cross-validated exceptions variance (CV () value gradually increases, and finally it reaches it’s maximum, and maintain a relatively stable state. In the calculation process, the chromosome corresponding to the highest CV( is the best optimal variable subset.
2.4 Multivariate Analysis
SVM first proposed by Cortes and Vapnik[30], which is a supervised learning model, used for pattern recognition. The main idea is to establish a classification hyper plane as decision plane. The SVM uses the kernel function to map the data to the high-dimensional space, making it as linear as possible. The kernel functions in SVM include linear kernel, polynomial kernel, radial basis kernel ((BF), Fourier kernel, Spine kernel and Sigmoid nucleus. Compared with the kernel function and previous studies, the (BF kernel function gave an excellent classification performance[31, 32]. Whether small sample or large sample, high dimension or low dimension, the (BF kernel function is applicable. Therefore, this paper used (BF as SVM classification kernel function. The (BF kernel function needs to determine the parameters, and the kernel function parameters directly affect the complexity of the function. So, Grid Search (GS), Genetic Algorithm (GA) and Partical Swarm Optimization (PSO) were combined with SVM to optimize the penalty parameter c and the kernel function parameter g. In the process of finding the best parameters, the accurate rate was calculated under 5-fold cross validation (5-CV), the best c and g were selected when reached the highest CVAccuracy was obtained.
3 Results and discussion
3.1 Pre-processing
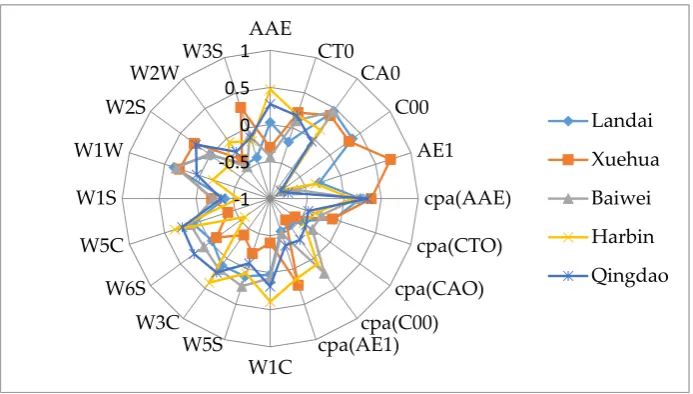
The detection data of E-tongue and the E-nose contained 10-dimension feature variables respectively. Data from the two systems were combined to form a single data for describing the flavor information of beer. A normalization between (-1, +1) was implemented on the origins feature data from different sensors of E-tongue and E-nose. Figure 4 showed the averaged-value radar plot of normalized response of different sensors. According to the sensor response information, it was difficult to identify the different samples, the relationship between the sensors data was extremely complex. So, data fusion and feature variable screening were particularly important for correctly distinguishing beer brands.
Figure 4. A radar plot of the different sensors to five beer samples -1
-0.5 0 0.5 1
AAE CT0
CA0
C00
AE1
cpa(AAE)
cpa(CTO)
cpa(CAO) cpa(C00) cpa(AE1) W1C
W5S W3C W6S W5C W1S W1W
W2S W2W
W3S
Landai
Xuehua
Baiwei
Harbin
3.2 Extraction of cross-perception sensor characteristic variables
E-tongue and E-nose provided twenty variables for beer, sensors in E-tongue and E-nose were cross-sensitive to different ingredients of sample. So the sensors information of beer samples contained overlapped information. This problem may be solved by PCA. In order to acquire as much information as possible from the original fusion feature data, the 10 principal components were extracted, which accumulated variance contribution rate was up to 99.99(.
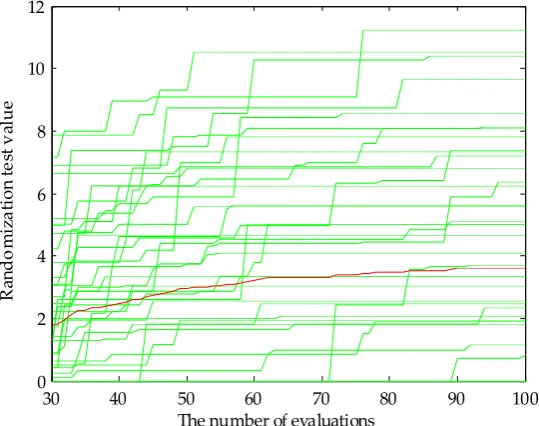
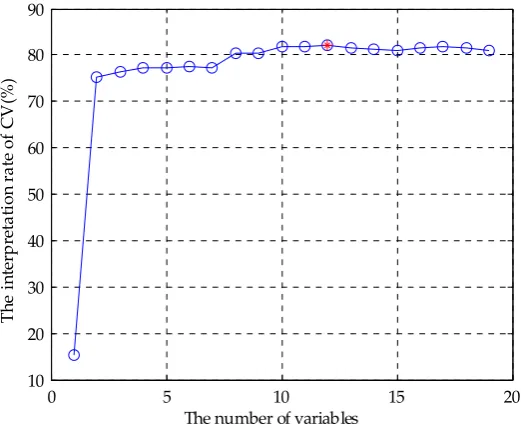
Before applying the GA-PLS to select variables, a randomization test was required to determine whether the it could be applied to GA-PLS for the original variable feature screening. Figure 5 showed the randomized test result of the fusion data of E-tongue and E-nose. It could be seen that the random test value was less than 5, indicating that the application of GA-PLS was reliable. Figure 6 showed the GA-PLS search result for the best number of variables, it could be seen that the cross-validated exceptions variance (CV () increased rapidly and then gradually with the number of variables increases. When CV( reached a maximum 82.169(, the number of variables reached 12, then the number of variables continued to increase, the CV( decreased slightly and stayed in a relatively stable state. On the contrary, in Figure 7, with the increase of the number of variables, (MSECV decreased rapidly and then gradually, when the number of variables reached 12 the (MSECV arrived to its minimum value 0.5937, then the number of variables continued to increase, (MSECV increased slightly and maintained in a relatively stable state. Finally, 12 characteristic variables were extracted from the fusion data, which were CA0, C00, AE1, AAE, cpa(C00), W1C, W5S, W6S, W1S, W1W, W2S and W2W.
Figure 5. (andomization test result
30 40 50 60 70 80 90 100
0 2 4 6 8 10 12
The number of evaluations
(
and
o
mi
za
ti
o
n
t
e
st
v
al
u
Figure 6. CV( change curve
Figure 7. (MSECV change curve
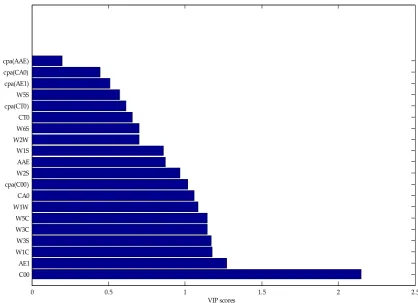
Figure 8 showed the VIP score of E-tongue and the E-nose original variables. We generated the variable subsets which would be used to build the classification models. Each subset was generated with those variables based on the best VIP score. Subset #1 included C00, subset #2 included C00 and AE1, and the last #20 contained all the variable of E-tongue and the E-nose. When we gradually accumulated the number of variables, and observed the classification results of the models, then achieved the purpose of filtering redundant information was feasible[33]. In this way, we not only obtained the best subset to achieve the purpose of reducing redundant variables, but also observed the classification tendency of SVM when variable was added gradually.
0 5 10 15 20
10 20 30 40 50 60 70 80 90
The number of variables
T
h
e
i
n
te
rp
re
ta
ti
o
n
r
a
te
o
f
C
V
(
(
)
0 5 10 15 20
0.4 0.6 0.8 1 1.2 1.4
The number of variables
(
MS
E
C
Figure 8. (anking the importance of variables based on the VIP score
3.3 Results of the SVM Models
Five kinds of beer samples were divided into 90 groups, 2/3 of which as training set, rest of it as testing set. The training set was used to establish the SVM classification models. The testing set was used to achieve classification prediction.
The optimize parameter c and g of SVM models was calculated using 5-fold cross validation, and the best cross-validation accuracy was picked. In the GS methods, log2c and log2g range from [-10, 10] at an interval of 0.5 made a calculation with c and g. The initialize parameters of GA and PSO methods following: maximum generation was 100, population was 20, the search range of c was 0 to 100, that of g was 0 to 1000.
Table 2 showed the classification results of single E-tongue, E-nose and original fusion feature data based on GS-SVM, GA-SVM and PSO-SVM. The classification accuracy of GS-SVM for E-tongue was 76.67(, E-nose was 76.67(, the original fusion feature data was 90(. The classification accuracy of GA-SVM for E-tongue was 83.33(, E-nose was 83.33(, and the original fusion feature data was 90(. The accuracy rate of PSO-SVM for E-tongue was 73.33(, E-nose was 86.67(, the original fusion feature data was 90(. It could be seen that the classification accuracy increased by using data fusion.
0 0.5 1 1.5 2 2.5
C00 AE1 W1C W3S W3C W5C W1W CA0 cpa(C00) W2S AAE W1S W2W W6S CT0 cpa(CT0) W5S cpa(AE1) cpa(CA0) cpa(AAE)
VIP scores
Va
ri
ab
le
Table 2. Comparison of results for single E-tongue, E-nose, and fusion feature data
Data set Accuracy (%)
GS-SVM GA-SVM PSO-SVM
E-tongue 76.67 83.33 73.33
E-nose 76.67 83.33 86.67
E-tongue and E-nose 90 90 90
Table 3 showed the classification results of the original fusion feature data, the data set that the 10 principal components were extracted by PCA, and the data set that 12 characteristic variables were selected by the GA-PLS. It could be seen that the PCA extracted principal components did not improve the classification results, and even the classification accuracy decreased, PSO-SVM dropped to 86.67(, GS-SVM even dropped to 83.33(, only GA-SVM classification results still was 90(. It may be used as an unsupervised learning method without introducing classified information and compressing data only, it may lose effective authentication information and did not remove redundant information effectively. However, compared with the 10 principal components extracted by PCA and the original feature fusion data, the 12-dimensional characteristic variables selected by GA-PLS got a better classification results, the classification accuracy rate of GS-SVM was 93.33(, GA-SVM and PSO-SVM reached 96.67(. It showed that GS-PLS removed some redundant information of the original fusion data and selected the effective feature variables to improve the classification accuracy.
Table 3. Comparison of results for different fusion feature data set
Data set Accuracy (%)
GS-SVM GA-SVM PSO-SVM
E-tongue and E-nose 90 90 90
PCA(E-tongue and E-nose) 83.33 90 86.67
GA-PLS(E-tongue and E-nose) 93.33 96.67 96.67
Table 4. Comparison of accuracy based on different classification models using different subsets of
variables based on VIP
Subset Variables Accuracy (%)
GS-SVM GA-SVM PSO-SVM
#1 C00 43.33 30 43.33
#2 C00+AE1 70 70 70
#3 C00+AE1+W1C 70 66.67 76.67
#4 C00+AE1+W1C+W3S 73.33 73.33 73.33
#5 C00+AE1+W1C+W3S+W3C 73.33 73.33 73.33
#6 C00+AE1+W1C+W3S+W3C+W5C 76.67 80 73.33
#7 C00+AE1+W1C+W3S+W3C+W5C+W1W 86.67 90 90
#8 C00+AE1+W1C+W3S+W3C+W5C+W1W+CA0 90 83.33 83.33 #9 C00+AE1+W1C+W3S+W3C+W5C+W1W+CA0+cpa(C00) 83.33 83.33 80 #10 C00+AE1+W1C+W3S+W3C+W5C+W1W+CA0+cpa(C00)+
W2S
86.67 86.67 83.33
#11 C00+AE1+W1C+W3S+W3C+W5C+W1W+CA0+cpa(C00)+ W2S+AAE
96.67 90 96.67
#12 C00+AE1+W1C+W3S+W3C+W5C+W1W+CA0+cpa(C00)+ W2S+AAE+W1S
93.33 100 96.67
#13 C00+AE1+W1C+W3S+W3C+W5C+W1W+CA0+cpa(C00)+ W2S+AAE+W1S+W2W
100 100 96.67
#14 C00+AE1+W1C+W3S+W3C+W5C+W1W+CA0+cpa(C00)+ W2S+AAE+W1S+W2W+W6S
96.67 96.67 96.67
#15 C00+AE1+W1C+W3S+W3C+W5C+W1W+CA0+cpa(C00)+ W2S+AAE+W1S+W2W+W6S+CT0
96.67 96.67 96.67
#16 C00+AE1+W1C+W3S+W3C+W5C+W1W+CA0+cpa(C00)+ W2S+AAE+W1S+W2W+W6S+CT0+cpa(CT0)
96.67 96.67 96.67
#17 C00+AE1+W1C+W3S+W3C+W5C+W1W+CA0+cpa(C00)+ W2S+AAE+W1S+W2W+W6S+CT0+cpa(CT0)+W5S
96.67 96.67 96.67
#18 C00+AE1+W1C+W3S+W3C+W5C+W1W+CA0+cpa(C00)+ W2S+AAE+W1S+W2W+W6S+CT0+cpa(CT0)+W5S+cpa( AE1)
96.67 90 96.67
#19 C00+AE1+W1C+W3S+W3C+W5C+W1W+CA0+cpa(C00)+ W2S+AAE+W1S+W2W+W6S+CT0+cpa(CT0)+W5S+cpa( AE1)+cpa(CA0)
90 90 90
#20 C00+AE1+W1C+W3S+W3C+W5C+W1W+CA0+cpa(C00)+ W2S+AAE+W1S+W2W+W6S+CT0+cpa(CT0)+W5S+cpa( AE1)+cpa(CA0)+cpa(AAE)
90 90 90
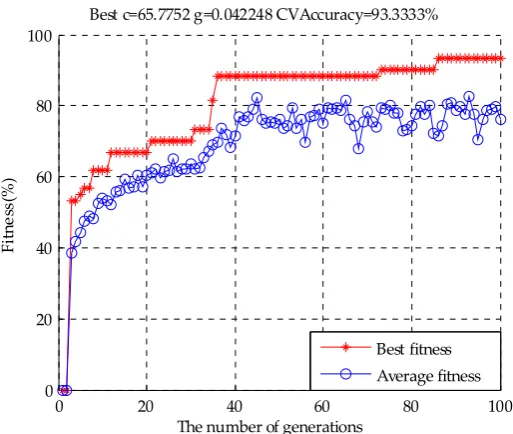
the best c was 27.5926. and best g was 0.092793. Figure 11 showed the fitness curve of GA based on the #13 subset, the best c was 65.7752 and best g was 0.042248. Compared with GS, the smallest penalty factor c of GA was obtained based on the #12 subset, which was suitable for the SVM analysis. The classification result of testing set was shown in Figure 12. Finally, we can think that 12 characteristic variables were extracted from the original fusion feature data, which were C00, AE1, CA0, cpa(C00), AAE, W1C, W3S, W3C, W5C, W1W and W2S. An interesting phenomenon was that the five taste variables were extracted based on the GA-PLS and VIP variable selection methods were consistent. But the olfactory variable extraction was different, it may be the fact that the taste sensor was a description of the basic taste and the olfactory sensor was cross sensitive. We could think that the main taste substances of beer flavor were sour, bitter, astringency, umami, and the aftertaste of bitter. The olfactory substances were aromatic aromatic, alcohol and alkenes.
Figure 9. The parameter selection result 3D plot by GS for #13 subset
Figure 10. The parameter optimization fitness curve by GA for #12 subset -10 -5
0
5 10
-10 0
10 40 60 80 100
log2c Best c=337.794 g=0.0089742 CVAccuracy=95(
log2g
A
ccu
ra
cy
(
(
)
0 20 40 60 80 100
40 50 60 70 80 90 100
The number of generations
Fi
tn
e
ss
(
(
)
Best c=27.5926 g=0.092793 CVAccuracy=91.6667(
Figure 11. The parameter optimization fitness curve by GA for #13 subset
Figure 12. The classification result of SVM
4 Conclusions
Based on two kinds of efficient and objective bionic detection systems (E-tongue and E-nose), this paper compared different variable selection methods to realize the qualitative classification of beer. The main work and conclusions were as follows:
(1) Based on the E-tongue and E-nose bionic detection system to achieve intelligent access of the taste information and olfactory information of five different beers. The two detection equipment response information radar plot could be seen, the overall difference of five beer samples was described.
(2) The original feature data of the two bionic detection systems were fused, then PCA extracted 10 principal components, and GA-PLS screened 12 characteristic variables, 20 subsets were generated with those variables based on the best VIP score.
0 20 40 60 80 100
0 20 40 60 80 100
The number of generations
Fi
tn
e
ss
(
(
)
Best c=65.7752 g=0.042248 CVAccuracy=93.3333(
Best fitness Average fitness
0 5 10 15 20 25 30
1 1.5 2 2.5 3 3.5 4 4.5 5
Tesing set of samples
Ca
te
g
o
ry
l
abe
l
(3) The results showed that the recognition rate of the fusion system was better than the single system. Specially, comparison of classification results of different variable selection methods, the VIP combined with GA-SVM showed the best classification accuracy in #12 subset was up to 100(, then compared with GS-SVM in #13 subset, a relatively small penalty factor was obtained. Analysis the main taste substances of beer flavor were sour, bitter, astringency, umami, and the aftertaste of bitter, and the olfactory substances were aromatic aromatic, alcohol and alkenes.
This study shown that discrimination of beer based on E-tongue and E-nose: comparison of different variable selection methods, which offered an effective intelligent way for beer classification. It can be applied to the beer production quality supervision, identify the authenticity, taste-olfactory fusion information regression prediction and so on.
Supplementary Materials: Figure S1: The experiment table, Figure S2: The chemical preparation of drugs, Figure S3: The glass instrument, Figure S4: The experimental solution, Figure S5: Other materials, Figure S6: The specimen bottle, Figure S7: The ultrasonic cleaner, Figure S8: The magnetic stirrer, Figure S9: The balance, Figure S10: The experimental exhaust fan, Table S1: The data of #1 subset, Table S2: The data of #2 subset, Table S3: The data of #3 subset, Table S4: The data of #4 subset, Table S5: The data of #5 subset, Table S6: The data of #6 subset, Table S7: The data of #7 subset, Table S8: The data of #8 subset, Table S9: The data of #9 subset, Table S10: The data of #10 subset, Table S11: The data of #11 subset, Table S12: The data of #12 subset, Table S13: The data of #13 subset, Table S14: The data of #14 subset, Table S15: The data of #15 subset, Table S16: The data of #16 subset, Table S17: The data of #17 subset, Table S18: The data of #18 subset, Table S19: The data of #19 subset, Table S20: The data of #20 subset, Table S21: The data of 10 principal components extracted by PCA, Table S22: The data of 12 characteristic variables selected by GA-PLS, Table S23: The data of E-nose, Table S24: The data of E-tongue, Table S25: The original feature fusion data, Table S26: VIP score, and the code of Matlab.
Acknowledgments: This work was supported by the National Natural Science Foundation of China (No. 31401569), the Key Science and Technology Project of Jilin Province (20170204004SF), and the Graduate Innovation Fund Project of Northeast Electric Power University (Y2016018).
Author Contributions: Hong Men and Jingjing Liu conceived the experiment and analytical methods. Yan Shi analyzed the data and wrote the paper. Songlin Fu and Yanan Jiao performed the E-tongue and E-nose experiment to obtain the taste and olfactory information. Yu Qiao extracted the taste and olfactory characteristic information.
Conflicts of Interest: The authors declare no conflict of interest.
Appendix
Figure A2. The SA-402B E-tongue system
Figure A3. The PEN3 E-nose system
Figure A4. A radar plot of the different sensors to five beer samples -1
-0.5 0 0.5 1
AAE CT0
CA0 C00
AE1
cpa(AAE)
cpa(CTO)
cpa(CAO) cpa(C00) cpa(AE1) W1C
W5S W3C W6S W5C W1S W1W
W2S W2W
W3S
Landai
Xuehua
Baiwei
Harbin
Figure A5. (andomization test result
Figure A6. CV( change curve
30 40 50 60 70 80 90 100 0
2 4 6 8 10 12
The number of evaluations
(
and
o
mi
za
ti
o
n
t
e
st
v
al
u
e
0 5 10 15 20
10 20 30 40 50 60 70 80 90
The number of variables
T
h
e
i
n
ter
p
re
ta
ti
o
n
r
a
te
o
f
C
V
(
(
Figure A7. (MSECV change curve
Figure A8. (anking the importance of variables based on the VIP score
0 5 10 15 20
0.4 0.6 0.8 1 1.2 1.4
The number of variables
(
MS
E
C
V
0 0.5 1 1.5 2 2.5
C00 AE1 W1C W3S W3C W5C W1W CA0 cpa(C00) W2S AAE W1S W2W W6S CT0 cpa(CT0) W5S cpa(AE1) cpa(CA0) cpa(AAE)
VIP scores
Va
ri
ab
le
Figure A9. The parameter selection result 3D plot by GS for #13 subset
Figure A10. The parameter optimization fitness curve by GA for #12 subset -10 -5
0
5 10
-10 0
10 40 60 80 100
log2c Best c=337.794 g=0.0089742 CVAccuracy=95(
log2g
A
ccu
ra
cy
(
(
)
0 20 40 60 80 100
40 50 60 70 80 90 100
The number of generations
Fi
tn
e
ss
(
(
)
Best c=27.5926 g=0.092793 CVAccuracy=91.6667(
Figure A11. The parameter optimization fitness curve by GA for #13 subset
Figure A12. The classification result of SVM
0 20 40 60 80 100
0 20 40 60 80 100
The number of generations
Fi
tn
e
ss
(
(
)
Best c=65.7752 g=0.042248 CVAccuracy=93.3333(
Best fitness Average fitness
0 5 10 15 20 25 30
1 1.5 2 2.5 3 3.5 4 4.5 5
Tesing set of samples
Ca
te
g
o
ry
l
abe
l
Table A1. Characteristics of sampled beers
Brand Alcohol
Content(%vol)
Original Wort
Concentration(°P)
Raw and auxiliary
materials
Landai ≥4.3 11 Water, malt, rice, hops
Xuehua ≥3.3 9 Water, malt, rice, hops
Baiwei ≥3.6 9.7 Water, malt, wheat, hops
Harbin ≥3.6 9.1 Water, malt, rice, hops
Qingdao ≥4.3 11 Water, malt, rice, hops
Table A2. Comparison of results for single E-tongue, E-nose, and fusion feature data
Data set Accuracy (%)
GS-SVM GA-SVM PSO-SVM
E-tongue 76.67 83.33 73.33
E-nose 76.67 83.33 86.67
E-tongue and E-nose 90 90 90
Table A3. Comparison of results for different fusion feature data set
Data set Accuracy (%)
GS-SVM GA-SVM PSO-SVM
E-tongue and E-nose 90 90 90
PCA(E-tongue and E-nose) 83.33 90 86.67
Table A4. Comparison of accuracy based on different classification models using different subsets of
variables based on VIP
Subset Variables Accuracy (%)
GS-SVM GA-SVM PSO-SVM
#1 C00 43.33 30 43.33
#2 C00+AE1 70 70 70
#3 C00+AE1+W1C 70 66.67 76.67
#4 C00+AE1+W1C+W3S 73.33 73.33 73.33
#5 C00+AE1+W1C+W3S+W3C 73.33 73.33 73.33
#6 C00+AE1+W1C+W3S+W3C+W5C 76.67 80 73.33
#7 C00+AE1+W1C+W3S+W3C+W5C+W1W 86.67 90 90
#8 C00+AE1+W1C+W3S+W3C+W5C+W1W+CA0 90 83.33 83.33 #9 C00+AE1+W1C+W3S+W3C+W5C+W1W+CA0+cpa(C00) 83.33 83.33 80 #10 C00+AE1+W1C+W3S+W3C+W5C+W1W+CA0+cpa(C00)+
W2S
86.67 86.67 83.33
#11 C00+AE1+W1C+W3S+W3C+W5C+W1W+CA0+cpa(C00)+ W2S+AAE
96.67 90 96.67
#12 C00+AE1+W1C+W3S+W3C+W5C+W1W+CA0+cpa(C00)+ W2S+AAE+W1S
93.33 100 96.67
#13 C00+AE1+W1C+W3S+W3C+W5C+W1W+CA0+cpa(C00)+ W2S+AAE+W1S+W2W
100 100 96.67
#14 C00+AE1+W1C+W3S+W3C+W5C+W1W+CA0+cpa(C00)+ W2S+AAE+W1S+W2W+W6S
96.67 96.67 96.67
#15 C00+AE1+W1C+W3S+W3C+W5C+W1W+CA0+cpa(C00)+ W2S+AAE+W1S+W2W+W6S+CT0
96.67 96.67 96.67
#16 C00+AE1+W1C+W3S+W3C+W5C+W1W+CA0+cpa(C00)+ W2S+AAE+W1S+W2W+W6S+CT0+cpa(CT0)
96.67 96.67 96.67
#17 C00+AE1+W1C+W3S+W3C+W5C+W1W+CA0+cpa(C00)+ W2S+AAE+W1S+W2W+W6S+CT0+cpa(CT0)+W5S
96.67 96.67 96.67
#18 C00+AE1+W1C+W3S+W3C+W5C+W1W+CA0+cpa(C00)+ W2S+AAE+W1S+W2W+W6S+CT0+cpa(CT0)+W5S+cpa( AE1)
96.67 90 96.67
#19 C00+AE1+W1C+W3S+W3C+W5C+W1W+CA0+cpa(C00)+ W2S+AAE+W1S+W2W+W6S+CT0+cpa(CT0)+W5S+cpa( AE1)+cpa(CA0)
90 90 90
#20 C00+AE1+W1C+W3S+W3C+W5C+W1W+CA0+cpa(C00)+ W2S+AAE+W1S+W2W+W6S+CT0+cpa(CT0)+W5S+cpa( AE1)+cpa(CA0)+cpa(AAE)
References
1. Denke, M. A. Nutritional and health benefits of beer. American Journal of the Medical Sciences2000, 320, 320-326.
2. Lynch, K. M.; Steffen, E. J.; Arendt, E. K. Brewers' spent grain: a review with an emphasis on food and health. Journal of the Institute of Brewing2016, 122, 553-568.
3. Miranda, C. L.; Stevens, J. F.; Helmrich, A.; Henderson, M. C.; (odriguez, (. J.; Yang, Y. H.; Deinzer, M. L.; Barnes, D.; W.Buhler, D. (. Antiproliferative and cytotoxic effects of prenylated flavonoids from hops (Humulus lupulus) in human cancer cell lines. Food & Chemical Toxicology1999, 37, 271-285.
4. Pfeiffer, A.; Högl, B.; Kaess, H. Effect of ethanol and commonly ingested alcoholic beverages on gastric emptying and gastrointestinal transit. Journal of Molecular Medicine1992, 70, 487-491. 5. Stevens, J. F.; Ivancic, M.; Hsu, V. L.; Deinzer, M. L. Prenylflavonoids from humulus lupulus.
Phytochemistry1997, 44, 1575-1585.
6. Murphy, C.; Cain, W. S. Taste and olfaction: Independence vs interaction. Physiology & Behavior1980, 24, 601-605.
7. Murphy, C.; Cain, W. S.; Bartoshuk, L. M. Mutual action of taste and olfaction. Sensory Processes1977, 1, 204-211.
8. Castro, L. F.; (oss, C. F. Determination of flavour compounds in beer using stir-bar sorptive extraction and solid-phase microextraction. Journal of the Institute of Brewing2015, 121, 197-203. 9. Dong, J. J.; Li, Q. L.; Yin, H.; Zhong, C.; Hao, J. G.; Yang, P. F.; Tian, Y. H.; Jia, S. (. Predictive
analysis of beer quality by correlating sensory evaluation with higher alcohol and ester production using multivariate statistics methods. Food Chemistry2014, 161, 376-382.
10. Ghasemi-Varnamkhasti, M.; Mohtasebi, S. S.; (odriguez-Mendez, M. L.; Lozano, J.; (azavi, S. H.; Ahmadi, H.; Apetrei, C. Classification of non-alcoholic beer based on aftertaste sensory evaluation by chemometric tools. Expert Systems with Applications2012, 39, 4315-4327.
11. Bacci, L.; Camilli, F.; Drago, M. S.; Magli, M.; Vagnoni, E.; Mauro, A.; Predieri, S. Sensory evaluation and instrumental measurements to determine tactile properties of wool fabrics. Textile Research Journal2012, 82, 1430-1441.
12. Zakaria, A.; Shakaff, A. Y; Adom, A. H.; Ahmad, M. N.; Masnan, M. J.; Aziz, A. H; Fikri, N. A.; Abdullah, A. H.; Kamarudin, L. M. Improved classification of orthosiphon stamineus by data fusion of electronic nose and tongue sensors. Sensors2010, 10, 8782-8796.
13. Wang, L.; Niu, Q.; Hui, Y.; Jin, H. Discrimination of rice with different pretreatment methods by using a voltammetric electronic tongue. Sensors2015, 15, 17767-17785.
14. Yoshida, M.; Haraguchi, T.; Uchida, T. Bitterness evaluation of acidic pharmaceutical substances (NSAIDs) using a taste sensor. Chemical & Pharmaceutical Bulletin2014, 62, 1252-1258. 15. Ciosek, P.; Wesoły, M.; Zabadaj, M. Towards flow-through/flow injection electronic tongue for
the analysis of pharmaceuticals. Sensors & Actuators B Chemical2015, 207, 1087-1094.
16. Francis, M. (.; Nagarajan, G.; Sarkar, (.; Mohan, V. (.; Kang, G.; Balraj, V. Perception of drinking water safety and factors influencing acceptance and sustainability of a water quality intervention in rural southern India. BMC Public Health2015, 15, 1-9.
18. Breijo, E. G.; Pinatti, C. O.; Peris, (. M.; Fillol, M. A.; Camino, J. S. TNT detection using a voltammetric electronic tongue based on neural networks. Sensors & Actuators A Physical2013, 192, 1–8.
19. Wilson, D.; Gutiérrez, J. M.; Alegret, S.; Valle, M. Simultaneous determination of Zn(II), Cu(II), Cd(II) and Pb(II) in soil samples employing an array of potentiometric sensors and an artificial neural network model. Electroanalysis2012, 24, 2249–2256.
20. Banerjee, (.; Tudu, B.; Bandyopadhyay, (.; Bhattacharyya, N. A review on combined odor and taste sensor systems. Journal of Food Engineering2016, 190, 10-21.
21. Men, H.; Chen, D.; Zhang, X.; Liu, J.; Ning, K. Data fusion of electronic nose and electronic tongue for detection of mixed Edible-Oil. Journal of Sensors2014, 2014, 1-7.
22. Zakaria, A.; Shakaff, A. Y; Masnan, M. J.; Ahmad, M. N.; Adom, A. H.; Jaafar, M. N.; Ghani, S. A.; Abdullah, A. H.; Aziz, A. H.; Kamarudin, L. M. A biomimetic sensor for the classification of honeys of different floral origin and the detection of adulteration. Sensors2010, 11, 7799-7822. 23. Haddi, Z.; Mabrouk, S.; Bougrini, M.; Tahri, K.; Sghaier, K.; Barhoumi, H.; Bari, N. E.; Maaref,
A.; Jaffrezic-(enault, N.; Bouchikhi, B. E-nose and E-tongue combination for improved recognition of fruit juice samples. Food Chemistry2014, 150, 246-253.
24. Lu, L.; Deng, S.; Zhu, Z.; Tian, S. Classification of rice by combining electronic tongue and Nose. Food Analytical Methods2015, 8, 1893-1902.
25. Banerjee, (.; Tudu, B.; Shaw, L.; Jana, A.; Bhattacharyya, N.; Bandyopadhyay, (. Instrumental testing of tea by combining the responses of electronic nose and tongue. Journal of Food Engineering2011, 110, 356-363.
26. Hong, X.; Wang, J. Use of electronic nose and tongue to track freshness of cherry tomatoes squeezed for juice consumption: Comparison of different sensor fusion approaches. Food and Bioprocess Technology2015, 8, 158-170.
27. Leardi, (.; González, A. L. Genetic algorithms applied to feature selection in PLS regression: how and when to use them. Chemometrics & Intelligent Laboratory Systems1998, 41, 195-207. 28. Fassihi, A.; Sabet, (. QSA( study of p56(lck) protein tyrosine kinase inhibitory activity of
flavonoid derivatives using ML( and GA-PLS. International Journal of Molecular Sciences2008, 9, 1876-1892.
29. Prieto, N.; Oliveri, P.; Leardi, (.; Gay, M.; Apetrei, C.; (odriguez-Méndez, M.; L.Saja, J. A. Application of a GA–PLS strategy for variable reduction of electronic tongue signals. Sensors & Actuators B Chemical2013, 183, 52-57.
30. Cortes, C.; Vapnik, V. Support Vector Network. 1995, 20, 273-297.
31. Qiu, S.; Wang, J.; Tang, C.; Du, D. Comparison of ELM, (F, and SVM on E-nose and E-tongue to trace the quality status of mandarin (Citrus unshiu Marc.). Journal of Food Engineering2015, 166, 193-203.
32. Wei, Z.; Zhang, W.; Wang, Y.; Wang, J. Monitoring the fermentation, post-ripeness and storage processes of set yogurt using voltammetric electronic tongue. Journal of Food Engineering2017, 203, 41-52.