DIRAC experiment at CERN
Angela Benelliaon behalf of the DIRAC Collaboration
JINR Dubna, Zurich University
Abstract. The precise measurements ofπ+π−andπ
Katom lifetime allow to check the predictions of Chiral Perturbation Theory for the pion-pion s-wave scattering lengths with isospin 0 and 2 and for the pion-kaon scattering lengths with isospin 1/2 and 3/2. The DIRAC experiment with the latest results is presented together with the proposal for future investigations.
1 Introduction
Pionium (A2π) is theπ+π−hydrogen-like atom, with 378 f mBohr radius, which decays predominantly intoπ0π0[1]. The alternativeγγdecay accounts for only∼0.4% of the total rate [1, 2]. Its ground-state lifetime is governed by theππS-wave scattering lengthsaI, with isospinI=0,2.
Γ2π0 ∝ |a0−a2|2 (1)
The values of a0 anda2 can be rigorously calculated in Chiral Perturbation Theory (ChPT) [3], predictinga0−a2=(0.265±0.004) and theA2πlifetimeτ=(2.9±0.1)·10−15s [4]. The measurement of
Γ2π0provides an experimental test of the theory. Moving after the production in the target, the Pionium atoms may either decay intoπ0π0or evolve by excitation (de–excitation) to different quantum states and finally decay or survive (long-lived states) or break up (be ionized) by the electric field of the target atoms. In the case of breakup, characteristic atomic pairs emerge [5] with a low relative momentumQ
in their center of mass (Q<3MeV/c), and small opening angle in the laboratory frame (<3 mrad). A high–resolution magnetic spectrometer (∆p/p∼ 3·10−3) is used [6] to identify the pairs and measureQwith sufficient precision to detect the pionium signal. This signal lies above a continuum background from free (unbound) Coulomb pairs produced from short lived sources (ρ, ∆ . . .) . Other background sources are non–Coulomb pairs where one or both pions originate from a long–lived source (η, η0, Λ, . . .) and accidental coincidences from different proton–nucleus interactions.
2 Dirac setup
The experiment is designed for efficent detection of theπ+π− pairs with small Q. This is done by
selective triggering and by exploiting the high resolution of the spectrometer. The longitudinal (QL)
and transverse (QT) components ofQ, defined with respect to the direction of the total laboratory
momentum of the pair, are measured with precisions 0.55 MeV/cand 0.10 MeV/c, respectively. The upstream part of the channel is mainly in vacuum and the detectors have been designed so to reduce at maximum the effect of the multiple scattering of the particles and preserve the small
Q distribution of the pairs. After the target we had, till 2003, 4 planes of GEM-MSGC that have been replaced with Micro Drift Chambers (MDC). Then 3 planes of Scintillator Fibres (SFD) provide a spatial resolution for isolated tracks or close tracks of δisolated = 0.022cm andδclose = 0.055cm
respectively [7]. When only one fibre is hit in a plane we use the same orientation plane of Ionisation
a e-mail:[email protected]
P vacuum
magnet DC VH HH
CH
meters
MDC SFD
IH shield2
MU PSh
absorber C4F10
C4F10 aerogel target
shield1
MDC SFD IH
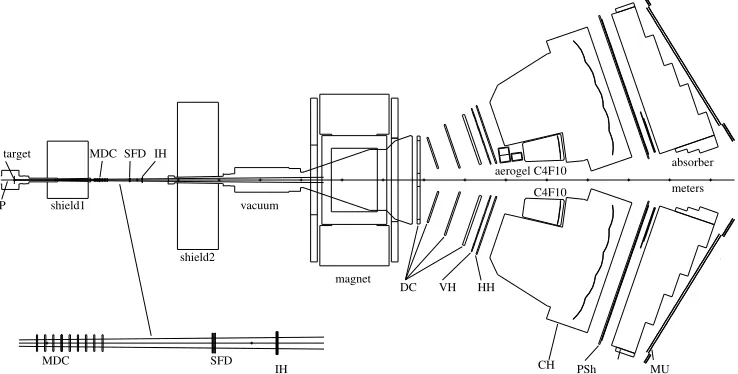
Fig. 1.DIRAC setup: MDC are microdrift gas chambers, SFD is a scintillating fiber detector and IH is a scintil-lation ionization hodoscope. Downstream the spectrometer magnet there are drift chambers (DC), vertical (VH) and horizontal (HH) scintillation hodoscopes, Cherenkov detectors containing nitrogen (CH), heavy gas C4F10 and aerogel radiators, shower detectors (PSh) and scintillation muon detectors (MU).
Hodoscope (IH) in order to distinguish if the energy deposited corresponds to a single track or a pair crossing the same IH slab. A 1.65 Tesla dipole magnet is used for the momentum determination. After the magnet there are 4 groups of Drift Chambers, consisting of X, Y and W (inclined) planes giving a spatial resolution of 85µm. Then a Vertical Hodoscope (VH) consisting of 20 scintillating slabs with a time resolution below 140psis used for particle timing, and an Horizontal Hodoscope (HH) is used by the trigger in order to select opposite charged particles with a vertical displacement smaller than 75mm.
The experimental resolutions on the momentum and opening angle must be accurately simulated in order to extract the narrow pionium signal. Multiple–scattering in the target is the primary source of uncertainty on theQTmeasurement. In order to achieve the desiredQTresolution, the scattering angle
in the target must be known with∼1% precision.
Using this configuration of the DIRAC detector we have published our last analysis of∼1.5·109 events grouping the data from 2001 till 2003 [8]. These data come from collisions of 20 and 24 GeV/c
protons, delivered by the CERN PS, impinging on a thin Ni target foil of 94 or 98µm thickness for different run periods.
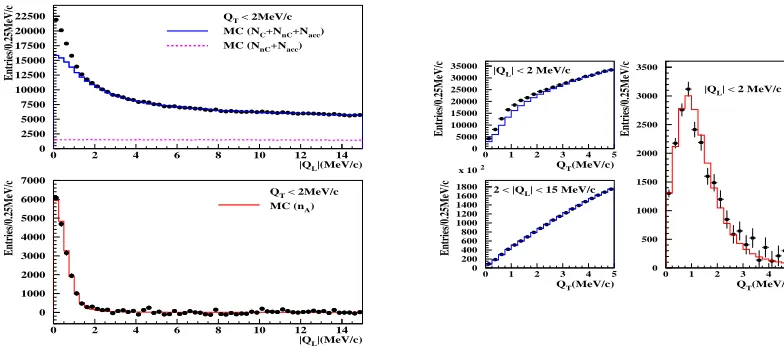
In Figs. 2, the |QL| andQT projections of the experimental prompt π+π− spectrum are shown
in comparison to the fitted simulated background spectrum. After subtraction of the background, the experimentalA2πsignal emerges at small values of|QL|and can be compared with the simulated signal.
The overall agreement between the best–fit experimental and simulated spectra is excellent, over the entireQT,QLdomain. We have detectednA =21227±407 atomic pairs, that allow us to give our final
measurement of the ground–stateA2πlifetime yielding
τ=[3.15+−00..2019(stat)−+00..2018(sys)]·10−15s.
We obtain theππscattering length difference
|a0−a2|=[0.2533+−00..00780080(stat)+ 0.0072
−0.0077(sys)]M
−1
π+.
Our result is compatible with the theoretical prediction and with the other experiment, NA48, that provides a measurement ofa0−a2, [9].
In 2007 we have modified the DIRAC setup in order to study theKπatomic pairs at the same time as collecting more statistics forππatomic pairs. In both arms the Nitrogen Cerenkov detectors (N2)
0 1000 2000 3000 4000 5000 6000 7000
0 2 4 6 8 10 12 14 |QL|(MeV/c)
Entries/0.25MeV/c
MC (nA) QT< 2MeV/c 0 2500 5000 7500 10000 12500 15000 17500 20000
0 2 4 6 8 10 12 14 |QL|(MeV/c)
Entries/0.25MeV/c
MC (NC+NnC+Nacc) MC (NnC+Nacc)
0 5000 10000 15000 20000 25000 30000 35000
0 1 2 3 4 5
QT(MeV/c)
Entries/0.25MeV/c
|QL| < 2 MeV/c
0 500 1000 1500 2000 2500 3000 3500
0 1 2 3 4 5
QT(MeV/c)
Entries/0.25MeV/c
|QL| < 2 MeV/c
0 200 400 600 800 1000 1200 1400 1600 1800 x 102
0 1 2 3 4 5
QT(MeV/c)
Entries/0.25MeV/c
2 < |QL| < 15 MeV/c
Fig. 2.On the right :|QL|fit projections of theπ+π−spectrum from data (dots) and simulation (full line). The top plot shows the simulated background components compared with the experimental spectrum; the bottom plot shows the pionium signal after background subtraction and the simulation. On the left:QTfit projections of the π+π−
spectrum from data (dots) and simulation (full line). Top left: in theA2πsignal region; bottom left: away from the signal region. Right: pionium signal after background subtraction and simulation.
have been cut to have the space to install the heavy gasC4F10Cerenkov detectors. With an efficiency of more that 99% they identify pions while not responding to kaons or (anti)protons. The average number of photoelectrons is 28 for particles withβ=1. Next to theN2only on the left side, we have installed an Aerogel Cerenkov detector that identify kaons and reject protons. The detector consists of three modules, the two in front have a refractive index of 1.015, typically 10 photoelectrons for a particle withβ=1. Their efficiency is better than 98% for kaons with momentum below 5.5GeV/cwith only 11% contamination of protons. The module in the back has a refractive index of 1.008 and covers the higher momentum range of the kaons, between 5.5−8Gev/c, the average number of photoelectrons is 4−5 for aβ=1 particle.
The preshower detector (PSh) provide an additional electron/hadron separation to theN2Cerenkov, and his performance has been increasingly important after the cutting of the Ni Cerenkov in order to keep the level of electron rejection at the level of 98% [10]. With this modified detector and using only the downstream part of DIRAC for the tracking we have published the result of theKπanalysis [11].
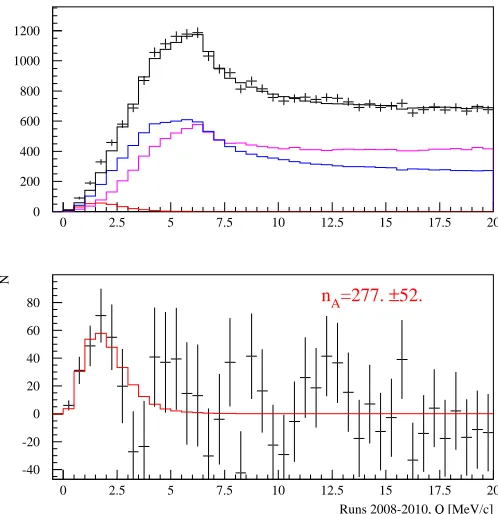
We have detected an excess of lowQevents with a significance of 3.2σ,nKAπ =173±54. If these events are interpreted as atomic pairs, then we can estimate a lower limit on the mean lifetime forKπ atoms of 0.8f swith a confidence level of 90%.
The data collected in 2008-9-10 shown in Figure 3 have been analysed and the preliminary results are with a significance of 5.3 sigma, this will provide a value for|a1/2−a3/2|with a relative error of 26%.
3 Long-lived Atoms
In order to get the values of thea0anda2scattering lengths separately fromπ+π−atoms data, one may exploit the fact that the energy splitting between the levelsnsandnp,∆En=Ens−Enp, depends on an
other combination of the scattering lengths: 2a0+a2[12]. The energy splitting for the levels with the principal quantum numbernand orbital quantum numberlincludes few contributions:
∆Enl =∆Eemnl +∆E
vac nl +∆E
str
nl (2)
where∆Eem
nl includes relativistic insertions, finite-size effect, self-energy corrections due to transverse
photons and transverse photon exchange. The term∆Evac
0 200 400 600 800 1000 1200
0 2.5 5 7.5 10 12.5 15 17.5 20
-40 -20 0 20 40 60 80
0 2.5 5 7.5 10 12.5 15 17.5 20
nA=277. ±52.
Runs 2008-2010, Q [MeV/c]
N
Fig. 3.The top plot shows the simulated background components compared with the experimental spectrum (points with errors), in blu the Coulomb pairs, in magenta the non-Coulomb, in red the atomic pairs; the bottom plot shows the residuals between data and the fitted background forπ−
K+andπ+K−for the 2008-2009-2010 data.
polarization. The last term∆Enlstr takes into account strong interaction effects and it’s related to the
ππscattering lengths as follows: ∆Estr
nl = An(2a0 +a2). The theoretical value for the 2s-2p energy
splitting has been calculated as∆E2s−2p =−0.59±0.01eV[13]. By measuring the value∆E2s−2pwe can determine the numerical value of∆Estr
nl substituting the other terms in equation 2 that have been
calculated with a high accuracy. The method for measuring∆Enwas discussed in [14].
In inclusive processes,A2πare produced ins-states distributed over the principal quantum number
nproportionally ton−3. When moving inside the target, the relativisticA
2π interacts with the target atoms and, with some probability (depending on the material), will leave the target with orbital angular momentuml>0.The main part of these atoms will be in the 2p-state. ForA2πin np-state the decay into twoπ0mesons is forbidden by the conservation law for the angular momentum, and the process
A2π → π0+γis also strongly suppressed. Therefore, the main mechanism of the np-states decay is
the np→1s radiative transition with a subsequent annihilation from the 1s-state into twoπ0 with a lifetime ofτ1s ∼3×10⁻¹⁵s. The lifetime of the atom in the 2p-state is determined by the radiative
transition probability equivalent toτ2p=1.17×10⁻¹¹s. This is why we refer to them as “long lived”,
3 order of magnitude slower decay time compared to the s-stateA2π. For the averageA2π momentum in DIRAC of 4.5GeV/cthe corresponding decay length is 5.7 cm for 2p-state, 19 cm for 3p and bigger for the increasing p.
The influence of a constant magnetic field on theA2π atom lifetime has been studied. The trans-verse magnetic lab. field B0is increased toB = γB0 in amplitude in the atom reference frame. The corresponding electric field is perpendicular to the atom momentum, and it will allow the admixture of the ns-state with the np-state wave functions. This admixture may cause a significant faster decay for atoms initially being in the np-state. For the case ofB0=4T andγ=20, the decay rate increases more than twice for the 2p state.
As a first step, during the 2011 and 2012 data taking DIRAC had as objective the observation of long lived atoms. In order to do so, after the Be target installed as the primary target, we have installed at 10 cm distance a Platinum foil (d=2µm), [15].
The proton interaction with the Be target (d = 100µm) producesA2π that can decay or break in π+π−pairs, Coulomb pairs and non-Coulomb pairs. Around 6% ofA
2π will leave the target in a np-state, thus they will not have the time to decay before reaching the Platinum foil, where they will break intoπ+π−pairs. We will be able to detect in DIRAC theππatomic-pairs created in the Pt foil above
the background formed by theπ+π−pairs created in the Be target.
0 200 400 600 800 1000 1200 1400 1600
-5 -4 -3 -2 -1 0 1 2 3 4 5
QY[MeV/c]
0 200 400 600 800 1000 1200 1400
-2 -1 0 1 2 3 4 5 6 7 8
QY[MeV/c]
Fig. 4.QYdistribution of pairs without and with the magnet.
To reduce strongly this background a magnet has been installed between the Be target station and the Pt foil: the 0.01T mmagnet shifts the Y component of the relative momentumQ. In figure 4 it’s shown theQY distribution with and without the magnet, in black is the simulation result for theQY
of the pairs produced at the Beryllium target,(on the right is centered at 6MeV/c) in white the QY
distribution of the pairs produced at the Pt foil (with the magnet on, centered inQY =0).
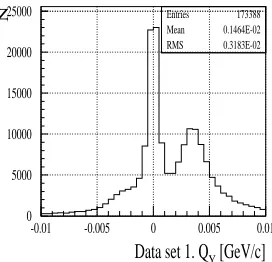
Distribution of e+e- over QY
0 5000 10000 15000 20000 25000
-0.01 -0.005 0 0.005 0.01 Entries Mean RMS 173388 0.1464E-02 0.3183E-02
Data set 1. QY[GeV/c]
N 0 5000 10000 15000 20000 25000
-0.01 -0.005 0 0.005 0.01 Entries Mean RMS 190012 0.1048E-02 0.3017E-02
Data set 2. QY[GeV/c]
0 5000 10000 15000 20000 25000
-0.01 -0.005 0 0.005 0.01 Entries Mean RMS 181564 0.1056E-02 0.3028E-02
Data set 3. Q [GeV/c]
N 0 5000 10000 15000 20000 25000 30000
-0.01 -0.005 0 0.005 0.01 Entries Mean RMS 224315 0.8902E-03 0.2971E-02
Data set 4. Q [GeV/c] Fig. 5.e+e- data 2010,QY distribution of pairs generated at the Be-target are shifted on the rightQy>0, while
the pairs generated at the Pl-foil are centered inQY=0.
The electron-positron data taken during 2011 confirms the results of the simulation. In order to have a biggerQYshift we have installed this year (2012 data) a new stronger magnet,S m2Co17, high resistivity against radiation. This will allow us to extract a signal with a significance of more than 9 sigma.
For the future, DIRAC plans to move to the SPS accelerator. With the proton energy of 450 GeV/c, the yield ofA2πandAπKwill increase of a factor 20 per proton-nucleus interaction.
References
1. J. Uretsky and J. Palfrey, Phys. Rev.121(1961) 1798 2. J. Gasseret al., Phys. Rep.456(2008) 167
3. S. Weinberg, PhysicaA96(1979) 327; J. Gasser and H. Leutwyler, Phys. Lett. B125(1983) 325;
ibidNucl. Phys. B250(1985) 465, 517, 539 4. G. Colangeloet al., Nucl. Phys. B603(2001) 125
5. L.L. Nemenov, Yas Fiz41(1985) 980; Sov. J. Nucl.41(1985) 629 6. B. Adevaet al., Nucl. Instrum. and Meth. A515(2003) 467
7. SFD study and simulation for the data 2008-2010, A. Benelli [Zurich], DIRAC-TALK-2011-01 8. B. Adevaet al., Physics Letters B704(2011) 24
9. J.R. Batleyet al., Eur. Phys. J. C64(2009) 589; J.R. Batleyet al., Eur. Phys. J. C70(2010) 635 10. M. Pentia, S. Constantinescu, M. Gugiu [IFIN-HH], DIRAC-NOTE-2011-03
11. B. Adevaet al., Physics Letters B674(2009) 11
12. S. Deseret al., Phys Rev96(1954) 774 and G.V. Efimov, M.A.Ivanov and E.E. Lyubovitskij, Yad. Fiz.44(1986) 460; Sov. J. Nucl. Phys.44(1986) 296
13. J. Schweizer, Phys. Lett. B587(2004) 33 J. Schweizer, Eur. Phys. J. C36(2004) 483
14. L. L. Nemenov and V. D. Ovsyannikov, Phys. Lett. B 514 (2001) 247; L. L. Nemenov, V. D. Ovsyannikov and E. V. Chaplygin, Nucl. Phys. A710(2002) 303
15. DIRAC-DOC-2012-01: PS212 Addendum 6, CERN-SPSC-2012-001 (SPSC-P-284-ADD-6).