ABSTRACT
NELSON, KELLY PAGE. Innovation in the Energy Industry: Evidence from Patent Indicators. (Under the direction of Zachary Brown).
Innovation is a key component in developing and improving alternative sources for energy production. Policy and market events can affect the incentives for firms to inno-vate. These essays examine the interaction between policy and innovation in the energy industry. I use patent counts and other patent indicators to measure aspects of research and development, an established practive within the economics of innovation literature.
In the first chapter, I explore the effects of biofuels policies such as ethanol blend mandates on patenting in patent categories related to biofuels. In addition, I investigate the impacts of these policies on agricultural biotechnology. Using a Bayesisan model averaging approach, I find that ethanol blend mandates, the most common form of policy designed to stimulate the use of biofuels, have a significant positive effect on biofuels patent counts and a significant negative effect on certain agricultural biotechnology patent counts. When looking at quality-weighted patenting, a measurement of innovative output, I find that there is a significant increase in the weighted patents for biofuels but no significant decrease in output for agricultural biotechnology in response to the blend mandates. Together, these findings suggest that while the blend mandates redirect effort from agricultural biotechnology to biofuels-specific categories, this does not reduce overall output. This could be evidence that scientific insights generated through researching biofuels are beneficial to performing agricultural biotechnology research, as the same level of innovative output is generated with reduced levels of innovative inputs.
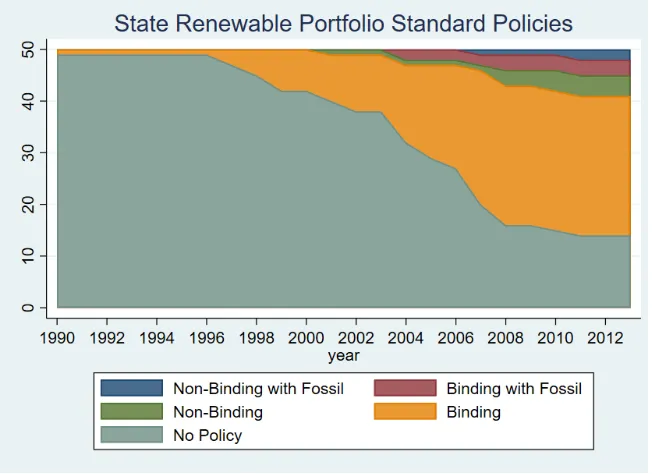
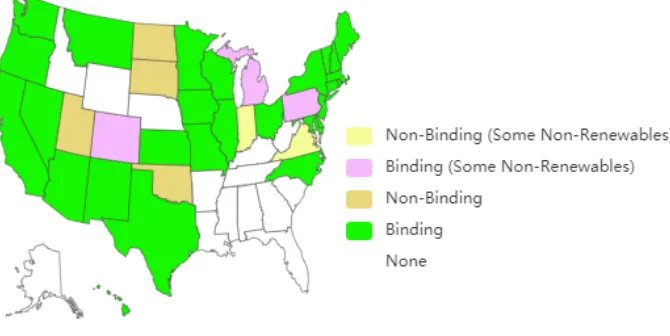
Previous literature did not find significant effects of renewable portfolio standards policies on increased innovation in renewable energy within U.S. states that passed these policies. In the second chapter of this paper, I investigate if the explanation for this lack of increased innovation in response to the policies is because higher levels of prior innovation predict the adoption of the policy. I consider both renewable energy patenting and fossil fuel patenting by in-state firms and find that higher renewable energy patenting significantly predicts adoption of a binding policy, while higher patenting in fossil fuels categories increases the probability of a state adopting a non-binding policy.
© Copyright 2019 by Kelly Page Nelson
Innovation in the Energy Industry: Evidence from Patent Indicators
by
Kelly Page Nelson
A dissertation submitted to the Graduate Faculty of North Carolina State University
in partial fulfillment of the requirements for the Degree of
Doctor of Philosophy
Economics
Raleigh, North Carolina 2019
APPROVED BY:
Harrison Fell Walter Thurman
Xiaoyong Zheng Zachary Brown
BIOGRAPHY
ACKNOWLEDGEMENTS
I would like to thank my committee chair Zack Brown and my committee members for their guidance and support through the dissertation writing process. I have greatly appreciated the comments and suggestions from the faculty and students at the Microeconomics Workshop, the EATD workshop, the “Environar” group, and IHS graduate student seminars. I give special thanks to Raymond Guiteras for his role as a substitute committee member in my dissertation defense.
I would like to acknowledge others whose assistance has been invaluable in writing this dissertation. Lee Parton’s efforts were critical to the analysis in Chapter 2, and his advice and friendship have been indispensable. Jiri Mandula and Steven Smith were instrumental in obtaining key pieces of the data puzzle.
I would like to thank my fellow graduate students. Without Huachen, Kenny, Mike, Sasha, and Serkan with me for those all-day or late-night study sessions, I may not have had the opportunity to write this dissertation.
My friends and family have supported me throughout. I appreciate them listening to me discuss the minutiae of my research, the challenges of graduate student life, and the intricacies and intrigue of the academic job market.
Finally, Jessica has stood by me through the high points and the low points of my career. I am honored and blessed with her love and companionship.
TABLE OF CONTENTS
List of Tables. . . vi
List of Figures. . . vii
Chapter 1 Innovation in the Energy Industry: Introduction and Literature Review 1 1.1 Overview . . . 1
1.2 The Relevance of Innovation and R&D . . . 2
1.3 Patent Bibliometrics and Innovation Economics . . . 3
1.4 Environmental Policy and Innovation . . . 4
1.5 Dissertation Outline . . . 5
Chapter 2 Biofuels Policy and Innovation Impacts: Evidence from . . . 7
2.1 Introduction . . . 7
2.1.1 Multi-Product Firms and the Innovation Decision . . . 9
2.1.2 Environmental and Energy Policy Impacts on Innovation . . . 12
2.2 Data . . . 14
2.2.1 Patent Data . . . 14
2.2.2 Policies . . . 16
2.3 Methodology . . . 20
2.4 Results and Discussion . . . 23
2.4.1 Blend Mandates . . . 26
2.4.2 Other Policies . . . 27
2.4.3 Controls: Environmental Policies, Agricultural and Energy Prices, and Knowledge Stock . . . 28
2.5 Conclusion . . . 31
Chapter 3 Intellectual Property Portfolios and Energy Policy Outcomes: Evidence from U.S. Renewable Portfolio Standards Policies . . . 33
3.1 Introduction . . . 33
3.2 Cost Saving Via Innovation . . . 35
3.2.1 Environmental Policy and Energy Source Usage . . . 37
3.3 Data and Empirical Models . . . 39
3.3.1 Data Sources and Descriptions . . . 39
3.3.2 Multivariate Survival Analysis . . . 40
3.4 Results and Discussion . . . 45
3.5 Conclusion . . . 47
Chapter 4 Reactor Accidents and Nuclear Power Innovation: An Event Study Us-ing Patent Indicators. . . 49
4.1 Introduction . . . 49
4.3 Data and Methods . . . 54
4.3.1 Data Sources . . . 54
4.3.2 Econometric Approach . . . 58
4.4 Results and Discussion . . . 60
4.5 Conclusion . . . 62
References . . . 64
APPENDICES . . . 72
Appendix A Alternative BMA Specifications for Chapter 2 . . . 73
LIST OF TABLES
Table 2.1 Table of IPC Headings . . . 15
Table 2.2 Summary Statistics for QI Scores of Individual Patents . . . 16
Table 2.3 Country-Year Descriptions of Policy Variables . . . 17
Table 2.4 Model Averages, Raw Patent Counts . . . 24
Table 2.5 Model Averages: Quality-Weighted Patenting . . . 25
Table 2.6 Auxiliary BMA Variables, Raw Patent Counts . . . 30
Table 2.7 Auxiliary BMA Variables, Quality-Weighted Patents . . . 30
Table 3.1 Summary Statistics for Covariates . . . 44
Table 3.2 Cox Hazard Rate, Stratified by Policy Type . . . 46
Table 4.1 International Patent Categories for Nuclear Energy (Nucleonics) . . . . 57
Table 4.2 Summary Statistics . . . 57
Table 4.3 Impact of Accident Events . . . 61
Table A.1 One-Year Lag, Raw Patent Counts . . . 74
Table A.2 One-Year Lag, Quality-Weighted Patenting . . . 75
Table A.3 Two-Year Lag, Raw Patent Counts . . . 76
Table A.4 Two-Year Lag: Quality-Weight Patenting . . . 77
Table A.5 One-Year Lead: Raw Patent Counts . . . 78
Table A.6 One-Year Lead: Quality-Weighted Patenting . . . 79
Table A.7 Two-Year Lead: Raw Patent Counts . . . 80
Table A.8 Two-Year Lead, Quality-Weighted Patenting . . . 81
Table B.1 Summary Statistics . . . 82
Table B.2 Event Study with Knowledge Stock . . . 83
Table B.3 Event Study with Knowledge Stock: Safety Patents Only . . . 83
LIST OF FIGURES
Figure 2.1 The Knowledge Spillover Mechanism . . . 10
Figure 2.2 Ethanol Blend Mandates, Years with Mandate . . . 18
Figure 2.3 Biodiesel Blend Mandates, Years with Mandate . . . 18
Figure 3.1 Policy by Year . . . 42
Figure 3.2 RPS Policy in 2013 . . . 43
Figure 3.3 Average Renewable Energy Patent Count . . . 44
Figure 3.4 Average Fossil Fuel Patent Count . . . 45
Figure 4.1 Maximum Number of Operational Reactors . . . 55
Figure 4.2 Maximum number of accidents per year . . . 56
CHAPTER
1
INNOVATION IN THE ENERGY
INDUSTRY: INTRODUCTION AND
LITERATURE REVIEW
1.1
Overview
1.2
The Relevance of Innovation and R&D
A firm’s benefits to research and development activity come in the form of increased produc-tivity that results from factor-improving technology and from licensing the technology to other firms. Some studies within economic literature model the process of research activity as deterministic, with investment in research and development (R&D) leading to a specific improvement in technology. Another common model for R&D treats innovation as a process of randomly drawing from a distribution of possible technologies where expended effort increases the number of draws or alters the distribution. In either case, the technology’s value is an improvement if it outperforms the existing technology. This activity is profitable if the value of the technology, either direct cost savings or licensing fee, exceeds the cost of research and development.
Hicks (1932) considers changes in the prices of inputs the primary driver of technolog-ical changes as firms develop technologies in response to higher production costs. Cost savings can be modeled for a monopolist firm in isolation, a product of perfect compe-tition, or — most commonly — as a form of strategic interactions among firms. Within the industrial organization literature, R&D competition is commonly modeled using a game-theoretic approach (Kamien and Schwartz 1972, 1974, 1976; Loury 1979; Lee and Wilde 1980; Reinganum 1982). More recent studies on innovation in oligopoly settings add considerations such as the scope of patent protection (Hopenhayn and Mitchell 2011). According to Hopenhayn and Squinatani (2015), the public nature of patents creates an incentive to delay patenting in order to avoid disclosure of the technology, and therefore private knowledge about the market, to competitors.
Macroeconomic growth models, such as those by Romer (1987, 1990) and Aghion and Howitt (1992), treat technological progress as the primary force for economic growth through its influence on total factor productivity. Since intellectual property rights can grant monopoly power over a new technology, there exists tension in determining the welfare effects between the loss of surplus from this market power and the productivity improvements produced by innovation.
power but reduction if the market is competitive.
In response to the argument that technological improvement is a driver of overall eco-nomic growth, governments have enacted policies with the goal of stimulating technological advancement. According to some models, this is a necessary corrective to the underpro-vision of innovation in a laissez-faire context, as firms ignore the positive externalities engendered by innovation (Jones and Williams 1998). There have been multiple studies on the impact of government actions on private innovation. An early example by Howe and McFetridge looked at the impact of government grants for innovation in the chemi-cal, electrichemi-cal, and machinery industries in Canada, finding that only R&D expenditures in the electrical industry were affected by these grants (Howe and McFetridge 1976). A meta-analysis of the empirical literature on R&D directly performed by the government on private sector R&D found no clear answer to whether public sector research complemented or “crowded out" private research (Davidet al2000).
1.3
Patent Bibliometrics and Innovation Economics
The use of patent data for the empirical study of innovation is a popular approach. Patent data are widely available for the majority of countries globally, making it more accessible than data on firm-level R&D expenditures. The literature on patent bibliometrics, or the study of indicators related to patent data, such as citation counts and author networks, has developed considerably since its origin in the 1970s.
A highly cited and foundational article by Hausman, Hall, and Griliches (1984) estab-lished the relationship between R&D expenditures and patent counts, finding a significant relationship between the two and justifying the use of patenting as a proxy for R&D data, which are more difficult to obtain globally. A 1990 meta-analysis by Griliches found that subsequent studies on this relationship have generally upheld the earlier findings . The literature on innovation still primarily uses patent counts as a proxy for R&D. The use of raw patent counts, unweighted by indicators of quality, is common in the literature on energy innovation.
be useful in evaluating the quality of a patent (Harhoffet al2003, Alcacer and Gittelman 2006), though Lanjouw and Schankerman suggest that a large number of backward citations could also indicate the technology is incremental (Lanjouw and Schankerman 2006, OECD 2012).
Others who study patent bibliometric indicators have added further metrics such as measuring the generality of patents via the diversity of technology categories from which the citations are drawn (van Zeebroeck 2011). These can be based in citations or other qualities of the patent. These additions and refinements include the breadth of coverage across patent-granting authorities, such as the European Patent Office and United States Patent and Trademark Office (Lanjouwet al1998, Harhoffet al2003), the number of claims a patent contains (Tong and Davidson 1994, Lanjouw and Schankerman 2001, Lanjouw and Schankerman 2004) how quickly a patent was granted (Harhoff and Wagner 2004, Reibeau and Rockett 2010), and the renewal of a patent. Composite indicators such as quality indices combine several of these indicators into a single score to compare the overall quality of patents. Lanjouw and Schankerman (2002) compared the significance of quality indices to raw patent counts. While the quality indices outperformed raw patent counts in determining stock price in certain industries, they found that in others in which the general patent output across firms was similar, the quality indices only reflected random fluctuations of indicators such as citations.
1.4
Environmental Policy and Innovation
Innovation related to pollution abatement regulation has received considerable attention within the environmental economics literature. The periodic studies and meta-analyses that surface in environmental economics journals on the topic of the “Porter Hypothesis,” a concept popularized by Michael Porter (1991), evidence the continued interest in the subject. Porter argued that stringent environmental regulation, if it induced innovation, could lead to increased production efficiency that outweighed the imposed regulatory burden.1
The use of fossil fuels for transportation and energy production is the largest contributor of greenhouse gas emissions. Transportation and generation using fossil fuels can also result in other types of air and water pollution, such as acid rain and airborne particulates. As a result, the energy industry has been of particular interest in empirical studies of policy
1n.b: This is not an exhaustive discussion of the literature. For a comprehensive meta-analysis, see Carraro
impacts on innovation. Regulations take the form of mandates on the use of alternative energy sources or pollution abatement requirements. Margolis and Kammen (1999) ob-served that R&D intensity in the energy industry was low compared to overall investment in innovation. A policy may directly incentivize the use of a particular energy source, such as feed-in tariffs that act as subsidies to solar power. Other policies may require renewable energy more generally to be used, such as renewable portfolio standards. The impact of these policies is to raise the cost of generation as it either requires the use of abatement equipment or of alternative energy sources that can be more expensive than traditional fossil fuel sources.
The empirical findings related to innovation in response to regulatory stringency and incentives for renewable energy have produced mixed results. Cohen and Tubb (2018) found “considerable heterogeneity in both the sign and significance level” in their meta-analysis of studies on the Porter Hypothesis. Individual studies provide explanations for the disparate outcomes in Tubb and Cohen’s work. Calel and Dechezleprêtre (2016) found that firms with plants subject to EU regulations produced 36.2% more green patents than comparable firms not subject to the regulations. Johnstoneet al(2010) perform an analysis of renewable energy incentives in Europe and their impact on patenting for different forms of renewable energy, finding that generic policies toward renewable energy stimulated investment in forms that were nearly cost-competitive with fossil fuels such as wind but that for more cost-prohibitive forms such as solar, more targeted policies were necessary. Studies such as Popp (2011) and Nemet (2009) found that policies were unnecessary to stimulate innovation, as markets had provided firms enough private incentive to innovate prior to the implementation of the policy. As a result, new policies did not further increase R&D. Fuet al(2018) found that while renewable portfolio standards did not increase innovation in the U.S. states that passed the policies, these policies did increase patent counts in neighboring states.
1.5
Dissertation Outline
to different products, in this case biofuels and agricultural biotechnology. I also explore, using patent quality indicators as a measurement of output, whether there are positive spillovers between R&D between different technology categories. I find that certain policies stimulate R&D expenditures and increase innovative output in biofuels categories while reducing R&D effort toward agricultural biotechnology. Innovative output in the agricul-tural biotechnology did not decrease in response to these policies, evidence of possible spillovers.
In the second chapter, I explore how policy may in fact be influenced by the interests of firms that have previously innovated technologies related to alternative energy production and have interest in the use of their IP. While previous studies such as Fu et al (2018) find that renewable portfolio standards do not stimulate innovation in the states that pass them, I examine if prior innovation drives adoption of the policy. Policy outcomes are modeled as the outcome of a lobbying contest between firms holding intellectual property relevant to generation using fossil fuels and those holding patents for renewable energy technologies. This connects the innovation literature to the public choice and regulatory capture literature. I find that increased energy IP raises the probability of a state adopting renewable portfolio standards, but that renewable IP predicts binding policies while fossil fuels IP predicts non-binding policies.
CHAPTER
2
BIOFUELS POLICY AND INNOVATION
IMPACTS: EVIDENCE FROM
2.1
Introduction
Multiple policies have encouraged the use of biofuels, ethanol and diesel primarily derived from plant-based sources, for transportation. The majority of research and development (R&D) related to the production of these products are performed by multi-product con-glomerates. This study explores if policies encouraging the use of biofuels have increased innovation related to their production. We also investigate the relationship between bio-fuels innovation and innovation in agricultural biotechnology, a field of research closely related to biofuels and typically of interest to the same firms. In addition to determining if policies increase biofuels innovation, we test if these policies have influenced R&D effort toward agricultural biotechnology. Finally, we check if effort toward biofuels has a spillover to agricultural biotechnology in the form of basic scientific insights.1
Previous empirical studies on the effects of energy policy on alternative energy have
not focused on biofuels. Clancy and Moschini (2017) performed a theoretical analysis of ethanol mandates and innovation but their study does not test whether these policies in fact induced innovation. The literature related to biofuels policy has primarily focused on the success of these policies in their stated goals, which were primarily the reduction of fossil fuel imports and a decrease in carbon dioxide emissions. Other research has looked at indirect effects such as food prices and land use. Our research also contributes to this literature on the impacts of biofuels policy on agricultural markets by investigating the effects on agricultural R&D. This paper adds a theoretical model of firm R&D allocation with multiple products. We empirically test the impact of biofuels policy on the allocation of goods toward both biofuels and agricultural biotechnology.
We consider the effects of a comprehensive set of biofuels policies using private-sector patent indicators and policy data from 21 countries, mainly OECD members. We use patent indicators related to R&D effort and R&D output. We find that ethanol blend mandates have a significant positive effect on biofuels patenting and a significant negative effect on some agricultural patenting. We also find that these mandates have a positive effect on quality-adjusted research output related to biofuels but not a significant impact on agricultural research output. The latter effect suggests the possibility that effort directed toward biofuels has positive spillovers into agricultural research output, as the policies significantly reduced resources directed toward agricultural research but firms were able to maintain the same level of effective R&D output. In addition, other policies also had significant positive or negative effects on either biofuels or agricultural technology patenting.
The findings are relevant for the implementation of future biofuels policies designed to stimulate demand, such as the recent decision in the United States to increase the maximum ethanol blend allowed during summer months. The finding that firms redirect resources toward the good that has demand stimulated by a policy and away from other technologies in their research portfolio is important when considering the effects of other policies that will affect firms that allocate their research resources across multiple technologies. While innovation in one area may be stimulated, it can come at the cost of innovation toward other domains.
Shankerman 2002), the market value of the more comprehensive quality metrics used in this study are not as established in the literature.
2.1.1
Multi-Product Firms and the Innovation Decision
Hicks argues for a theory of “induced innovation," where “the change in a relative price of a factor is itself a spur to innovation." (Hicks 1932, pp 124-125) Macroeconomic approaches to innovation often treat the introduction of new technologies and goods as part of an endogenous growth process driven either by growth through learning by doing, where aggregate productivity depends on levels of capital investment, or expanding varieties, where either a taste for a variety of consumer items or competition between suppliers of intermediate goods drives growth (Judd 1985; Romer 1987, 1990; Aghion and Howett 1992; Barro and Sala-i-Martin 1995). Microeconomic approaches to R&D strategies have emphasized firms’ efforts to maximize profits via cost-saving innovations, particularly when competing with other firms (Kamien and Schwartz 1972, 1974, 1976; Loury 1979; Lee and Wilde 1980; Reinganum 1982).
Innovation spillovers occur when research efforts in one field have an impact on related technological fields through complementarities in the research and development (R&D) process. Applied research intended to develop production technologies for immediate use also advances basic science (Stokes, 2011). There can be transfer of knowledge from researchers on one project to another within the same firm. These insights can inform further applied research in the same field or in different fields. Less abstractly, resources used for research in one field could be used concurrently for other projects. This can include use of buildings for multiple laboratories or use of lab equipment and facilities across research teams. Throughout this paper, we use the term “spillover effect” to refer to these complementarities in R&D production. Figure (2.1) graphically depicts a model of this process using the biofuels industry as an example.
the production firms.
Π=
N
X
i=1
πi (2.1)
We combine aspects of the Spence (1984) R&D model and the Griliches (1992) knowl-edge spillover model to present a multi-good cost-reduction model with the potential for technological spillovers. The firm seeks to minimize costs subject to a R&D budget con-straintx. Each technology investmentxireduces costs for production of goodi. If there are spillovers, investment inxiwill also yieldsj ixi, which reduces costs for good j equivalent tosj ipercentage of expenditure towardxj.
Equation (2.2) illustrates the nonlinear program for the firm’s cost-minimization prob-lem for the case of two goods. The costsci(Yi,r)andcj(Yj,r)represent the costs at given output levels for each goodYi. Costs are increasing as output levelsYi and in the output cost parameterr representing rental rate of capital or cost of other non-R&D inputs. For simplicity, assume that the unit cost for R&D isw regardless of which good is being re-searched, but that R&D costs are convex and monotonically increasing. Firms are subject to an overall research budget constraintxwhen deciding how to allocate R&D.
We add restrictions to the spillover parameters. It is the case in our model that 0≤si j ≤1.
This means that R&D directed toward production of goodi can not have a greater impact on cost-saving technology for producing good j and vice-versa. This does preclude the potential for serendipitous breakthroughs that have greater impact outside of the initial field of the research, such as the discoveries of polytetrafluoroethene resin (“Teflon”) or penicillin’s antibiotic properties during experiments on other subjects. However, it is natural to model the impacts of R&D projects as having the greatest impact with its intended field. Other parameters are restricted only to the set of non-negative real numbers.
L = (1−xi−si jxj)ci(Yi,r) + (1−xj −sj ixi)cj(Yj,r)−λ[w xi2+w xj2−x] (2.2) In the case wheresi j =sj i=0, where research directed toward each technology has no impact on the other, the termssi jxj andsj ixi drop out. The first-order conditions from equation (2.2) can then be solved to generate the equations demonstrating optimal levels ofxi andxj with no spillover parameters. These are shown in equation (2.3) and (2.4).
xi∗= [(x w)(
ci(Yi,r)2 ci(Yi,r)2+cj(Yj,r)2
)]1/2 (2.3)
xj∗= [(x w)(
cj(Yj,r)2 ci(Yi,r)2+c
j(Yj.r)2
)]1/2
(2.4)
In the absence of spillovers, the comparative statics are given in equation (2.5).
∂x∗
i
∂x >0;
∂x∗
i
∂w <0;
∂x∗
i
∂Yi
>0;∂x
∗
i
∂Yj
<0 i 6=j (2.5)
The change inx∗
i andxj∗with respect to a change in the output cost parameterr depends on the functional forms of the cost functions and the relative magnitude of theci(Yi,r) and c j(Yj,r). If both are linear in r, thenr can be factored out in the numerator and denominator and drops out of the equation, resulting in ∂xi∗
∂r =
∂x∗
j
∂r =0. If the impact on the cost of goodi is greater than the impact on the cost of good j, then an increase inr will have a positive impact onx∗
i and a negative impact onx∗j.
When we allowsi j andsj i to take values other than zero, the presence of the spillover parameter makes determining the effects of a change in output levels less straightforward. The general equations forx∗
i andxj∗are given by (2.6) and (2.7) respectively.
xi∗= (x w)
1/2( [ci(Yi,r) +sj icj(Yj,r)] 2
[ci(Yi,r) +sj icj(Yj,r)]2+ [cj(Yj,r) +si jci(Yi,r)]2
xj∗= (x w)
1/2( [cj(Yj,r) +si jci(Yi,r)] 2
[cj(Yj,r) +si jci(Yi,r)]2+ [ci(Yi,r) +sj icj(Yj,r)]2
)1/2 (2.7)
While the partial derivatives with respect tow andx retain their signs, the possible values of the spillover parameters are necessary for analysis of how changes inYi andYj impact optimal R&D levels. For ∂xi∗
∂Yi >0, it is necessary thatsi jsj i−1<0. For
∂xi∗
∂Yj >0, it
is necessarysi jsj i−1>0. Since we have restricted these parameters such that 0≤si j≤1 and 0≤sj i≤1, we can conclude that∂xi∗
∂Yi ≥0 and
∂xi∗
∂Yj ≤0. In the case in which R&D effort
directed toward either good produces an equal gain in the technology level both goods, si j =sj i=1, then ∂
xi∗
∂Yi =
∂xj∗
∂Yj =0. In this unusual case, the goods are perfect substitutes in
terms of cost reduction, and the optimal allocation of research effort isx∗
i =x∗j =
q x
2w. The spillover parameterssi j andsj iare treated as fixed for the purposes of this paper, meaning that policies will not affect them. However, it is important to consider how changes in these spillover parameters impact the optimal level of R&D for each good. When consid-eringx∗
i, the parametersi j indicating how much investment in the other goodxj will spill over to cost reduction for goodi will have a negative impact. Increases insj i, the amount of spillover fromxi into cost reduction for good j will raisexi∗
The cross-partials ∂2xi∗
∂Yj∂si j and
∂2x∗
i
∂Yj∂sj i depend on the levels of the spillovers and the level
of cost for each good. For certain ranges of the spillover parameters, higher spillovers from goodi onto good j or vice-versa can either aggravate or attenuate the downward force an increase inYj will place onxi∗.
Government research agencies and university researchers also perform R&D but are motivated by a more diverse set of objectives than firms. These motivations include at-tracting funding and increasing departmental budgets, prize money, career mobility, and prestige. These motivations are not easily incorporated into a single objective function. We therefore treat commercial and non-commercial innovation separately in our analysis. Our empirical emphasis is on the commercial response to policies, which is more directly impacted by demand and supply-side policy.
2.1.2
Environmental and Energy Policy Impacts on Innovation
re-search and development. These supply side policies decrease the cost of R&D, incentivizing investment in research activities.
The literature on environmental policy-induced innovation has examined policies aimed at reducing specific forms of pollution, such as nitrogen dioxide and sulfur dioxide (Popp 2006) or chlorine (Popp et al2011), policies incentivizing research into specific forms of alternative energies such as wind (Nemet 2009; Dechezlepêtre and Glachant 2014; Lindman and Söderholm), and policies targeting multiple forms of alternative energy technologies (Johnstoneet al2010).
Policies that encourage or mandate the use of renewable sources do so by altering the production decision for firms. Firms choose to innovate when the expected gains from an innovation, namely the decrease in production costs, outweigh the cost of developing a new technology. Since a decrease in production cost depends both on the magnitude of the per-unit cost reduction and the total output, higher equilibrium quantities can increase the incentive to reduce per-unit cost. Because of this, products with higher demand will, in theory, offer higher potential cost savings from innovation. Certain new technologies can improve welfare beyond the private surplus gains for firms in an industry through the reduction of negative externalities. These externality reductions, such as reduced pollution, are one motivation for policy targeting increased innovation. Clancy and Moschini (2017) model different policy regimes, green energy mandates and carbon taxes. They find that the possibility of innovation was necessary in order for policies mandating the use of biofuels to be welfare-improving.
Empirical studies suggest policy impacts depend on the nature of the intervention and the type of technology. Lee and Lee (2013) found that energy-related innovation increased in the periods between 1976 and 2003. Johnstoneet al(2010) argue that broad policies, such as tradeable certificates, will increase innovation only in industries that are already “close to competitive" with fossil fuels, such as wind-generated power, whereas innovation associated with more costly energy sources such as solar require more targeted policies. Lindman and Söderholm (2016) found that feed-in tariffs and R&D support were comple-mentary in improving innovation in wind power. An example of more targeted policies are solar “feed-in tariffs,” policies allowing consumers to sell solar energy back to the utility grid.
(2009) found that wind power innovation was not strongly impacted by California policies introduced after large innovation gains had occurred, leaving limited areas for improvement. Poppet al(2011) found similar results in the pulp sector, where demand for low-chlorine paper led to increased innovation prior to the introduction of regulation. Inclusion of ethanol improves gasoline’s octane rating and lowers carbon monoxide emissions, so the practice of ethanol blending predates mandates, evidence of a non-policy source of demand. The perception of biofuels as “green" could contribute to a demand for biofuel blends for consumers who have strong normative preferences for goods with low environmental impact. Findings from Alberset al(2016) suggest that there may be some exhaustion of R&D opportunities in traditional biofuels, as there is a trend of declining innovation in biofuels combined without a reorientation of R&D toward advanced biofuels.
Our study is aimed at investigating the impact of biofuels policies not only on innova-tion within the biofuels sector but also on innovainnova-tion in the related plant biotechnology sector. We investigate which, if any, policies will increase innovation in the biofuels sector, followed by an analysis of whether biofuels-oriented policies also impact innovation in plant biotechnology.
Policies are not homogeneous. While policies aimed at protecting domestic firms from foreign competition or incentivizing exports are demand-side measures that would in theory have similar impacts to mandates, they are tested separately. Protection from imports can also relax competition, which could give firms fewer incentives to cut costs and decrease the need to innovate. Tax incentives, R&D subsidies, and similar policies provide supply-side incentives.
2.2
Data
We consider a country-year panel of 21 primarily OECD countries spanning 1996 to 2010. Most countries had data available for all 14 years. Slovakia had 13 years in the sample, while Greece and Belgium each had 11 years.
2.2.1
Patent Data
from OECD PATSTAT, the European Patent Office’s Worldwide Patent Statistical Database, to construct the dependent variables in our analysis. Each patent has an International Patent Classification (IPC) code assigned by patent examiners that indicate to which industry or industries the patent is most relevant. The technologies of interest relate to biofuels technologies and plant science, with separate variables constructed for technologies listed exclusively in each category and those with multiple IPCs that have at least one IPC that corresponds to each category. The bibliometric literature on patents suggests that data on patents is a useful substitute for scarcer firm-level data on research expenditures and returns. Following OECD guidelines on which patent categories are relevant for biofuels, we consider patents listed in biofuels (patents in IPC categories C10, C02, C07, C11, C12, Y02) and plants (A01, A01) and separate those listed exclusively in each category from those listed in both, which we refer to as “bio-plant” (BP) patents (World Intellectual Property Organization 2017) . We give descriptions of these categories in table 2.1 at the four-digit level, a high-level description of the category. The patents we extracted were from more detailed sub-categories of these IPCs.
Table 2.1: Table of IPC Headings
IPC Description Label
Category
C02F Biological Treatment of Water, Wastewater, Sewage, or Sludge Biofuels
C07C Acyclic or Carbocyclic Compounds Biofuels
C10B Destructive Distillation of Carbonaceous Materials Biofuels
C10G Hydrocarbon Oils Biofuels
C10L Use of Additives to Fuels or Fires Biofuels
C11C Fats, Oils and Fatty Acids Obtained by Chemical Modfication Biofuels
C12M Apparatus for Enzymology or Microbiology Biofuels
C12N Microorganisms or Enzymes Biofuels
C12P Fermentation/Enzyme-Using Synthesis of Desired Chemical Compound Biofuels
Y02E Reduction of GHG Related to Energy Generation/Distribution Biofuels
A01G Horticulture, Cultivation, Forestry, Watering Plant
A01H New Processes for Obtaining Plants Plant
patents have used raw patent counts, the literature on patenting suggests that raw patent counts useful as a proxy measurement for R&D “input" or resources dedicated to research (Hausmanet al1984; Grilicheset al1987). We assign a raw patent count by country-year. The address for inventors determined where to assign the patent. If more than one inventor was included for a patent, we divided the credit between the inventors’ countries of residence.
More recent patent bibliometrics literature focuses on the value of innovative output. Quality-weighted patents more closely correspond with the value added to firms than raw patent counts (Griliches 1990; Hallet al2005; van Zeebroeck 2010). PATSTAT contains several measurements of the quality of patents. We use the broadest measurement of patent quality, quality index 6 score. Quality index 6 (QI6) considers six components of quality: forward citations, backward citations, patent family size, patent generality, grant lag, and number of claims (OECD 2012). A quality weighted patent total per country-year is constructed asyj =
Pn
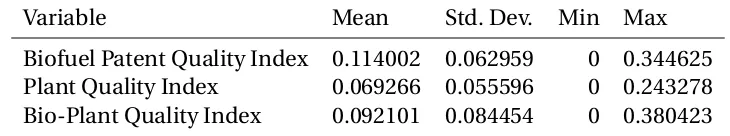
i qi — where 0≤qi≤1 — is the quality score for each patent in IPCs associated with technology categoryj in that country-year. Table 2.2 shows the summary statistics for individual patents within a sample. In general, patents within these IPCs had lower quality index scores than the average patent, which had a QI6 score between .2 and .25 during the same time period (Squiccariniet al2013).
Table 2.2: Summary Statistics for QI Scores of Individual Patents
Variable Mean Std. Dev. Min Max
Biofuel Patent Quality Index 0.114002 0.062959 0 0.344625 Plant Quality Index 0.069266 0.055596 0 0.243278 Bio-Plant Quality Index 0.092101 0.084454 0 0.380423
2.2.2
Policies
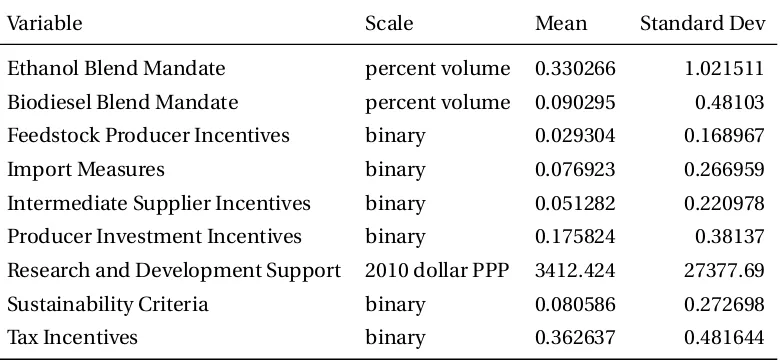
we have coverage of the variables of interest. The novelty of these data are the measurement of support policies along the supply chain for biofuels. For the purposes of this research we are concerned with identification of the effect of biofuels mandates on intellectual property quantity and quality. Below each variable is described, along with the types of policies included if the variable is an aggregation of multiple policies. Table (2.3) describes the policy variables.
Table 2.3: Country-Year Descriptions of Policy Variables
Variable Scale Mean Standard Dev
Ethanol Blend Mandate percent volume 0.330266 1.021511
Biodiesel Blend Mandate percent volume 0.090295 0.48103
Feedstock Producer Incentives binary 0.029304 0.168967
Import Measures binary 0.076923 0.266959
Intermediate Supplier Incentives binary 0.051282 0.220978
Producer Investment Incentives binary 0.175824 0.38137
Research and Development Support 2010 dollar PPP 3412.424 27377.69
Sustainability Criteria binary 0.080586 0.272698
Tax Incentives binary 0.362637 0.481644
Figure 2.2: Ethanol Blend Mandates, Years with Mandate
Figure 2.3: Biodiesel Blend Mandates, Years with Mandate
We included the level of R&D spending by governments to support biofuels research. This was expressed as total expenditures adjusted for purchasing power. This variable was the only policy variable that explicitly targeted R&D, though subsidies at other points in the supply chain such as investment incentives could affect R&D if investment is directed toward research activity.
able to include such tax policies in a binary fashion — presence or absence in a given year — within certain categories. Policies creating incentives for the production of feedstock
ex-clusively for biofuels use are classified as feedstock production incentives. Subsidies at any stage of the production supply chain are considered producer investment incentives, which include support to capital, land, and intermediate inputs. Intermediate supplier incentives (ISI) indicate the presence of subsidies directed toward storage, handling, transportation, blending, or distribution of biofuels. ISI also includes credit concessions for throughput. A generic tax incentives variable was considered separately and indicates if a country has taxes directed toward production, intermediate supply, or consumption.
Certain countries had a sustainability criteria condition for biofuels production. This policy required a minimum life-cycle emissions savings for production of biofuels. It pri-marily was intended to limit the types of land that could be used for biofuels production, such as restrictions on deforestation. We included other environmental policies not directly related to biofuels production as control variables, which will be in the auxiliary variable set in our Bayesian model averaging approach.
Several other policies were considered for inclusion but later dropped due to low varia-tion within our sample, either having no variavaria-tion within the sample (e.g a dummy variable with only 0 observations) or a single country-year observation different from the remainder of the observations. These include export measures such as value added tax refunds on exports, biofuels quantity targets related to overall volume rather than percentages, domes-tic price regulation of biofuels, output based biofuels payments, and purchase support for biodiesel and ethanol.
Control Variables
We control for several factors that could impact innovation relevant to biofuels. These are related to market forces outside of policy, environmental policies unrelated to biofuels, and a measurement of prior accumulated knowledge capital within a country (“knowledge stock”). To control for the impact of market forces unrelated to policy, we include indices for crop production, food price, and energy price (FAO, 2017). Data necessary to construct an energy price index are not available for Brazil. Since Brazil is one of the largest users of biofuels, particularly bioethanol, we include specifications that do not have this variable in order to preserve Brazil in the sample.
innovation hypothesis to policies aimed at forcing firms to internalize pollution abatement costs. Porter’s argument is that stricter environmental regulations will produce innovations in pollution abatement technologies or less polluting versions of products. Subsequent studies have supported limited versions of this argument (Jaffe and Palmer 1997; Lanoie et al2011; Rubashkinaet al2015, Calel and Dechezlepêtre 2016). In deference to these findings, we include variables measuring the stringency of environmental policies in each country in the set of control variables. The five measurements of environmental stringency we include are sulfur dioxide emissions, petroleum excise taxes, environmental vehicle and transportation tax revenue, energy tax revenue, and the environmental policy stringency index.2
We also control for the knowledge stock in a country. Knowledge stock is a discounted sum of prior patent activity in a country. Previous patenting demonstrates a country’s propensity for R&D. Popp (2002) demonstrates that omission of a country’s knowledge stock will significantly bias any analysis of patent data. The knowledge stock variables are constructed using the PATSTAT database. The knowledge stock variable is a discounted aggregate of previous years’ patent counts in all categories. We include IPC-specific knowl-edge stock limited to the constituent IPCs used in constructing the dependent variables. We use both citation-weighted and raw measurements of the IPC-specific knowledge stocks in different model averaging runs.
2.3
Methodology
We begin with the standard fixed-effects OLS model for a country-year panel given in equation (2.8).
yi t =α+βXi,t−L+ξi+ρt+γt+γt>2008φt+νi t (2.8) In addition to country fixed effectsξi, we also include a linear time trend. Because the trend in patenting dramatically dropped in the years following the 2008 recession, we include a dummy variableγt>2008to indicate post-2008 years, and include an interaction
between the time trend and the post-2008 dummy to allow the time trend to differ in
pre-2All aforementioned variables were gathered from OECD Stat with the exception of sulfur dioxide emissions
and post- 2008 years.
Previous studies have shown little effect of foreign policies on innovation (Popp 2006) or that foreign policies have an impact far smaller than that of domestic policies (Deche-zlepêtre and Glachant 2013). We therefore only include a country’s own policies and do not estimate the cross-country effects of policies.
The subset ofXi t comprised of control variables is highly collinear, but there is uncer-tainty a priori as to which individual control variables to include and which to exclude. There is also uncertainty regarding the relevance of environmental regulations. A recent meta-analysis by Cohen and Tubb (2018) found conflicting evidence of the validity of the Porter Hypothesis that more stringent environmental regulations will produce greater pollution-reducing innovation. We also have evidence that the overall knowledge stock is a significant variable to include, but prior research does not provide guidance on how technology-specific accumulated knowledge will impact our focal technologies.
We includel ∈[−2,−1, 0, 1, 2]as a lag from when the policy was implemented, withL=0 representing the contemporaneous period. Our analysis emphasizes the impacts in the contemporaneous period, as the literature suggests that patents are strategically timed to coincide with commercialization of the technology (Hopenhayn and Squintani 2015). However, we investigate specifications with lagged policies in order to investigate potential non-contemporaneous effects.
Instead of an ad-hoc approach to including or excluding variables in order to avoid collinearity, we use Bayesian Model Averaging (BMA), described below. This approach allows for a statistically consistent way of testing the validity of various specifications. Independent variables are split into “focus” and “auxiliary” sets, with focus variables included in all candidate models and combinations of auxiliary variables included in candidate models. The approach allows us to test models including different combinations of the control variables while excluding others. This method is a Bayesian approach to the OLS model in which the probability of including a subset of the explanatory variables is uncertain (Mitchell and Beauchamp 1988; Rafteryet al1997; Hoetinget al1999; Moral-Benito 2012).
2001; Eicheret al2009). The use of fixed effect models within a BMA framework appears in growth and trade analyses (Léon-Gonzaléz and Montolio 2004; Tsangarides 2004; Mirestean and Tsangarides 2009; Chenet al2009; Magnuset al2010) . The basic fixed-effects OLS model on which our BMA analysis is based is:
yi t =α+βXi,t−L+δZi t +ξi+ρt+γt>2008+γt>2008φt+νi t (2.9) Xi,t−L is a vector of policy variables in countryi in yeart−L,Zi t a vector of auxiliary regressors, country-level controls in countryi in timet. The remaining terms are the same as those in equation 2.8. We apply BMA to this model where theX variables are the “focus" regressors and are always included while different models contain combinations of the “auxiliary"Z variables.3The basic constituent equations of the BMA process are given in Hoetinget al(2009). Computing the posterior probability distribution of a value of interest
∆given the data uses the approach in equation (2.10).Mj is a candidate model from the set
M ofK possible modelsM=M1,M2, ...,MK equal to the number of subsets produced by combinations of auxiliary regressors, assuming that the probability of each model being the true model is positive and that all probabilities sum to one. The observed data is represented byD. The posterior probability of the modelMj is given by equation (2.11). Each BMA in our analysis had a model space of 16,384 candidate models when all control variables were included.
p r(∆|D) = K
X
j=1
p r(∆|Mj,D)p r(Mj|D) (2.10)
p r(Mj|D) =
p r(D|Mj)p r(Mj)
PK
l=1p r(D|ml)p r(Ml)
(2.11)
The estimates for theβ coefficients, the value of interest in this study, are generated through weighting the coefficients estimated by each candidate model. We repeat this process for patents exclusive to biofuels IPC codes, patents exclusive to plant IPC codes ("plant"), and patents listed in both biofuels and plant IPC codes ("BP"). Estimates for the parameterβ are given by equations (2.12) and (2.13).
E(β|D) = K
X
j=1
E(β|D,Mj)p r(Mj|D) (2.12)
3Though not of interest for analysis, the fixed effects and time trends are in all models alongside the “focus"
v a r(β|D) = K
X
j=1
p r(Mj|D)v a r(β|D,Mj) + K
X
j=1
p r(Mj|D)[E(β|D,Mj)−E(β|D)]2 (2.13) This process models the condition expectation and variance of the parameter given the dataD as a sum of the estimates from each modelMj weighted by the probability of model Mj being the true model given the data. The process generates a posterior distribution of the parameter estimates with Bayesian confidence intervals based on the computed mean and variance estimates. We use a 90% posterior confidence interval to determine if the parameter estimate for a regressor in the focus set is significant.
For auxiliary variables, we determine significance using the estimated posterior inclu-sion probability (PIP). Posterior incluinclu-sion probability represents the number of models in which an auxiliary variable appeared weighted by the posterior probability of those models being the true model. A coefficient with a PIP of 0.5 or higher is considered significant (Magnuset al2010, De Luca and Magnus 2011). PIP is uninformative for focus regressors, which always have a PIP of 1.0.
We first consider the basic question of whether the policies impact quality-weighted innovation in biofuels patent categories. Next, we estimate the impact of these policies on plant-related patents and patents classified as both biofuels and plant biotechnology (BP). We use the same approach to measurements of raw patent counts to determine the level of effort firms exert toward R&D. We repeated the process for time periods one and two years before the policies went into effect and one and two years after the policies went into effect to see if firm behavior changed in the years following passage of the policies. We ran 30 BMAs total, six for each different policy time lag.
2.4
Results and Discussion
predictions suggest that firms will delay patenting until close to commercialization (Hopen-hayn and Squintani 2015), our analysis focuses on the contemporaneous effects of policies rather than lagged versions.
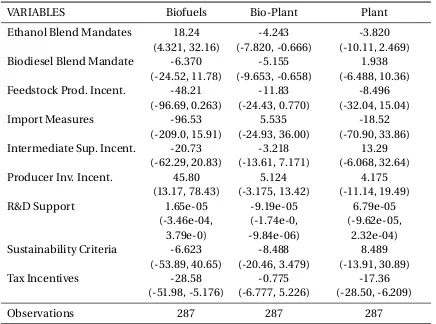
Tables (2.4) and (2.5) show the results from the BMA process for the policy variables. Coefficient estimates are averages of the estimates from each candidate model, weighted by the posterior probability of that model being the true model. The values in parentheses are 90% Bayesian posterior probability intervals. The output is from the specifications without the energy price index included and therefore contains our entire 21-country sample.
Table 2.4: Model Averages, Raw Patent Counts
VARIABLES Biofuels Bio-Plant Plant
Ethanol Blend Mandates 18.24 -4.243 -3.820
(4.321, 32.16) (-7.820, -0.666) (-10.11, 2.469)
Biodiesel Blend Mandate -6.370 -5.155 1.938
(-24.52, 11.78) (-9.653, -0.658) (-6.488, 10.36)
Feedstock Prod. Incent. -48.21 -11.83 -8.496
(-96.69, 0.263) (-24.43, 0.770) (-32.04, 15.04)
Import Measures -96.53 5.535 -18.52
(-209.0, 15.91) (-24.93, 36.00) (-70.90, 33.86)
Intermediate Sup. Incent. -20.73 -3.218 13.29
(-62.29, 20.83) (-13.61, 7.171) (-6.068, 32.64)
Producer Inv. Incent. 45.80 5.124 4.175
(13.17, 78.43) (-3.175, 13.42) (-11.14, 19.49)
R&D Support 1.65e-05 -9.19e-05 6.79e-05
(-3.46e-04, (-1.74e-0, (-9.62e-05, 3.79e-0) -9.84e-06) 2.32e-04)
Sustainability Criteria -6.623 -8.488 8.489
(-53.89, 40.65) (-20.46, 3.479) (-13.91, 30.89)
Tax Incentives -28.58 -0.775 -17.36
(-51.98, -5.176) (-6.777, 5.226) (-28.50, -6.209)
Observations 287 287 287
Table 2.5: Model Averages: Quality-Weighted Patenting
VARIABLES Biofuels Bio-Plant Plant
Ethanol Blend Mandates 4.752 -0.00502 0.487
(2.312, 7.193) (-0.602, 0.592) (-0.239, 1.213)
Biodiesel Blend Mandate 0.938 -1.264 0.622
(-2.273, 4.150) (-2.032, -0.496) (-0.289, 1.533)
Feedstock Prod. Incent. -6.541 -0.833 -0.197
(-15.03, 1.943) (-3.003, 1.338) (-2.783, 2.390)
Import Measures -26.15 -5.454 -7.855
(-46.85, -5.456) (-10.40, -0.511) (-14.24, -1.475)
Intermediate Sup. Incent. -3.060 -0.208 0.443
(-10.41, 4.292) (-2.006, 1.589) (-1.684, 2.571)
Producer Inv. Incent. 4.291 1.540 -0.0995
(-1.622, 10.20) (0.139, 2.941) (-1.799, 1.600)
R&D Support -4.93e-05 -1.83e-05 1.90e-05
(-0.000115, (-3.25e-05, (2.23e-06, 1.66e-05) -4.06e-06) 3.57e-05)
Sustainability Criteria 1.745 -1.417 1.281
(-6.876, 10.37) (-3.470, 0.635) (-1.203, 3.765)
Tax Incentives -6.440 -1.114 -2.470
(-10.61, -2.273) (-2.142, -0.0862) (-3.687, -1.252)
Observations 287 287 287
2.4.1
Blend Mandates
Blend mandates for ethanol and biodiesel have different effects. Ethanol blend mandates significantly increase raw and quality weighted biofuels patents. Non-commercial patenting follows the same pattern, though there is also an increase in biofuels raw patent counts for non-commercial patenting. Based on raw patent counts, efforts toward biofuels research increase while efforts toward BP decrease in response to ethanol blend mandates.
There is evidence of a substitution effect in R&D effort expended toward the different categories resulting from ethanol blend mandates. Within time periods, significant coef-ficients for raw patent counts have opposite signs for biofuels and the other categories. When ethanol blend mandates have a significant, positive relationship to raw patent counts, their impact on BP and plant patents was significant and negative or insignificant. In the contemporaneous specification, the effect of ethanol blend mandates on biofuels RPC is positive while the coefficients for Bio-plant RPC is negative. When considering only OECD countries, meaning excluding Brazil, the impact of ethanol blend mandates on plant-exclusive RPCs was also negative but these policies continued to have no significant effect on the quality-weighted patent output. However, this finding was not robust to other specifications of the knowledge stock, namely the use of raw patent counts for individual IPCs’ knowledge stocks instead of citation-weighted variants. While the significant negative coefficient remained for the plant raw patent count, the impact on biofuels raw patent count was no longer significant.
The coefficients for the ethanol blend mandate’s impact on different quality-weighted patent counts do in some specifications have the same sign. In the one-year lag specifi-cation, both are negatively impacted. This provides some support for the hypothesis of a relationship between innovation in the two categories. Since the policies would not affect the parameter governing scientist labor productivity, we believe that an increase in quality-weighted patenting or null coefficient in the presence of decreased raw patent counts for that IPC category is evidence for spillovers, as the level of total technology is increasing or remains the same even asxidecreases. Since total cost-saving innovation in a field is given byxi+si jxj and is a function of research labor in other technology categories, our theoretical spillover model’s predictions would be supported by the finding.
optimal level ofxb i o f u e l s, then the spillovers could result in the previous level ofxp l a n t and xb i o−p l a n t being above the optimal level, with the firms reducing R&D inputs toward the fields in order to obtain the optimum.
Biodiesel blend mandates did not significantly impact the weighted patent count for commercial biofuel or plant patenting but had a negative impact on raw and quality-weighted bio-plant patenting. Biodiesel blend mandates increase non-commercial raw patent counts and quality-weighted patent output of biofuels but do not significantly impact commercial patenting. It is possible that due to patenting occuring outside the private sector, the private innovation was “crowded out” or discouraged, as useful technologies were the intellectual property of the academic or public sector, which produces more R&D toward the “advanced” biofuels feedstocks than the private sector (Albers 2016).
Biodiesel blend mandates had inconsistent and typically insignificant effects. This could be attributed to the comparably low number of observations in which any biodiesel blend mandates were present; only 15 of the 287 contemporaneous observations had any type of mandate for biodiesel. Likely due to this, there were high estimated variances for the coefficients. These policies reduced or did not significantly impact raw patent counts for biofuels depending on the time period. Since raw patent counts for biofuels, as well as the other categories, were not impacted by the biodiesel mandates in those time periods, we do not take this as evidence that the policy drove the increase in innovation.
2.4.2
Other Policies
Import measures did not have a significant effect on raw patent counts. However, in the contemporaneous period these policies reduced the quality-weighted patents in plant categories. In the specification with a two-year lag, quality-weighted patents increased in all three categories.
Intermediate supplier incentives increased raw plant patenting and decreased weighted biofuels patenting. This finding, however, was not consistent when applying leads or lags to the policies.
two-year lagged version showed an increase in plant raw patent count and quality-weighted patent counts. A one-year lag of producer investment incentives produced a significant increase in biofuels raw patent counts without an increase in quality-weighted patent counts. However, even though there was no significant increase in raw patent counts in plant patenting or BP patenting, each had increases in quality-weighted patents in response to producer investment incentives. With a one-year lead or two-year lead, there were no significant coefficients for these policies. It is possible that firms adjusted their timing in order to take advantage of the policies, but once policies were in effect, they consistently increased efforts in at least one category while not decreasing effort anywhere else.
While R&D support, a measurement of government spending on research, should have a similar effect, it did not increase R&D spending by private firms as proxied by raw patent counts. Quality-weighted counts for biofuels and BP decreased. Quality-weighted plant patenting did increase significantly, despite R&D support not resulting in increased plant inputs. It is possible that government and university R&D, while not reflected in the research effort of private firms or their output of biofuels and BP research, is increasing R&D output for private firms in the plant sector via spillover, in turn crowding out private firms’ research by raising the status quo technological level.
Tax incentives had a significant, negative effect for all dependent variables in the con-temporaneous period. In other specifications, there were either significantly negative coefficients or no significant effect.
2.4.3
Controls: Environmental Policies, Agricultural and Energy Prices,
and Knowledge Stock
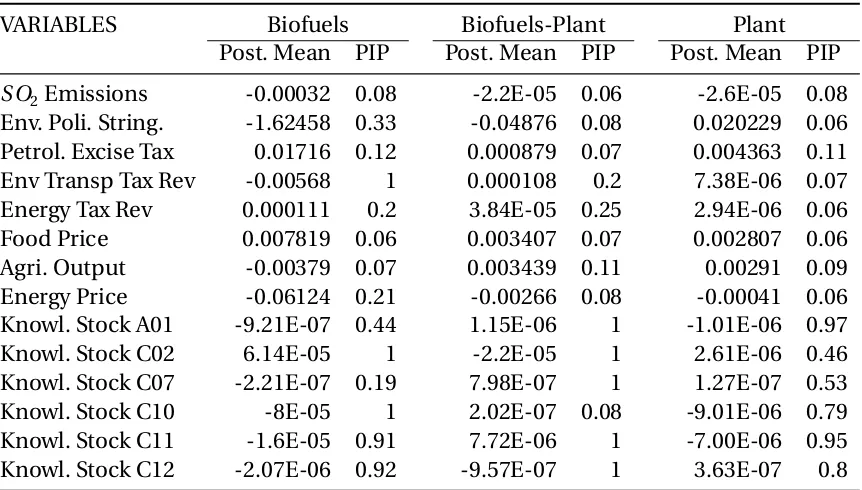
We assigned control variables to the auxiliary regressor set in the BMA process. Therefore, we interpret as significant those variables with posterior inclusion probabilities greater than .5, as these regressors were included in the true model with greater than 50 per cent likelihood. The coefficients are computed in the same manner as the “focus” regressors. Tables 2.6 and 2.7 show the results for the control variables. For these tables, the estimates are from the specification with all control variables, so only 20 countries were included in the sample. Brazil was excluded due to the absence energy price index data. When Brazil was included but the energy price index variable was omitted, there were not major differences.
Other environmental variables did not significantly impact raw patenting in any of the IPCs considered.
These findings do not strongly support the Porter hypothesis that environmental reg-ulation can promote R&D and leave an industry more efficient. Instead, the findings are limited, with vehicle taxes contributing negatively to biofuels research effort. The energy policy stringency index, a more comprehensive measurement of regulations, had a negative effect on R&D output but did not affect R&D inputs in any categories.
Energy prices, measured by the energy price index variable, had a significant, positive effect on raw patent counts for plant IPCs. None of the other indices related to prices or production levels were significant.
Though the small set of countries in the sample prevented creating trade dyads to inves-tigate international impacts, we did include a global average of ethanol blend mandates for each year. Including this variable did not impact the sign or significance of the coefficients in the focus set, but in the auxiliary set, it did have a PIP greater than .5 for quality-weighted biofuels patenting, biofuels raw patent count, and bio-plant raw patent count.
Table 2.6: Auxiliary BMA Variables, Raw Patent Counts
VARIABLES Biofuels Biofuels-Plant Plant
Post. Mean PIP Post. Mean PIP Post. Mean PIP
S O2Emissions 0.000858 0.07 0.000217 0.07 0.001356 0.1
Env. Poli. String. -8.55981 0.31 -0.11439 0.06 -5.23224 0.36 Petrol. Excise Tax 0.061413 0.1 -0.01891 0.1 -0.06143 0.14 Env Transp Tax Rev -0.02509 0.98 0.002552 0.54 0.000922 0.18 Energy Tax Rev 0.001274 0.34 4.63E-05 0.09 1.53E-05 0.06
Food Price -0.22638 0.11 0.059404 0.11 -0.2119 0.17
Agri. Output 0.001341 0.06 0.006077 0.07 0.056568 0.14 Energy Price -0.02818 0.06 0.04465 0.13 0.821917 0.66 Knowl. Stock A01 -1.02E-06 0.19 6.60E-06 1 -6.41E-06 0.98 Knowl. Stock C02 0.000342 0.98 -9.6E-05 0.97 -4.71E-06 0.18 Knowl. Stock C07 -1.4E-05 0.99 3.86E-06 0.98 -1.70E-07 0.22 Knowl. Stock C10 -0.00055 1 -3.1E-05 0.57 -8.6E-05 0.96 Knowl. Stock C11 0.000197 1 1.76E-05 0.61 2.06E-07 0.12 Knowl. Stock C12 -4.62E-07 0.13 -5.29E-06 1 2.88E-06 0.97
Posterior means (Post. Mean) are reported along with posterior inclusion probabilities (PIP) for each variable.
Table 2.7: Auxiliary BMA Variables, Quality-Weighted Patents
VARIABLES Biofuels Biofuels-Plant Plant
Post. Mean PIP Post. Mean PIP Post. Mean PIP
S O2Emissions -0.00032 0.08 -2.2E-05 0.06 -2.6E-05 0.08
Env. Poli. String. -1.62458 0.33 -0.04876 0.08 0.020229 0.06 Petrol. Excise Tax 0.01716 0.12 0.000879 0.07 0.004363 0.11 Env Transp Tax Rev -0.00568 1 0.000108 0.2 7.38E-06 0.07 Energy Tax Rev 0.000111 0.2 3.84E-05 0.25 2.94E-06 0.06 Food Price 0.007819 0.06 0.003407 0.07 0.002807 0.06 Agri. Output -0.00379 0.07 0.003439 0.11 0.00291 0.09 Energy Price -0.06124 0.21 -0.00266 0.08 -0.00041 0.06 Knowl. Stock A01 -9.21E-07 0.44 1.15E-06 1 -1.01E-06 0.97 Knowl. Stock C02 6.14E-05 1 -2.2E-05 1 2.61E-06 0.46 Knowl. Stock C07 -2.21E-07 0.19 7.98E-07 1 1.27E-07 0.53 Knowl. Stock C10 -8E-05 1 2.02E-07 0.08 -9.01E-06 0.79 Knowl. Stock C11 -1.6E-05 0.91 7.72E-06 1 -7.00E-06 0.95 Knowl. Stock C12 -2.07E-06 0.92 -9.57E-07 1 3.63E-07 0.8
2.5
Conclusion
This study demonstrates that biofuels policies affect private sector R&D in biofuels and agricultural biotechnology. Ethanol blend mandates were clearly associated with increased R&D effort in biofuels and higher total production of quality-weighted patent output. Biodiesel blend mandates and others produced less noticeable effects in regard to this ben-efit. Previous literature has empirically demonstrated effects on food prices and emissions, while theoretical analysis suggests that only in the presence of innovation would biofuels mandates be welfare improving over status quo approaches (Clancy and Moschini 2017).
While the impact of energy policy on innovation in other forms of alternative energies has been rigorously studied, biofuels were not included in these studies. We found that, similar to previously studied policies, certain biofuels blend mandates correlated with increased innovation. We extend our analysis of policy impacts by examining if policies impacting biofuels R&D have effects on innovation in other fields. Evidence of spillover ef-fects is present, but only certain policies cause firms to incorporate these benefits into their investment strategies. The countervailing impact is substitution of aggregate R&D effort away from plant biotechnology. There is evidence that this effect negates the innovation gains in plant biotechnology that could be realized from the spillover effect. While biofuels policies can increase demand for biofuels, incentives for producing greater amounts of plant biotechnology remain unchanged or could even be reduced by land use changes favoring biofuels. Therefore, due to the technological spillovers from biofuels research, firms reduce their investment in bio-plant R&D, remaining at the same technological level and, therefore, the same level of output.