Throttle Sensitivity and Dynamic analysis of
Power Control system of a Light Transport
Aircraft Engine
Sachin Khot 1, Jayagopal S 2, Vinay C A 2, C S Venkatesha 3
PG Student, Department of Mechanical Engineering, University B.D.T College of Engineering, Davangere, India 1
Scientist, C-CADD, CSIR-National Aerospace Laboratories, Bangalore, India 2
Professor, Department of Mechanical Engineering, University B.D.T College of Engineering, Davangere, India 3
ABSTRACT: The Light Transport Aircraft is powered by two turboprop engines. The response of turboprop engine in terms of throttle sensitivity has been investigated experimentally by testing port engine and its control systems. The trend signifies that at lower power rating the throttle sensitivity is least. At higher power rating the engine shows extremely higher throttle sensitivity. This offers difficulties to maintain the test points during flight test. In this paper an attempt was made to model engine power control system using CAD software and dynamic analysis was carried out using ADAMS software. The dynamic analysis signifies the response curves for operating parameters of the power control system.
KEYWORDS: Turboprop Engine, Light Transport Aircraft, Power Rating.
I. INTRODUCTION
The response of an aircraft engine is a primarily an important concern for sustainable flight operations. The throttle sensitivity of engine offers the precise control over the aircraft during flight conditions by pilot. The electronic throttle controlling such as Full Authority Digital Engine Control (FADEC) methods are most trending but cost effective design recalls and assists the use of the traditional push-pull cable controlling systems in light transport aircrafts. The aircraft engine control system has main elements such as quadrant box unit having control levers arrangement at cockpit, control cable, fuel control unit (FCU) and necessary end fittings.
1. Turboprop Engine and Throttle Control
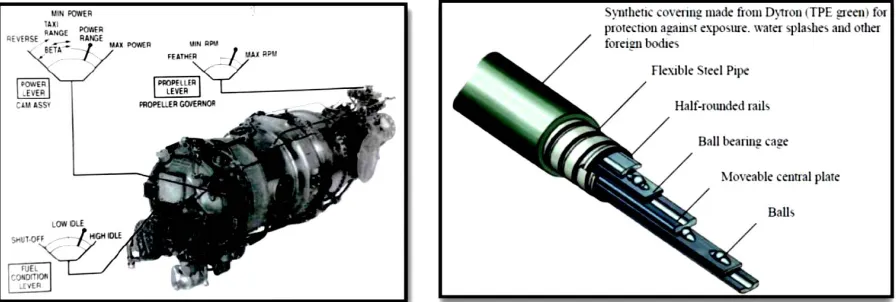
The turboprop engine of a light transport aircraft (LTA) is controlled by 3 levers, namely Fuel Lever (Condition Lever), Propeller Lever and Power Lever. The Figure 1. gives the outlined image of turboprop engine and also indicating the 3 control systems with their positions. The fuel lever has a main function of supplying the controlled metered rate of air fuel mixture to the engine according to the flight condition in 3 modes mainly Shut-off, Low Idle and High Idle. The propeller lever operates in 3 positions i.e. feathering, minimum rpm and maximum rpm respectively. The power lever controls the engine power in 3 positions, namely maximum reverse, minimum power and maximum forward. It can also control the propeller pitch in reverse. The throttle control of engine is nothing but simply a restriction flap to air fuel mixture flow in carburettor of an internal combustion engine where as in turboprop engine the power lever performs as throttle control. The power lever controls the fuel supply at FCU and simultaneously controls the propeller pitch to fulfil the power requirement. The throttle sensitivity is simply the output power or torque response of the engine which varies with input power demand through power lever by the pilot.
2. Flexball Control Cables
1. Literature Review
Yang Kun et al [2]. have investigated the performance of ball bearing cables for number of different single planar routings. Virtual models of the cable system are developed using CATIA software for the analysis purpose. The mathematical relations developed directly utilized for optimization and dynamic study. The well predictable response of throttle sensitivity of an aircraft engine is an important requirement for its operation. Here the attempt is made to estimate the trend of throttle sensitivity of light transport aircraft under development. The motivating factor for this study is the report statement given by researchers who carried the engine testing and highlighted the undesired response of engine power output for input demand by the power lever movement. Then the study is subsequently continued for dynamic analysis of power control system of LTA engine.
Figure 1: Turboprop Engine control System and Flexball Control Cable
2. Methodology of the Work
Experimental investigation of PLA and engine power output parameters during testing of the LTA.
Estimation of trend for throttle sensitivity using test data.
Solid Modelling of the power control system using a CAD software and Kinematic simulation
Dynamic analysis of the power control system model using analysis software MSC.ADAMS.
II. EXPERIMENTALINVESTIGATIONOFTHROTTLESENSITIVITYOFLTAENGINE
3. Experimental Setup
Generally in any aircraft there is a compact arrangement of all components present in system. The measurement of input power lever angle on the quadrant box is carried out practically by creating a physical angular scale on the quadrant box for port side/Left Hand engine (LH). For precision reading there is a one digital potentiometer reading also available for quick check. Similarly the PLA angle on the engine at nacelle is practically measured using suitable bevel protractor. The pivoted arm of the protractor is used to measure the movement of PLA arm in FCU. The output power of the engine is indicated by display available at cockpit by the name Torque.
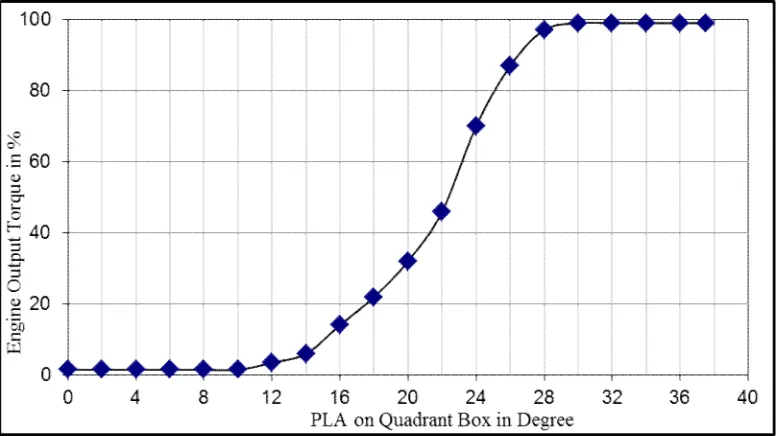
4. Test Data and Interpretation of Throttle Sensitivity
Table 1: Test Data.
PLA in cockpit (degree) PLA on engine (degree ) Output torque, %
0 0 0
2.64 5 1.6
5.23 10 1.6
7.85 15 1.6
10.37 20 1.6
13 25 3
15.61 30 6.6
18.17 35 8
20.72 40 18
23.19 45 42
25.61 50 60
28 55 76
31 58 100
33 60 100
37.5 60 100
This response trend is known as engine throttle sensitivity. From idle to forward up to 10 of PLA the engine power is same called dead band. Further PLA versus Torque response is linear up to 70% which is acceptable for typical aircraft operation. But at higher power rating say at 70 to 100% the slope is steeper and with a PLA of only 6 leads directly power from 70 to 100%. This drastic rise in engine output is unpredictable and not acceptable because in this range it is very difficult to control the engine power for predefined test points such as at 82%, 90% torque etc.
III.DYNAMICANALYSISOFPOWERCONTROLSYSTEMOFLHENGINE
The discussion is made for steps involved in solid design modelling of power control system with all end connections. Modelling involves part design and assembly. Then the model is simulated and was imported in MSC.ADAMS (Advanced Dynamic Analysis for Mechanical Systems) software for dynamic performance evaluation.
1. Solid Modelling
The first step consists of collection of material properties of the components to be modelled. In present model all components along with cable system are made up of stainless steel material. The part design of individual components of the power control system is done with all geometrical constraints. Initially the cable system is modelled by referring the spline which represents the routing path. The cross section profile of all cable parts are lofted along the spline to create the cable parts. Then these cable parts are assembled and made to enclose inside the cylindrical casing so it resembles a real cable. The assembled model of Flexball cable is shown in Figure 3.
The part design of end fittings at Quadrant box are done with dimensional concern and assembly of these components is done by assigning suitable revolute and translation joints. Model of Power Control System was Imported in MSC.ADAMS. The further simulation and analysis is carried out in MSC.ADAMS software. Finally the part design of engine FCU connection arm also made. Now the whole control system assembly is carried out for subsystems such as Quadrant box power lever arrangement, Flexball cable through its routing and power lever at fuel control unit.
Figure 3: Model of Power Control System Imported in MSC.ADAMS Tool.
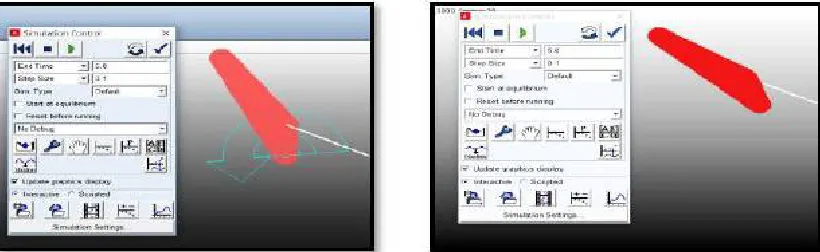
2. Kinematic Simulation
The model is simulated to see the working of assembled parts and joints properly. During this simulation, the power lever moves in an angular passion in CCW direction of 37.5 about its pivoted position which is as per aircraft operation. According to lever movement cable moves and this movement transferred to the end rod attached to this cable at FCU which also shows linear movement. The positions of the power lever before and after the input simulation are shown in Figure 4.
3. Dynamic Analysis and Results and Discussions
The change in angular position of the power lever is about 37.5 from idle position to maximum forward position is plotted in Figure 5. At the same time simultaneously the linear connecting rod at FCU shows a change in linear position of about 36mm.
To perform the above said motion the FCU rod has to overcome a resistance load of 2.943N (0.3kgf) offered by engine FCU. The load required to operate the power lever at cockpit is around 24.52N (2.5 kgf) is also imposed in model to bring the system for realistic effect. The coefficient of friction is taken as = 0.5 for cable system.
Figure 5: Angular Position of Power Lever and Linear Displacement of FCU Connection Rod during Maximum Forward Condition by ADAMS Tool.
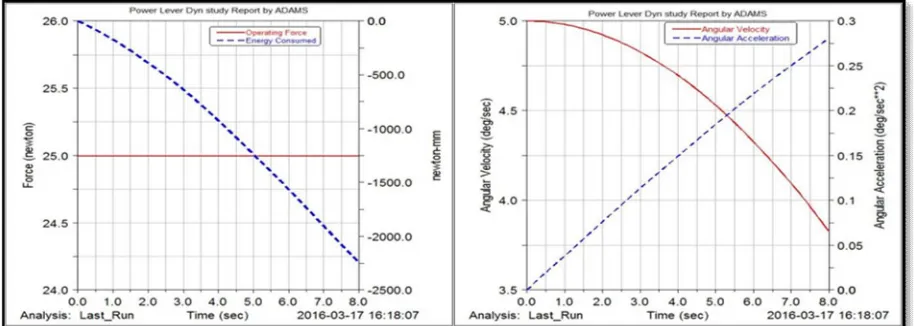
For dynamic study the input angular velocity for power lever is defined at a rate of 5deg/sec. The figure 6. explains that the energy consumed for power lever actuation is approximately 2250 N-mm (-229Kgf-mm) and the negative sign indicates energy consumed during movement. The operating force is of around 25N (2.5Kgf), which is constant throughout the simulation.
The angular velocity of the lever decreases during simulation time from zero at beginning to 3.8deg/sec at the end. The angular acceleration of the power lever about its centre of gravity shows the increasing trend from 0 to o.27deg/sec-2.
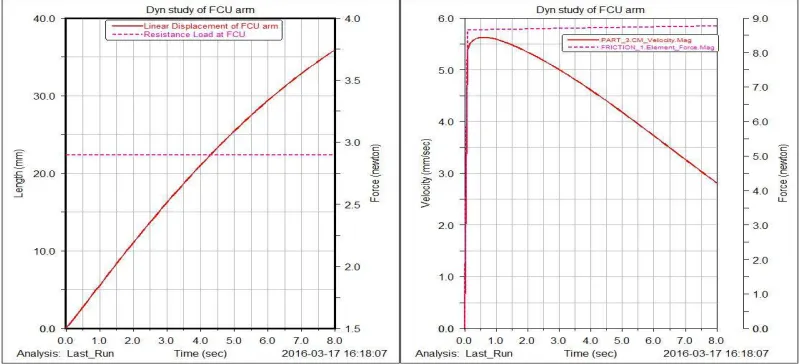
The connection arm in FCU is being moved by the actuation from cable connecting from the power lever of cockpit. The cable shows a linear motion of around 37.5 mm during simulation time and which is shown by the solid curve of first plot in Figure 7. The resistance load imposed by the engine is 2.7N (0.27 Kg-f) which is given by constant dotted line.
The second plot of Figure 7. signifies the friction force during the displacement from initial position to final position which is approximately 8.8N (0.9 Kg-f). The linear velocity of the arm is initially 0mm/sec and it decreases to 2.9mm/sec at the end position. This analysis has a scope for studying the response of the engine in operation with respect to engine control on demands by pilot.
Figure 7: Dynamic Response of connection Arm in FCU on Engine by ADAMS Tool.
IV.CONCLUSION
The experimental study of turboprop engine control system predicted the throttle response of the engine. The response curve signified the undesired high sensitivity at power output range more than 70% and very less sensitivity in the power range of less than 12%. It is suggested that the sensitivity to be increased at lower power rating of the engine and the sensitivity should be decreased at higher power ratings. Thus the dynamic model developed for the port (LH) engine power control cable is in good agreement with the experimental investigated data. Hence the dynamic model developed can be used for modifying the power control cable response for the required range.
The new methodology introduced here for dynamic analysis of power cable control systems is an advantageous technique which reduces the computation time. The results are easily accessible by MSC.ADAMS software. In this part the velocity response, acceleration response and energy consumption are computed. The linear displacement responses of both the power lever at quadrant box and connection arm at FCU was also carried out. The results obtained from dynamic analysis can be used for FEM study, mode study and for the design of similar control systems.
REFERENCES
[1] “Cables and Controls Rods”, the Drallim group -Cables and Controls Brochure, February 2013.
[2] Yang Kun, Tu Qiuye and Cai Yuanhu. “Performance Analysis of Ball Bearing Controls for Engine Operating System”, 29th congress of the