| INVESTIGATION
Mutation Rate Evolution in Partially Sel
fi
ng and
Partially Asexual Organisms
Camille Gervais*,†and Denis Roze*,†,1
*Centre National de la Recherche Scientifique (CNRS), UMI 3614, Evolutionary Biology and Ecology of Algae, Roscoff, 29688 France and†Sorbonne Universités, UPMC Université Paris VI, Roscoff, 29680 France
ABSTRACT Different factors can influence the evolution of the mutation rate of a species: costs associated with DNA replication fidelity, indirect selection caused by the mutations produced (that should generally favor lower mutation rates, given that most mutations affectingfitness are deleterious), and genetic drift, which may render selection acting on weak mutators inefficient. In this paper, we use a two-locus model to compute the strength of indirect selection acting on a modifier locus that affects the mutation rate toward a deleterious allele at a second, linked, locus, in a population undergoing partial selfing or partial clonality. The results show that uniparental reproduction increases the effect of indirect selection for lower mutation rates. Extrapolating to the case of a whole genome with many deleterious alleles, and introducing a direct cost to DNA replicationfidelity, the results can be used to compute the evolutionarily stable mutation rate, U. In the absence of mutational bias toward higherU, the analytical prediction fits well with individual-based, multilocus simulation results. When such a bias is added into the simulations, however, genetic drift may lead to the maintenance of higher mutation rates, and this effect may be amplified in highly selfing or highly clonal populations due to their reduced effective population size.
KEYWORDSclonality; deleterious mutation; modifier model; multilocus population genetics; self-fertilization
R
ATES of spontaneous mutation per nucleotide and per cell division span several orders of magnitudes within eukary-otes (e.g., Sung et al. 2012; Lynch et al. 2016), providing evidence that mutation rates evolve over long timescales. Furthermore, mutation rate variation within a species has been documented in various groups of organisms including bacteria, green algae, and fruit flies (e.g., Demerec 1937; Woodruff et al. 1984; Miller 1996; Haag-Liautard et al. 2007; Nesset al.2015), suggesting that mutation rates may possibly change rapidly if natural selection can act upon this genetic variation. Changes in mutation rates have indeed been observed during evolution experiments (Sniegowski et al.2000): for example, increased mutation rate in evolving populations of bacteria due to thefixation of mutator geno-types (e.g., Sniegowskiet al.1997), or decreased mutationrate in populations of Drosophila exposed to X-irradiation during several generations (Nöthel 1987).
Starting with Sturtevant (1937), a number of evolutionary forces that may influence the evolution of mutation rates have been identified (Drake et al. 1998; Sniegowski et al. 2000; Baeret al.2007; Lynch 2010). Because most mutations affectingfitness are deleterious (Eyre-Walker and Keightley 2007), alleles coding for higher mutation rates should be associated with less fit genetic backgrounds, thus favoring reduced mutation rates. Using a two-locus modifier model in which one locus affects the mutation rate between alleles at a linked locus directly affecting fitness, Kimura (1967) showed that the strength of selection to reduce muta-tion in a panmictic, diploid populamuta-tion is approximately sh du=ðrþshÞ; where du is the change in mutation rate caused by the modifier locus,rthe recombination rate be-tween the two loci, and sh the heterozygous effect of the deleterious allele, assumed different from zero—see Karlin and McGregor (1974) for the case of a fully recessive delete-rious allele. This result was later generalized by Kondrashov (1995), Dawson (1998, 1999), Johnson (1999a), and Lynch (2008) to the case of modifiers changing the deleterious mu-tation rate over a whole genome. In asexual populations, this Copyright © 2017 by the Genetics Society of America
doi:https://doi.org/10.1534/genetics.117.300346
Manuscript received April 19, 2017; accepted for publication September 28, 2017; published Early Online October 2, 2017.
Supplemental material is available online atwww.genetics.org/lookup/suppl/doi:10.
1534/genetics.117.300346/-/DC1.
1Corresponding author: Centre National de la Recherche Scientifique, Station
effect may be compensated by the higher rate of production of beneficial alleles by mutator genotypes, which may lead to transient increases in mutation rate when mutators hitchhike with the beneficial alleles they created (e.g., Leigh 1970; Eshel 1973; Taddei et al. 1997; Tenaillon et al. 1999; André and Godelle 2006). In sexual populations, however, recombination destroys the association between mutators and beneficial alleles, and selection for reduced mutation due to the effect of deleterious alleles should generally pre-vail (Leigh 1970; Johnson 1999b).
The maintenance of nonzero mutation rates is often con-sidered as the result of two opposing forces: selection for reduced mutation rates due to the deleterious effect of most mutations, and the intrinsic cost of DNA replicationfidelity (e.g., Kimura 1967; Drakeet al.1998; Sniegowskiet al.2000; Baer et al. 2007). More recently, Lynch (2008, 2011) pro-posed that the equilibrium value of the mutation rate may instead result from a balance between indirect selection and genetic drift: indeed, once the mutation rate has decreased to a very low level, the strength of selection for further increases in replicationfidelity may become weaker than genetic drift. The mutation rate would thus reach higher values in popu-lations with lower effective population size,Ne;due to less efficient selection acting on modifier alleles reducing muta-tion: this agrees with the observation that the mutation rate is lower in species with larger estimatedNe(Lynch 2010; Sung et al.2012; Lynchet al.2016).
Based on the above-mentioned results of Kimura (1967), reproductive systems that reduce effective recombination rates (such as selfing or clonality) should increase the strength of selection for lower mutation rates (as mutators tend to stay longer associated with the deleterious alleles they produce). In the extreme case of full selfing or full clon-ality, the strength of selection against a mutator allele becomes equivalent to the increase in mutation load that it causes: neglecting drift, this corresponds to the increase in mutation rate caused by the mutator (e.g., Sturtevant 1937; Drakeet al.1998). Using multilocus simulations incorporat-ing a cost of replication fidelity, Sloan and Panjeti (2010) showed that the equilibrium deleterious mutation rate is in-deed lower in asexual than in sexual populations, generating an indirect benefit for asexuality. With selfing, selection for lower mutation rates should be further enhanced by the in-creasedfitness effect of deleterious alleles due to increased homozygosity. However, background selection may strongly reduce the effective size of highly selfing or clonally repro-ducing populations (Nordborg 1997; Glémin and Ronfort 2013; Agrawal and Hartfield 2016; Roze 2016), which, according to Lynch’s (2010) hypothesis mentioned above, may possibly increase the equilibrium mutation rate. The overall effect of selfing or clonality on the evolution of muta-tion rates thus remains unclear, and has been little explored. In this paper, we extend Kimura’s (1967) two-locus model to compute the strength of indirect selection acting on a mu-tation modifier locus in a partially selfing or partially clonal diploid population. The results confirm that uniparental
reproduction increases selection against mutator alleles due to stronger associations with deleterious alleles. Under partial selfing, the strength of indirect selection generated by closely linked loci can be approximated by replacingrandhin Kimura (1967)’s result by effective recombination and dominance co-efficientsrð12FÞandhð12FÞ þF(e.g., Glémin and Ronfort 2013; Hartfield and Glémin 2016; Roze 2016). However, this approximation underestimates the effect of more distant loci, which may become important when the selfing rate is high. We then extrapolate from this two-locus model to derive expres-sions for the genomic deleterious mutation rate at equilibrium between indirect selection generated by deleterious alleles and the cost of replicationfidelity, and show that these expressions correctly predict the outcome of individual-based multilocus simulations. Finally, using two different simulation models with different assumptions on the genetic architecture of the mutation rate, we show that consistent with Lynch’s (2010) hypothesis, populations with lower effective size may maintain higher mutation rates, provided that mutations increasing rep-licationfidelity (antimutator alleles) occur less frequently than those decreasing it (mutator alleles). In some cases, interme-diate rates of outcrossing lead to lower mutation rates than obligate outcrossing or obligate selfing/clonality, due to strong reductions in the effective size of highly selfing or clonal pop-ulations caused by background selection.
Methods
Two-locus model
Our analytical model represents a very large (effectively infin-ite) population of diploid individuals with discrete generations. As in Kimura (1967), we consider the evolution of a locus (denoted M) affecting the mutation rate at a second lo-cus (denotedA), which directly affectsfitness. Two alleles (denoted 0 and 1) segregate at each locus; we assume that allele 1 at locusAis deleterious, reducingfitness by a factor 12shin heterozygotes and 12sin homozygotes. For simplic-ity, we assume additivity at the mutation modifier locus (locus M), the mutation rate at locus A being u0; u0þdu; and u0þ2duin individuals with genotype 00, 01, and 11 at locus M, respectively. We assume that mutations from 0 to 1 and from 1 to 0 occur at the same rate; however, this hypothesis should not significantly affect the results, as the effect of back mutations will be negligible as long as the deleterious allele stays at low frequency in the population. We also introduce an intrinsic cost of DNA replication fidelity, so that individuals with lower mutation rates pay afitness cost. For this, we will assume that thefitness of an individual is multiplied by a func-tion,fc, that increases with the mutation rate, and will consider different forms of cost function. Individuals contribute to the next generation in proportion to their fitness; under partial selfing a proportionaof juveniles is produced by selfing, while
the recombination rate between the two loci. We assume that mutation occurs after selection, before recombination; however, assuming that mutation occurs just after recombination yields the same results (as long as the mutation rate depends on the genotype of the diploid parent).
Following previous works (e.g., Barton and Turelli 1991; Kirkpatrick et al.2002; Roze 2015, 2016), genetic associa-tions within and between loci are defined as follows. We de-fineXi;1andXi;2as indicator variables that equal 1 if a given individual carries allele 1 at locus i on its first or second haplotype, respectively, and 0 otherwise. The frequency of allele 1 at locus iin the whole population is thus given by pi¼E½ðXi;1þXi;2Þ=2;where E stands for the average over all
individuals. Defining the centered variableszi;1 andzi;2as
zi;1¼Xi;12pi; zi;2¼Xi;22pi; (1)
the genetic association between the setsSandTof loci pre-sent on the two haplotypes of the same individual is given by:
DS;T¼EzS;T; (2)
where
zS;T¼zS;1 zT;2þzS;2 zT;1
2 ;
zS;1¼ Q
i2Szi;1; zT;2¼ Q
i2Tzi;2
(3)
(note thatDS;T¼DT;S), and where setsSandTmay be the
empty set∅,M,AorMA:Associations between genes present on the same haplotype of an individual (DS;∅) will be simply
denotedDS:For example,DM;M ¼E½ðXM;12pMÞðXM;22pMÞ
is a measure of the departure from Hardy-Weinberg equilib-rium at locusM, whileDMArepresents the linkage
disequilib-rium (LD) between lociMandA(genetic association between alleles present on the same haplotype). Similarly,DM;A
mea-sures the association between alleles at lociMandApresent on different haplotypes of the same individual.
In the following, we assume that both loci have weak effects (s,dusmall) and derive an expression for the change inpM(the
frequency of allele 1 at locusM) to thefirst order insanddu:We will see that this expression includes different forms of genetic associations. Assuming that the effective recombination rate is large relative todu;we will then use a quasi-linkage equilibrium approximation (QLE) to express these associations in terms of allele frequencies, and of the different parameters of the model. Finally, the result will be extrapolated to compute the overall strength of selection on a modifier allele affecting the mutation rate at a large number of selected loci, assuming that genetic associations between those loci can be neglected.
Multilocus simulations
Our simulation program (written in C++ and available from Dryad) is modified from Roze (2015, 2016), and represents a
finite population ofNdiploid individuals whose genome
consists in a linear chromosome along which deleterious mu-tations occur every generation. For simplicity, all mumu-tations have the same selection and dominance coefficients (s,h). A mutation modifier locus is located at the midpoint of the chromosome, and controls the deleterious mutation rate (the mutation rate of an individual being the average of the values coded by its two modifier alleles). At the start of each generation, thefitness of every individual is computed as
W¼fcðUÞð12shÞið12sÞj (4)
where U is the deleterious mutation rate of the individual (per haploid genome);fc the function representing the cost of replicationfidelity; andi,jare the number of heterozygous and homozygous deleterious alleles present in the genome of the individual. In general, we will use the cost function fcðUÞ ¼e2c=U;but different functions will also be considered
(as explained in theResultssection). To form each of theN juveniles of the next generation, an individual is sampled randomly to serve as a maternal parent. If thefitness of the individual (divided by the maximalfitness in the population) is higher than a random number sampled from a uniform distribution between 0 and 1, the individual is retained, oth-erwise another individual is sampled until the test is satisfied. Under partial selfing, the mother self-fertilizes with probabil-ity a, in which case the new individual is formed by two recombinant chromosomes from the same parent. Under par-tial asexuality, the mother reproduces clonally with probabil-ityg, in which case the genome of the new individual is a copy of the maternal genome. If the mother reproduces by out-crossing (with probability 12aor 12g), a second individ-ual is sampled using the same procedure as above to serve as a father, and the genome of the new individual is generated from recombinant chromosomes from both parents. During meiosis, the number of cross-overs is sampled from a Poisson distribution with parameterR(genome map length, in Mor-gans), and the position of each cross-over is sampled from a uniform distribution. The parameter R will typically take large values (R¼20) in order to mimic a whole genome with multiple chromosomes. Deleterious mutations occur once the parents have been selected, before recombination (note that different offspring from the same parent will carry different new mutations). The number of new deleterious mutations on each chromosome is sampled from a Poisson distribution whose parameter corresponds to the mutation rate of the parent, and the position of each new mutation is sampled from a uniform distribution along the chromosome. Back mutations do not occur, and any deleterious allele that has reachedfixation is removed from the population in order to increase execution speed.
During a number of preliminary generations (usually 2000), the deleterious mutation rate of each individual (per haploid genome) is set toUinit¼0:1:Then, new alleles coding for different mutation rates can appear at the modi-fier locus (at ratemM¼1023 U per generation, whereU is
mutation occurs at the modifier locus, the mutation rate coded by the new allele is sampled from a Gaussian distribu-tion centered on the value of the allele before mutadistribu-tion, with variances2
M¼1024(if the new value is negative, it is set to
zero). As explained in the Results section, different muta-tional models were also considered, including a bias toward higher values of Uand scaling of s2
M with U. The program
generally runs for 106generations, the equilibrium mutation rate being computed by averaging over the last 83105 generations.
A second simulation program considers a different genetic architecture for the mutation rate: instead of being coded by a single locus,Udepends on 1000 biallelic loci evenly spaced along the chromosome. Alleles at each of these loci are denoted 0 and 1; genotypes carrying alleles 0 at all loci have mutation rateUmin¼0:01:At each locus, allele 1 increases the mutation rate, by an amount that is sampled (indepen-dently for each locus) from an exponential distribution with parameterl. The effects of alleles 1 at the same or at different loci are additive. During thefirst 2000 generations, all loci affecting the mutation rate arefixed for allele 0; then, during 106 generations mutations occur at rate 1025 U at each of these loci (mutations and back mutations occur at the same rate). Selection and recombination are implemented as in the previous program.
Data availability
The authors state that all data necessary for confirming the conclusions presented in the article are represented fully within the article. Data available from the Dryad Digital Re-pository:http://dx.doi.org/10.5061/dryad.1j6b0.
Results
Change in frequency at the mutation modifier locus
In the Appendix, we show that an expression for the change in frequency of allele 1 at locusM, to thefirst order induandsis given by:
DpM dudlnfc
du ð1þFÞpMqM 2 shDMAþDM;A
2sð122hÞDMA;A:
(5)
The term on thefirst line of Equation 5 represents the effect of the cost of replication fidelity, favoring alleles that increase the mutation rate. This direct selective pressure increases with the rate of inbreeding (1þFfactor), due to increased homozygosity at locusM. The term on the second line repre-sents the effect of indirect selection disfavoring mutator al-leles, as these alleles tend to be more often associated with the deleterious allele at the second locus. Indeed, DMA and
DM;A represent the association between allele 1 at locusM
and the deleterious allele at locusAon the same or on the other haplotype, whereas DMA;A represents the association
between allele 1 at locusMand homozygotes for the deleterious
allele at locusA. We now derive expressions for these associa-tions at QLE.
Expressions for genetic associations
In the following,Dsel
S;T;DmutS;T;andD9S;Tdenote genetic
associa-tions measured after selection, mutation, and recombination/ segregation (respectively). Recursions for genetic associations over each step of the life cycle are computed to thefirst order in sanddu:We will also assume that the deleterious allele stays at low frequency and neglect terms inpA:Under high effective
recombination, it is sufficient to express associations to thefirst order indu;neglecting terms ins. However, these expressions diverge when the effective recombination rate tends to zero [due to termsrð12aÞorrð12gÞin their denominators]. To obtain more accurate expressions for the case where the effec-tive recombination rate is of orders(assuming that the dele-terious allele stays at mutation-selection balance and thatduis sufficiently small, so that the QLE approximation holds), we include terms insin the recursions for genetic associations, by computing the effect of selection on these associations.
Selection:To leading order, the effect of selection onDMAcan
be written as:
DselMAE
W W
zMA;∅þz∅;MA
2
:: (6)
Note that Equation 6 is an approximation, as it neglects the change due to selection of allele frequenciespM andpAthat
appear inzMA;∅andz∅;MA(see Equation 1). However, taking
this change in allele frequencies into account would intro-duce a term DselpM3DselpA of order d us (e.g., Equation
23 in Barton and Turelli 1991) that can be neglected here. From Equations 6 and A6, neglecting terms in ðduÞ2 and terms proportional topA;one obtains:
DselMA ð12shÞDMA2sð12hÞDMA;A: (7)
Similarly, one arrives at:
DselM;A ð12shÞDM;A2sð12hÞDMA;A; (8)
DselMA;A ð12sÞDMA;A: (9)
Equations 7–9 show that selection tends to decrease genetic associations between the two loci, as it reduces the frequency of the deleterious allele in the population.
Mutation: The effect of genotype-dependent mutation on genetic associations can be computed as follows. Mu-tation changes the frequency of allele 1 at locus A to pmut
A ¼uð12pAÞ þ ð12uÞpA(whereuis the average
muta-tion rate at locusA), while in a given individual,XA;ichanges
to 12XA;iwith probabilityu(the mutation rate of the
DmutMA ¼
1 2E
XM;12pM
u12XA;1
þ ð12uÞXA;12pmutA
þXM;22pM
u12XA;2
þ ð12uÞXA;22pmutA
(10)
where E is the average over all individuals before mutation. ReplacingXi;jbyzi;jþpiandubyuþduðzM;1þzM;2Þ; Equa-tion 10 yields [after neglecting terms of orderðduÞ2and terms inpA]:
Dmut
MA ð122uÞDselMAþdu
pMqMþDM;M
ð122uÞDsel
MAþduð1þFÞpMqM:
(11)
Similarly, one obtains:
DmutM;A ð122uÞDselM;Aþduð1þFÞpMqM; (12)
DmutMA;A ð124uÞDselMA;A (13)
(indeed, one can show that the term induofDmut
MA;Ais of order
pA). Equations 11 and 12 show that the modifier effect
gen-erates an association between the allele increasing mutation and the deleterious allele at the other locus, either on the same or on the other haplotype. The buildup of DMA and
DM;A is stronger under inbreeding (term 1þFin Equations
11 and 12), due to increased homozygosity at the modifier locus: the probability that a deleterious allele is present in the same genome as an allele coding for higher mutation is in-creased when the high-mutation allele is also present on the other haplotype.
Recombination/segregation: The effects of recombination and segregation depend on the reproductive system. Under partial selfing, we have:
D9MA ¼ ð12rÞDmutMA þr DmutM;A (14)
D9M;A¼ a
2
DmutMA þDmutM;A (15)
D9MA;A a
2 h
DmutMA;Aþ ð12rÞDMAmutþr DmutM;A
i
; (16)
Equation 16 assuming that pA is small. Under partial
asexuality:
D9MA¼ ½12rð12gÞDMAmutþrð12gÞDmutM;A (17)
D9MA;A¼g DmutM;A; D9MA;A¼g DmutMA;A: (18)
QLE expressions:The expressions given above can be used to compute solutions forDMA;DM;A; andDMA;A at QLE,
corre-sponding to the equilibrium values of genetic associations for given values of allele frequencies (under the assumption that
associations equilibrate fast relative to changes in allele fre-quencies). For the case of a partially selfing population, one obtains (assumingus;and thus neglecting terms inu):
DMA
duð1þFÞð1þ2FrÞpMqM
sheþr½12F2s½heð122FÞ2Fð22FÞ
(19)
DM;A
duð1þFÞFð1þ2rÞpMqM
sheþr½12F2s½heð122FÞ2Fð22FÞ
(20)
DMA;AF DMA (21)
with he¼hð12FÞ þF; and F¼a=ð22aÞ: Equations 19– 21 can be used to obtain the strength of indirect selection acting on the modifier locus, given by sind¼ 2s½hðDMAþDM;AÞ þ ð122hÞDMA;A=ðpMqMÞ (from
Equation 5):
sind 2
duð1þFÞs½he22FðF22heÞr
sheþr½12F2s½heð122FÞ2Fð22FÞ (22)
In the absence of selfing (a¼0),sindsimplifies to:
sind 2
du sh
12ð12shÞð12rÞ (23)
which agrees with the result obtained by Kimura when the modifier effect is weak (Equation 2 in Kimura 1967). Under complete selfing (a¼1),sindsimplifies to22du:
When linkage is tight (smallr), a separation of timescales argument yieldsDM;AF DMA(Nordborg 1997; Roze 2016):
this may also be seen from Equations 19 and 20, neglecting terms inrin the numerators. From this, one obtains thatsindis equivalent to the result obtained under random mating (Equation 23), replacing dubyduð1þFÞ;hby he andrby re¼rð12FÞ:This can also be obtained directly by neglecting the term inrin the numerator of Equation 22, and the term in rs in the denominator. Figure 1A compares the prediction from Equation 22 and the prediction obtained by replacing
du;h, andrin Equation 23 by effective parameters: both yield undistinguishable results when linkage is sufficiently tight, but discrepancies appear when loci are loosely linked.
Under partial asexuality, genetic associations at QLE are given by:
DMA
du½1þgrpMqM
shþr½12gþshð1þgÞ (24)
DM;A
dug pMqM
12gþshg; DMA;A ¼0: (25)
haplotype, that remain associated to the modifier allele due to clonal reproduction). As under complete selfing, one obtains thatsind¼ 22duunder full asexuality (g¼1). In both cases, the strength of indirect selection in the absence of recombina-tion corresponds to the increase in mutarecombina-tion load caused by the modifier (as the modifier allele stays associated with the deleterious alleles it generates). Under selfing, the increase in load equals the increase in haploid mutation rate (sinceL¼u under full selfing), which is 2duas individuals quickly become homozygous at the modifier locus. Under clonality, the in-crease in load is twice the inin-crease in haploid mutation rate (sinceL¼2u;assuminghis significantly.0), which isduas individuals stay heterozygous at the modifier locus.
Multilocus extrapolation and simulation results
These two-locus results can be extrapolated to the case of a modifier affecting the mutation rate in the whole genome by integrating sind over the genetic map. If the map length is sufficiently large, the overall effect can be approximated by assuming free recombination among all loci, replacingrby 1=2 and du by dU (the increase in haploid mutation rate caused by allele 1 at the modifier locus) in the expressions above. The evolutionarily stable mutation rate (at which in-direct selection to reduce the mutation rate exactly balances the cost of replicationfidelity) can then be obtained by solv-ingsdirectþsind¼0 forU, where the strength of direct selec-tion is given bysdirectdUð1þFÞdlnfc=dU;assumingdU is small (see Equation 5). Under partial selfing, and assuming free recombination, this yields
UESS
ffiffiffiffiffiffiffiffiffiffiffiffiffiffiffiffiffiffiffiffiffiffiffiffiffiffiffiffiffiffiffiffiffiffiffiffiffiffiffiffiffiffiffiffiffiffiffiffiffi c½22að32aÞð12sÞ
2s½aþhð22að1þaÞÞ
s
(26)
when the cost function is given by fcðUÞ ¼e2c=U; so that
dlnfc=dU¼c=U2:Equation 26 simplifies topffiffiffiffiffiffiffiffiffiffiffiffiffiffiffic=ð2shÞwhen
a¼0;and topffifficwhena¼1:The equivalent expression for partial asexuality is given by:
UESS
ffiffiffiffiffiffiffiffiffiffiffiffiffiffiffiffiffiffiffiffiffiffiffiffiffiffiffiffiffiffiffiffiffiffiffiffiffiffiffiffiffiffiffiffiffiffiffiffiffiffiffiffiffiffiffiffiffiffiffiffiffiffiffiffiffiffiffiffiffiffiffiffi c½12gþsh g½12gþshð1þ2gÞ
shð1þgÞ½2ð12gÞ þ3shg
s
; (27)
simplifying topffiffiffiffiffiffiffic=2under full asexuality (g¼1).
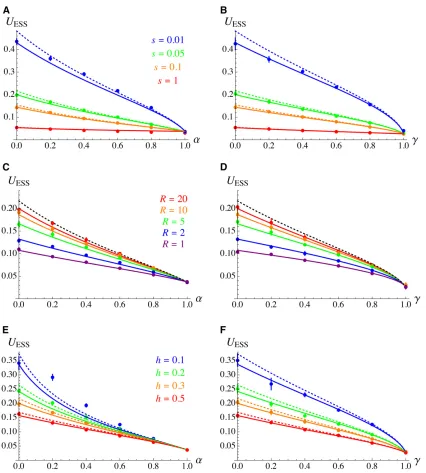
Figure 2 shows that the predicted value for the evolution-arily stable mutation rate obtained by integrating Equations 22, 24, and 25 over the genetic map (seeMathematicanotebook in
Supplemental Material,File S2for the integration) generallyfits well with the multilocus simulation results (using ourfirst sim-ulation program, with a single modifier locus). With a genome map length of 20M, the simpler expressions obtained assuming free recombination (Equations 26 and 27) also provide accurate predictions: discrepancies appear for lower values ofs, due to the fact that deleterious alleles segregate at higher numbers of loci, increasing the number of deleterious alleles that are closely linked to the mutation modifier locus. Figure 2, C and D show that integrating Equations 22, 24, and 25 over the genetic map also provides accurate predictions for lower values of map length R. As shown by Figure 2E, discrepancies between analytical and simulation results appear for low values ofhand intermediate selfing rates (h¼0:1;a¼0:2;0.4 in Figure 2E): these discrep-ancies are possibly generated by identity disequilibria between selected loci (correlations in homozygosity), which are neglected in the analytical model (the discrepancies observed fors¼0:01 in Figure 2A may also be caused by identity disequilibria).
Figure S1 inFile S1shows the approximations obtained for UESS when replacing h and r by the effective parameters hð12FÞ þF and rð12FÞ (under partial selfing) and r by rð12gÞ(under partial clonality) in the expression for indi-rect selection under random mating (Equation 23). Although these approximations tend to overestimateUESSby underes-timating the strength of indirect selection generated by dis-tant loci, they often stay relatively close to the more exact expressions given above, the discrepancy being stronger for intermediate selfing or clonality rates, and for weaker strength of selection against deleterious alleles.
Effects of population size and mutational bias
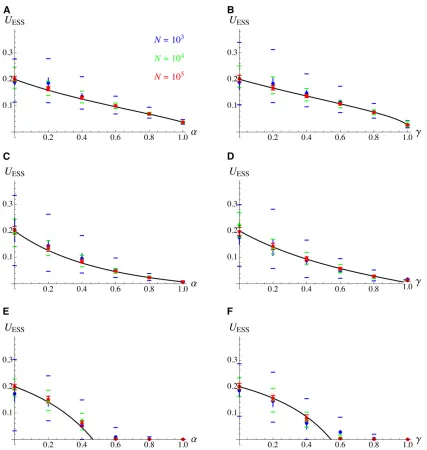
Figure 3, A and B show that changing population sizeNfrom 104to 103or to 105has little effect on the average mutation rate at equilibrium (although the variance of Uaround its average value increases as Ndecreases). This may seem at odds with the prediction of Lynch (2010) mentioned in the Introduction, which states that the mutation rate should be lower in populations with largerNe;in regimes where a sub-stantial proportion of mutations changingUare significantly affected by genetic drift. Indeed, averaging over the distribu-tion of mutadistribu-tional effects at the modifier locus, the mean value of 2jdUjsh (corresponding to the average strength of indirect selection acting on a new modifier allele under ran-dom mating and free recombination) is close to 1024in the simulations, and thus of the same order of magnitude as the
Figure 1 Strength of indirect selection acting on a mu-tation modifier locus (scaled bydu) as a function of (A) the selfing rate and (B) the clonality rate. Solid curves: predic-tions from Equapredic-tions 22, 24, and 25. Dashed curves in (A) represent predictions obtained by replacing du by duð1þFÞ;hbyhe¼hð12FÞ þFandrbyre¼rð12FÞ
strength of genetic drift (at least forN¼103and 104). Nev-ertheless, decreasingNfrom 1024 to 1023 does not signifi-cantly affect the average value ofUat equilibrium (see Figure 3). Similar results are obtained when using different forms of cost functionfc:In Figure 3, C and D,fcðUÞ ¼Uc;wherecis
set to0:007 so thatUESS0:2 under random mating for the parameter values used in Figure 3, according to our
approximations: as illustrated by Figure 4, the selection gra-dient obtained (dlnfc=dU¼c=U) is less steep aroundUESS than with the exponential cost function used in Figure 2 and Figure 3, A and B. Finally,fc¼ea Uþb=2U2
in Figure 3, E and F, yielding a linear selection gradient (dlnfc=dU¼aþb U). Parametersaandbwere set toa0:10 andb 20:35 so that UESS0:2 under random mating for the parameter
Figure 2 Evolutionarily stable mutation rate (per haploid genome) as a function of the selfing rate (A, C, and E) and the clonality rate (B, D, and F), for different values of the strength of selection against deleterious alleless(A and B), genome map lengthR(C and D) and dominance coefficient of deleterious alleles h(E and F). Solid curves: analytical predictions obtained by integrating Equations 22, 24, and 25 over the genetic map (see
Mathematicanotebook). Dashed curves: approximations for freely recombining loci (Equations 26 and 27). Dots: multilocus simulation results.
Param-eter values (unless specified otherwise):s¼0:05;h¼0:3;R¼20;N¼104(in the simulations). The cost function isf
c¼e2c=U;cbeing set to0:0014
so thatUESS0:2 under random mating whens¼0:05;h¼0:3 andR¼20 according to our analytical results. In this and the nextfigures, error bars
are computed by splitting the results from each simulation into batches of 105generations and computing the variance between batches. Error bars
show61:96 SE, and are smaller than the size of symbols in most cases. Simulations withs¼0:01 (A and B) lasted 107generations (instead of 106) in
values used in Figure 3, while the slope of the selection gradi-ent atUESSis the same as with thee2c=Ucost function used in
Figure 2 and Figure 3, A and B (see Figure 4). Because the mutation rate evolves to very low levels for these parameter values at sufficiently high selfing or clonality rates, we main-tained a minimum mutation rate ofmM¼1024at the modifier
locus in the simulation program to prevent that the population remains stuck in the absorbing state of perfect replication fidel-ity (U¼0). Figure S2 inFile S1shows the same simulation results as Figure 3, E and F, displayed on a log scale.
The reason for the limited effect of drift on the average value ofUobserved in Figure 3 is the absence of mutational
bias at the modifier locus: indeed, mutations increase or de-creaseUwith the same probability. Drift may have stronger effects when mutations affectingUtend to occur more often in a particular direction (Zhang and Hill 2008; Lynch 2011; Charlesworth 2013): most likely in the direction of increased values ofU, as it should be easier to impair DNA replication fidelity than to improve it. Indeed, when such a mutational bias is added in the simulation program (by introducing a parameterbsuch that a fractionb.0:5 of mutations at the modifier locus tend to increaseU), the mutation rate evolves toward higher values when population size is sufficiently small. When this is the case,U keeps increasing unless one
Figure 3(A and B) Same as Figure 2 for different values of population sizeN(in the simulations), and withs¼0:05;R¼20;h¼0:3;cost function fc¼e2c=U:The colored horizontal bars show the top and bottom 98th percentiles of the distribution ofUover the last 83105generations of the
simulation (once equilibrium has been reached). Black curves: analytical predictions obtained by integrating Equations 22, 24, and 25 over the genetic map. (C and D) Cost functionfc¼Uc;withc0:007:(E and F) cost functionfc¼eaUþb=2U
2
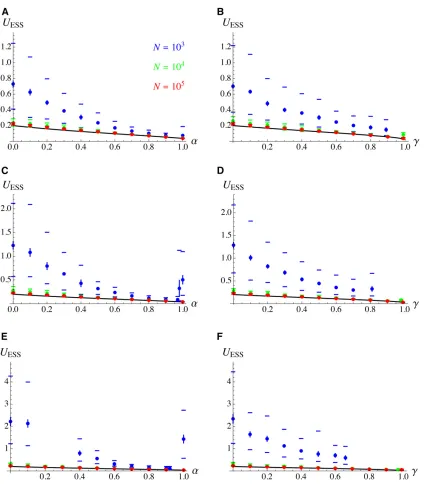
assumes that the average size of mutational stepsdUis pro-portional toU, so that fewer mutations mayfix by drift asU reaches higher values (e.g., Lynch 2011). Figure 5 shows the results of simulations in whichdUis sampled in a half-Gaussian distribution with SDsM U(for bothdU.0 anddU,0), where
U is the mutation rate coded by the modifier allele before mutation. For the parameter values used in Figure 5, the equilibrium mutation rate is slightly higher forN¼104than forN¼105;but generally remains close to the evolutionarily stable strategy (ESS) value (see Figure S3 inFile S1for the same results shown on a log scale). Genetic drift has a much stronger effect on the equilibrium value ofUwhenN¼103; however. As expected, increasing the degree of mutational bias (by increasingb) or decreasing the average size of mu-tational steps dU (by reducing s2M) amplifies the effects of
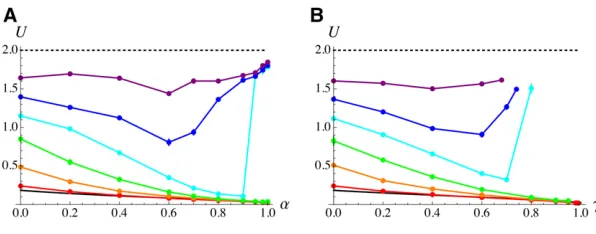
drift, causing higher values ofUto evolve. Intermediate self-ing or clonality rates brself-ingUcloser to its ESS value (by in-creasing the strength of indirect selection), but U may increase again asaorgapproach 1, due to background se-lection amplifying the effect of drift. In some simulations, background selection caused a runaway process in which the reduction inNeleads to elevated mutation rate, further reducingNe:When this is the case,Ureaches very high val-ues, and the program has to be stopped manually: this hap-pened for clonality rates higher than the right-most points in Figure 6, B, D, and F, and for a¼0:2; a¼0:3; and 0:93#a#0:99 in Figure 6E (while an equilibrium was reached fora¼1). As shown by Figure S4, Figure S5, Figure S6, and Figure S7 inFile S1, qualitatively similar results were obtained under the different cost functions shown in Figure 4. Similar results were also obtained using our second sim-ulation program, representing a more realistic genetic archi-tecture in which U is controlled by L biallelic loci. Since the minimal mutation rate (corresponding to the mutation rate of a genotype carrying allele 0 at each mutation modifier locus) isUmin;and since the heterozygous effect of each mod-ifier locus is sampled from an exponential distribution with parameterl(whose average is 1=l), the average value ofU should thus be close toUdrift¼UminþL=lin regimes where the evolution of U is mainly controlled by drift (assuming large L, and additivity within and between modifier loci). BelowUdrift;mutations at modifier loci thus tend to increase U (mutational bias). Figure 6 shows simulation results for
L¼1000;l¼500 and Umin¼0:01 (so thatUdrift 2). As can be seen on thefigure,Ubecomes closer to its mutation-drift equilibrium valueUdriftasNdecreases. Again, increasing the selfing rate or the clonality rate tends to reduceU by increasing the strength of indirect selection; however, above a given threshold for aor g (that depends on population size), U increases as the selfing or clonality rate increases (due to background selection effects). Note that we could not obtain estimates for the equilibrium mutation rate under high clonality rates (Figure 6B, on the right of the right-most points) because deleterious alleles tend to accumulate in the heterozygous state in the population, causing the program to become increasingly slow.
Discussion
It is widely accepted that mutation rates are maintained at low levels to avoid producing an overly strong burden of delete-rious alleles. In this paper, we confirm that this deterministic force favoring lower mutation rates is increased by uniparen-tal reproduction, and compute the strength of this effect in populations with intermediate selfing rates or clonality rates. In agreement with previous separation of timescales argu-ments (Nordborg 1997; Roze 2016), when linkage between loci is sufficiently tight, the result obtained under partial self-ing becomes equivalent to the expression obtained under random mating (Kimura 1967), replacing the dominance co-efficient of deleterious alleles and recombination rates by the effective parametershð12FÞ þFandrð12FÞ;however, this expression underestimates the strength of indirect selection generated by loosely linked loci. Introducing a directfitness cost associated with DNA replicationfidelity, we could obtain simple approximations for the evolutionarily stable mutation rate, which were confirmed by multilocus, individual-based simulations, in the absence of mutational bias at the mutation modifier locus.
When a mutational bias toward lower fidelity of DNA replication (i.e., higher mutation rate) is added into the model, the average value of the mutation rate at equilibrium becomes more sensitive to genetic drift, in agreement with general results on the evolution of quantitative traits under mutation, selection and drift (Zhang and Hill 2008; Charlesworth 2013). In that case, the mutation rateUmay
Figure 4 (A) The different cost functions used in Figure 3: dotted: fc¼e2c=U (with c0:0014); dashed: fc¼Uc
(with c0:007); solid: fc¼eaUþb=2U 2
(with a0:10;
b 20:35). In the last case, we assumed thatfc stays
equal to its maximum value of e2a2=2b
(obtained for Umax¼ 2a=b;here 0.3) whenU.Umax(i.e., direct
selec-tion vanishes whenU.Umax). (B) Selection gradients
reach high values when mutations affectingUhave a weak effect, so that the effect of indirect selection acting on these mutations becomes weaker than the strength of genetic drift: this is the essence of the argument proposed by Lynch to explain the observed negative correlation between estimated effective population sizeNeand the mutation rate (e.g., Lynch 2010; Sung et al. 2012; Lynch et al. 2016). However, the
mutational bias by itself is not a sufficient condition for U to stabilize around a value that depends onNe:This will occur under the extra assumption that the average size of muta-tional steps at mutation modifier loci increases with the mu-tation rate, so that the relative effect of drift at these loci becomes weaker as U increases (Lynch 2011, Figure 5 of the present article). Alternatively, when U is affected by a
Figure 5 Equilibrium mutation rate as a function of the selfing rate (A, C, and E) and the clonality rate (B, D, and F) for different values of population size N, with mutational bias at the modifier locus. Mutations at the modifier locus increaseUwith probabilityb, and decreaseUotherwise. In both cases, the mutational effectdUis drawn from a half-Gaussian distribution with SDsM U(whereUis the mutation rate coded by the modifier allele before mutation). (A and B)b¼0:9;s2
M¼0:01;(C and D)b¼0:95;s2M¼0:01;(E and F)b¼0:9;s2M¼0:0025:Other parameter values:s¼0:05;h¼0:3; R¼20;c¼0:0014 (fc¼e2c=U). Black curves: analytical predictions obtained by integrating Equations 22, 24, and 25 over the genetic map. For
clonality rates higher than the right-most points (in B, D, and F), deleterious alleles accumulate and the simulation has to be stopped beforeUhas reached its equilibrium value. Under partial selfing, a runaway leading to very high values ofUoccurred forN¼103anda¼0:2;a¼0:3 and
sufficiently large number of loci with a distribution of effects, the fraction of loci at which indirect selection is weaker than drift will decrease asNeincreases, which may also generate a negative relation between the average value of U and Ne (Figure 6). After adding these ingredients into our simulation programs, we observed three possible types of outcomes: either drift has only a limited effect, andUstays close to its deterministic equilibrium (at which indirect selection gener-ated by deleterious alleles exactly balances the cost of repli-cation fidelity), orU stabilizes around a higher value that depends on Ne;or a runaway process occurs, under which drift causes the evolution of higher U, in turn reducing Ne through background selection effects, causing further in-crease inU(which should eventually lead to population ex-tinction through mutational meltdown).
Given that per-nucleotide mutation rates are very low in most species, the hypothesis of a mutational bias toward higher mutation rates seems reasonable. Very little is known on the distribution of the effects of mutations affectingU, however, or on how this distribution may change asUevolves. Interactions between mutations affecting DNA repair pathways have been demonstrated in bacteria and yeast. In some cases, positive epistasis (on the mutation rate) has been shown between mu-tations in genes with partially redundant effects, such asMutM andMutYinEscherichia coli(Michaelset al.1992; Fowleret al. 2003), or MSH3 and MSH6 in Saccharomyces cerevisiae (Marsischky et al. 1996). These examples provide possible scenarios under which the effect of a modifier allele would increase with the baseline mutation rate. However, examples of negative epistasis also exist, for example when a repair pathway involves the combined activity of two proteins (such asMSH2andMSH6in yeast, Marsischkyet al.1996). Overall, we still lack a clear picture of how the average effect of muta-tor/antimutator alleles should change with the baseline mu-tation rate. Furthermore, these studies generally focus on mutators with large effects, which may not be representative of the majority of mutations affectingU. Obtaining more de-tailed information on the genetic architecture of mutation rate variation within natural populations would represent an im-portant progress, but remains a formidable task.
While our results show that the effects of partial selfing and partial clonality are very similar in regimes where drift has
only a limited effect, differences appear when drift is stronger and may lead to mutation accumulation. Muller’s ratchet occurred in some of our simulations with partial or complete selfing: fors¼0:01 anda¼1 in Figure 2, and in different cases with N¼1000 in Figure 5 (for a¼1 in Figure 5A,
a¼0:98 and 1 in Figure 5B,a¼0:2;0.3 and 0:93#a#1 in Figure 5E). It also occurred forN¼1000;2000, 3000, and higha($0:9) in Figure 6. Because our simulation program removesfixed mutations, it could still continue to run and U generally stabilized, except for a¼0:2; 0.3, and 0:93#a#0:99 in Figure 5E, whereUincreased to very high values and the program had to be stopped when U.30: However, in all these cases, any real population would even-tually reach extinction due to mutation accumulation. By contrast, at high clonality rates mutations tend to accumulate in the heterozygous state (even when g,1), an effect al-ready observed in previous studies by Charlesworth et al. (1993a,b) and Roze and Michod (2010). Because these mu-tations could in principle still be removed from the popula-tion by rare segregapopula-tion events, the simulapopula-tion program does not eliminate them and becomes increasingly slow. This oc-curred in nearly all cases withg¼1 in Figure 2 and Figure 3, although the mutation rate reached an equilibrium before the program had to be stopped. It also occurred for values ofg
higher than the right-most points in Figure 5 and Figure 6 (at a faster rate asgincreased), in which case the program had to be stopped before Uhad reached equilibrium. Again, in all these situations, the population would eventually go extinct by mutational meltdown. These results outline two impor-tant differences between partial selfing and partial clonality: (1) the mutation accumulation regime is reached sooner un-der partial clonality than unun-der partial selfing as the rate of uniparental reproduction increases (due to the absence of segregation), and (2) a runaway process leading to very high mutation rates may occur at moderate selfing rates (a¼0:2; 0.3 in Figure 5E, see also Figure S2 and Figure S3 inFile S1), while it does not occur at higher selfing rates. This last effect is not observed under partial clonality, and could possibly be due to identity disequilibria between selected loci reducing the efficiency of selection (e.g., Roze 2015).
Provided that mutation rate polymorphism exists within populations, the evolution of U could in principle interact
Figure 6 Equilibrium mutation rate as a function of the selfing rate (A) and the clonality rate (B). Colored dots and lines: results from the second simulation program, in which U is coded by 1000 biallelic loci (evenly spaced along the chromosome) whose effects are sampled from an exponential distribution with parameterl¼500: Pop-ulation size:N¼1000;2000, 3000, 5000, 104and 105
from top to bottom. Other parameters:s¼0:05;h¼0:3;
R¼20; c¼0:001 (fc¼e2c=U). Black curves: analytical
predictions under free recombination (Equations 26 and 27); dotted lines:Udrift2:In (B) for clonality rates higher
with the evolution of different aspects of reproductive sys-tems, such as reproductive modes or mating systems. In re-gimes where the effect of drift on the evolution ofU stays negligible, this should favor the evolution of uniparental re-production, as it should be associated with lower mutation rates (Sloan and Panjeti 2010). However, the evolution ofU may have opposite effects in regimes where it is more strongly affected by drift, and where high rates of uniparen-tal reproduction may trigger the evolution of higher muta-tion rates, through stronger background selecmuta-tion effects. Whether the evolution of the mutation rate would occur on a sufficiently fast timescale to significantly affect the evolu-tion of reproductive systems should in principle depend on the genetic architecture ofUand of the reproductive system; however, this should be explored more rigorously using the-oretical approaches. Even if mutation rate evolution is not fast enough to have a significant impact on evolutionary tran-sitions between mating systems,Umay change in response to a switch in reproductive system. This may affect the species-level selection component acting on the evolution of repro-ductive systems, for example, by accelerating the extinction of selfing or asexual lineages by mutational meltdown if U reaches higher levels due to stronger drift. More generally, it may affect the long-term evolutionary potential of selfing or asexual species, or the relation between the selfing rate and level of inbreeding depression across species. It would thus be of particular interest to obtain mutation rate estimates from different pairs of closely related species with contrasted reproductive systems, in order to see if a general pattern emerges.
Finally, our model makes a number of assumptions on selection against deleterious alleles: in particular, all delete-rious alleles have the same selection and dominance coeffi-cient, while drift has no significant effect on their equilibrium frequency. Given the concave shape of the relation between the selection coefficient of deleterious alleles s and the strength of indirect selection acting on the mutation rate, introducing variability in s across loci (while keeping the average constant) should in principle reduce the overall strength of selection for lower mutation rates. However, our deterministic model cannot be used to predict the effect of deleterious alleles for whichNes1 (whose frequency is significantly affected by drift), while our infinite sites simu-lation program cannot deal with very lowsvalues as individ-uals then carry very large numbers of mutations, causing the program to become extremely slow. Given that an important proportion of mutations may possibly fall in theNes1 pa-rameter region (e.g., Eyre-Walker and Keightley 2007), it would be important to explore the effect of such weakly se-lected deleterious alleles on the evolution of mutation rate modifiers. This may introduce new effects of reproductive systems on mutation rate evolution, as the reproductive sys-tem may affect the proportion of mutations on which natural selection is effective (by affecting Ne). Our model also as-sumes that all mutations affecting fitness are deleterious: while previous theoretical work has shown that beneficial
mutations should only have a minor role on the evolution of mutation rates in sexual, outcrossing, populations (Leigh 1970; Johnson 1999b), their effect should become more im-portant in populations undergoing high rates of selfing or clonality (since mutator alleles can stay associated with the beneficial alleles they produced), and may increase the equi-librium mutation rate in such populations. Last, as in most theoretical studies of mutation rate evolution, we have neglected epistatic interactions between selected mutations: in particular, our model does not take into account possible compensatory effects between deleterious alleles (e.g., recip-rocal sign epistasis). Allowing the sign of thefitness effect of mutations to depend on the genetic background (which typ-ically occurs in models of directional selection acting on quantitative traits) may affect the selective forces acting on mutation modifier loci. Exploring the evolution of the muta-tion rate under more realistic assumpmuta-tions on the genetic architecture offitness will be the subject of future work.
Acknowledgments
We thank Jean-Nicolas Jasmin and two anonymous re-viewers for helpful discussions and comments, and the bioinformatics and computing service of Roscoff’s Biological Station (Abims platform) for computing time. This work was supported by the French Agence Nationale de la Recherche (project TRANS, ANR-11-BSV7-013 and project Clonix, ANR-11-BSV7-007), and by a post-doctoral fellowship from the Conseil Général du Finistère to C.G.
Literature Cited
Agrawal, A. F., and M. Hartfield, 2016 Coalescence with back-ground and balancing selection in systems with bi- and unipa-rental reproduction: contrasting partial asexuality and selfing. Genetics 202: 313–326.
André, J.-B., and B. Godelle, 2006 The evolution of mutation rate infinite asexual populations. Genetics 172: 611–626.
Baer, C. F., M. M. Miyamoto, and D. R. Denver, 2007 Mutation rate variation in multicellular eukaryotes: causes and conse-quences. Nat. Rev. Genet. 8: 619–631.
Barton, N. H., and M. Turelli, 1991 Natural and sexual selection on many loci. Genetics 127: 229–255.
Charlesworth, B., 2013 Stabilizing selection, purifying selection, and mutational bias infinite populations. Genetics 194: 955–971. Charlesworth, D., M. T. Morgan, and B. Charlesworth, 1993a Mutation accumulation infinite outbreeding and inbreeding populations. Genet. Res. 61: 39–56.
Charlesworth, D., M. T. Morgan, and B. Charlesworth, 1993b Mutation accumulation infinite populations. J. Hered. 84: 321–325.
Dawson, K. J., 1998 Evolutionarily stable mutation rates. J. Theor. Biol. 194: 143–157.
Dawson, K. J., 1999 The dynamics of infinitesimally rare alleles, applied to the evolution of mutation rates and the expression of deleterious mutations. Theor. Popul. Biol. 55: 1–22.
Demerec, M., 1937 Frequency of spontaneous mutations in cer-tain stocks of Drosophila melanogaster. Genetics 22: 469–478. Drake, J. W., B. Charlesworth, D. Charlesworth, and J. F. Crow,
1998 Rates of spontaneous mutation. Genetics 148: 1667–
Eshel, I., 1973 Clone selection and optimal rates of mutation. J. Appl. Probab. 10: 728–738.
Eyre-Walker, A., and P. D. Keightley, 2007 The distribution of
fitness effects of new mutations. Nat. Rev. Genet. 8: 610–618. Fowler, R. G., S. J. White, C. Koyama, S. C. Moore, R. L. Dunnet al.,
2003 Interactions among the Escherichia coli mutT, mutM, and
mutYdamage prevention pathways. DNA Repair (Amst.) 2: 159–173. Glémin, S., and J. Ronfort, 2013 Adaptation and maladaptation in selfing in outcrossing species: new mutationsvs.standing vari-ation. Evolution 67: 225–240.
Haag-Liautard, C., M. Dorris, X. Maside, S. Macaskill, D. L. Halligan
et al., 2007 Direct estimation of per nucleotide and genomic deleterious mutation rates inDrosophila. Nature 445: 82–85. Hartfield, M., and S. Glémin, 2016 Limits to adaptation in
par-tially selfing species. Genetics 203: 959–974.
Johnson, T., 1999a The approach to mutation-selection balance in an infinite asexual population, and the evolution of mutation rates. Proc. Biol. Sci. 266: 2389–2397.
Johnson, T., 1999b Beneficial mutations, hitchhiking and the evo-lution of mutation rates in sexual populations. Genetics 151: 1621–1631.
Karlin, S., and J. McGregor, 1974 Towards a theory of the evolu-tion of modifier genes. Theor. Popul. Biol. 5: 59–103.
Kimura, M., 1967 On the evolutionary adjustment of spontaneous mutation rates. Genet. Res. 9: 23–34.
Kirkpatrick, M., T. Johnson, and N. H. Barton, 2002 General mod-els of multilocus evolution. Genetics 161: 1727–1750. Kondrashov, A. S., 1995 Modifiers of mutation-selection balance:
general approach and the evolution of mutation rates. Genet. Res. 66: 53–69.
Leigh, E. G., 1970 Natural selection and mutability. Am. Nat. 104: 301–305.
Lynch, M., 2008 The cellular, developmental and
population-genetic determinants of mutation-rate evolution. Genetics 180: 933–943.
Lynch, M., 2010 Evolution of the mutation rate. Trends Genet. 26: 345–352.
Lynch, M., 2011 The lower bound to the evolution of mutation rates. Genome Biol. Evol. 3: 1107–1118.
Lynch, M., M. S. Ackerman, J.-F. Gout, H. Long, W. Sunget al., 2016 Genetic drift, selection and the evolution of the mutation rate. Nat. Rev. Genet. 17: 704–714.
Marsischky, G. T., N. Filosi, M. F. Kane, and R. Kolodner, 1996 Redundancy ofSaccharomyces cerevisiae MSH3andMSH6
inMSH2-dependent mismatch repair. Genes Dev. 10: 407–420. Michaels, M. L., C. Cruz, A. P. Grollman, and J. H. Miller,
1992 Evidence that MutY and MutM combine to prevent
mu-tations by an oxidatively damaged form of guanine in DNA. Natl. Acad. Sci. U. S. A. 89: 7022–7025.
Miller, J. H., 1996 Spontaneous mutators in bacteria: insights into pathways of mutagenesis and repair. Annu. Rev. Microbiol. 50: 625–643.
Ness, R. W., A. D. Morgan, R. B. Vasanthakrishnan, N. Colegrave, and P. D. Keightley, 2015 Extensive de novo mutation rate variation between individuals and across the genome of Chla-mydomonas reinhardtii. Genome Res. 25: 1739–1749.
Nordborg, M., 1997 Structured coalescent processes on different time scales. Genetics 146: 1501–1514.
Nöthel, H., 1987 Adaptation ofDrosophila melanogaster popula-tions to high mutation pressure: evolutionary adjustment of mutation rates. Proc. Natl. Acad. Sci. USA 84: 1045–1049. Roze, D., 2015 Effects of interference between selected loci on the
mutation load, inbreeding depression and heterosis. Genetics 201: 745–757.
Roze, D., 2016 Background selection in partially selfing popula-tions. Genetics 203: 937–957.
Roze, D., and R. E. Michod, 2010 Deleterious mutations and se-lection for sex in finite, diploid populations. Genetics 184: 1095–1112.
Sloan, D. B., and V. G. Panjeti, 2010 Evolutionary feedbacks be-tween reproductive mode and mutation rate exacerbate the paradox of sex. Evolution 64: 1129–1135.
Sniegowski, P. D., P. J. Gerrish, and R. E. Lenski, 1997 Evolution of high mutation rates in experimental populations of E. coli. Nature 387: 703–705.
Sniegowski, P. D., P. J. Gerrish, T. Johnson, and A. Shaver, 2000 The evolution of mutation rates: separating causes from consequences. BioEssays 22: 1057–1066.
Sturtevant, A. H., 1937 Essays on evolution. I. On the effects of selection on the mutation rate. Q. Rev. Biol. 12: 464–476. Sung, W., M. S. Ackerman, S. F. Miller, T. G. Doak, and M. Lynch,
2012 Drift-barrier hypothesis and mutation-rate evolution. Proc. Natl. Acad. Sci. USA 109: 18488–18492.
Taddei, F., M. Radman, J. Maynard Smith, B. Toupance, P.-H. Gouyonet al., 1997 Role of mutator alleles in adaptive evolu-tion. Nature 387: 700–703.
Tenaillon, O., B. Toupance, H. Le Nagard, F. Taddei, and B. Godelle, 1999 Mutators, population size, adaptive landscape and the adaptation of asexual populations. Genetics 152: 485–493. Woodruff, R. C., J. N. Thompson, M. A. Seeger, and W. E. Spivey,
1984 Variation in spontaneous mutation rates in natural pop-ulation lines ofDrosophila melanogaster. Heredity 53: 223–234. Zhang, X.-S., and W. G. Hill, 2008 The anomalous effects of bi-ased mutation revisited: mean-optimum deviation and apparent directional selection under stabilizing selection. Genetics 179: 1135–1141.
Appendix
Change in Frequency at the Modifier Locus
Using the definitions given in the main text, thefitness of an individual can be written as: W¼fcðuÞ
12shXA;1þXA;2
2sð122hÞXA;1XA;2
(A1)
wherefcrepresents the cost of replicationfidelity anduis the mutation rate of the individual, given by: u¼u0þdu
XM;1þXM;2
: (A2)
Replacing XM;j by zM;jþpM and noting that u¼u0þ2du pM is the average mutation rate at locus A, we have
u¼uþduðzM;1þzM;2Þ;and a Taylor series offcðuÞto thefirst order induyields:
fcðuÞ ¼fcðuÞ
1þdu 1 fcðuÞ
dfc du
zM;1þzM;2
þoðduÞ: (A3)
SincefcðuÞ ¼fcðuÞwhendu¼0;Equation A4 may also be written as:
fcðuÞ ¼fcðuÞ
1þdu dlnfc du
zM;1þzM;2
þoðduÞ: (A4)
ReplacingXA;jbyzA;jþpAin Equation A1, one then obtains (to thefirst order indu):
WfcðuÞð12TAÞ
1þdu dlnfc du
zM;1þzM;2
3
12 sh 12TA
zA;1þzA;2
2sð122hÞ 12TA
zA;A2DA;A
(A5)
withTA¼2sh pAþsð122hÞðp2AþDA;AÞ:DenotingW the averagefitness in the population, this yields (to thefirst order indu
ands):
W
W 1þdu dlnfc
du
zM;1þzM;2
2shzA;1þzA;2
2sð122hÞzA;A2DA;A
2dudlnfc du sh
zMA;∅þz∅;MAþzM;AþzA;M22DMA22DM;A
2dudlnfc
du sð122hÞ
zMA;AþzA;MA2
zM;1þzM;2
DA;A22DMA;A
:
(A6)
The change in frequency of allele 1 at locusM(over one generation) is given by:
DpM¼E
W
W
XM;1þXM;2 2
2pM
¼E
W W
zM;1þzM;2 2
(A7)
where E is the average over all individuals just before selection. From Equations 2 and A6, and using the fact that repeated indices appearing in genetic associations can be eliminated using the relation DSii;T¼piqiDS;Tþ ð122piÞDSi;T [with
DpM dudlnfc
du
pMqMþDM;M
2 shDMAþDM;A
2sð122hÞDMA;A
2 dudlnfc du sh
ð122pMÞ
DMAþDM;A
þ2DMA;M
2 dudlnfc
du sð122hÞ
DMA;MA2DM;MDA;A
:
(A8)
Thefirst term of Equation A8 represents the effect of direct selection acting at locusM(due to the cost of replicationfidelity), while the other terms (involving genetic associations) correspond to indirect selection. AssociationsDMA;DM;A;andDMA;Aare
of orderdu; and the term on the second line of Equation A8 is thus of orderd us: Furthermore, one can show that the associationDMA;M is of order s(e.g., Roze 2015), and the third line of Equation A8 can thus be neglected [terms of order
ðduÞ2sand d us2]. Finally, the termD
MA;MA2DM;MDA;A that appears on the last line of Equation A8 can also be written
GMA pMqMpAqA;whereGMAis the identity disequilibrium between loci MandA, generated by partial selfing (Roze 2015).
Similarly, one can show that the associationDM;M(measuring the excess homozygosity at locusM) that appears on thefirst line
of Equation A8 is affected by the identity disequilibrium through a term proportional tosð122hÞðDMA;MA2DM;MDA;AÞ—see
Equation 5 in Roze (2015). However, we show in the main text that contrarily toDMA;MA2DM;MDA;A;the expressions forDMA;
DM;AandDMA;Aat QLE do not tend to zero when the frequency of the deleterious allelepAtends to zero. Therefore, assuming
that the deleterious allele stays at low frequency (pAsmall), we may neglect terms proportional topA;and thus neglect terms
involving the identity disequilibrium. In this case,DM;M can be written asF pMqM;whereFis the inbreeding coefficient (e.g.,
Roze 2015), and Equation A8 simplifies to:
DpMdudlnfc
du ð1þFÞpMqM2 sh
DMAþDM;A