18th International Conference on Structural Mechanics in Reactor technology (SMiRT 18) Beijing, China, August 7-12, 2005 SMiRT18-D07-3
HAVE ANY MATERIAL TESTS BEEN FORGOTTEN?
Josef Jansky
BTB-Jansky GmbH, Gerlinger Strasse 151, 71229 Leonberg, Germany
Phone: +49(0)7152-3087-14, Fax +49(0)7152-3087-22,
E-mail: [email protected]
ABSTRACT
Basic tests on a material used in the construction of pressure vessels and pipes close to the yield point temperature, namely with
• The tensile test specimen to determine the yield point, tensile strength, necking down and elongation,
• The impact test specimen to determine the energy absorbed at defined temperatures (notched bar test),
• The CT specimen to determine KIC or JI values, and
• Other metallographic and corrosive analyses of materials
provide an overview of the behaviour of the components manufactured with the tested material under specified operating conditions. Tests on notched specimens supplementary to the above-mentioned tests deliver information about the notch sensitivity in the tested material.
In the past, long-term tests on notched material specimens under constant load at temperatures between 300 and 350 °C have always been disregarded.
The tests described here, which are conducted over a total period of up to 25,000 hours on fine-grained structural steel (WB36) using CT specimens under a constant load, confirm the occurrence of time-dependent creep at temperatures from 340 to 350°C in the vicinity of the crack tips, accompanied by crack growth. The fractographic and metallographic findings on the fracture surfaces formed under constant load are explained.
Reference is made to the potential consequences as well as to counter-measures that can be incorporated in the pressure component design in this temperature range.
Keywords: embrittlement by 340 °C, crack initiation by constant load, time dependant crack
extension
1. INTRODUCTION
The properties expected of pressure components that are or have been used in nuclear power plants are:
• A high yield point and high tensile strength over the entire operating temperature range,
• Good toughness properties over the entire temperature range of the on-site installation after shutdown and during operation,
The properties listed above are achieved by optimising the composition of materials (including low sulphur and phosphorus content), correct vacuum melting, correct workmanship during the manufacture of components and, finally, the correct welding procedure and post-processing of the joints on the individual components. By virtue of the fact that the operating conditions of light water reactors (LWR) are limited to a maximum of 345°C (at the pressuriser) in respect of the temperature range, tests applying a constant load over longer periods are omitted from the material tests in the specifications. Extended-time testing has only been undertaken with age-hardening of the materials used (not under load) at operating temperatures over several 10,000 hours, although this is/was not always routine.
The limitation of stresses in components in accordance with ASME requirements also appeared to cover the risk of stress peak relief via material discontinuities. It was assumed that the shift in the temperature from 345°C to the creep limit of approx. 420°C as a result of the size of the stress peak, calculated via the Arrhenius equation, is not possible. It was also assumed the material was tough enough to end creep in the area of the notches if no material discontinuities are present. However, evidence has accumulated over the last 25 years and also ruptures of components have occurred in conventional boiler construction which indicate that, particularly in the case of fine-grained steels alloyed with copper, creep-induced stress peak relief is not withstood without material discontinuity. As these materials are also used to manufacture the pressurisers for the pressure boundary of NPPs, I feel it is important to publish the results of my investigations.
2. THEORETICAL BASIS
The relationship between the flaw size and the toughness of the component can best be described using the Griffith equation.
a
Ø
K
IC=
⋅
σ
⋅
π
⋅
(EQ. 1)which applies in linear-elastical fracture mechanics. Here
KIC - is the critical stress intensity factor in MPa√m which results in crack initiation at a certain
temperature.
Ø - is the shape factor which depends on the flaw and the position of the flaw within the component under load (non-dimensional)
σ - is stress along the length of the flaw in N/mm² a - is the length/depth of the flaw in m
Under operating conditions where the load is constant, precipitation processes occur in 15 NiCuMoNb 5 steel, Figure1, at temperatures above 320°C, which bring about an increase in residual stresses in the micro region and thus reduce the toughness of the material. This additionally signifies that the reduced toughness according to the Griffith equation also means that the size of flaw that would result in crack initiation is correspondingly smaller. To date, this precipitation process is expected in the material creep range (above 420°C).
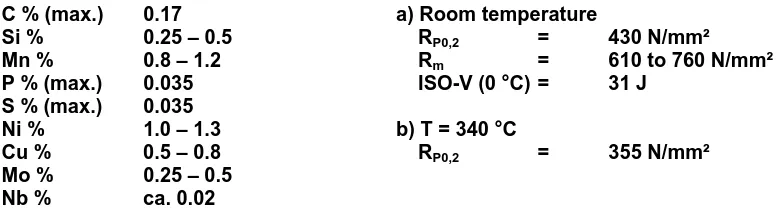
C % (max.) 0.17 Si % 0.25 – 0.5 Mn % 0.8 – 1.2 P % (max.) 0.035 S % (max.) 0.035 Ni % 1.0 – 1.3 Cu % 0.5 – 0.8 Mo % 0.25 – 0.5 Nb % ca. 0.02
a) Room temperature
RP0,2 = 430 N/mm²
Rm = 610 to 760 N/mm²
ISO-V (0 °C) = 31 J
b) T = 340 °C
RP0,2 = 355 N/mm²
If we use a simplified Arrhenius equation /1/ to consider the stress within the component, which is not evenly distributed and creates stress peaks in certain geometric and manufacturing-related discontinuities,
c
T
T
-1
=
ο
τ
τ
(EQ. 2)
• where Tc is the temperature at which the stress for overcoming obstacles disappears in the case of dislocations and
• τo is the stress required to overcome the obstacle at 0°K, then
we ascertain that, in the temperature range between 0 and TC the effect of the stress applied can
replace the effect of the temperature, Figure2.
TC
τLR (not temperature dependent) τTotal
Temperature
Stress
Fig. 2 Representation of the Arrhenius equation (EQ. 2) in a graph
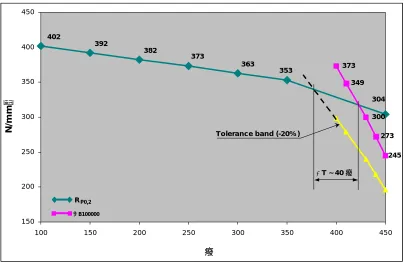
The significance of this consideration is that the cut-off point between the yield point range and the creep range of a material, Figure 3, only applies to homogeneous distribution of stress in the test specimens concerned.
373
349
300
273
245 402
392
382
373
363
353
304
150 200 250 300 350 400 450
100 150 200 250 300 350 400 450
N/
m
m
RP0,2
σB100000
∆T ~ 40
Tolerance band (-20% )
Stress peaks, resulting from the geometric local stress raisers in the stress field, start at low temperatures, in line with laws of material flow. As is always the case, the procedure is linked to the local reduction in toughness. If a crack of a certain length is present in this stress peak relief area, crack initiation may occur as a result of the time-dependent reduction in toughness, and it is possible that this may result in a catastrophic component failure. On the other hand, the crack may grow slowly over time with the length of the crack increasing steadily. Crack growth may be transgranular shortly after the start of operation but then become intergranular after operating for multiples of 10,000 hours. (Here we are looking at low-alloyed carbon steels.)
3. ANALYSES CONDUCTED
In 1991 a feed water pipe /2/ made of 15 NiCuMoNb 5 burst under operating conditions (after ~130 000 hour of operation) at the Kardia 1 power plant in Greece. CT specimens were produced from Kardia 1 pipe material with side notches and the dimensions shown in Figure 4. The specimens were taken in such a way that the notches could be arranged in the direction of the pipe circumference. It was the direction of crack extension in the feed water line at the Kardia 1 power plant. Electro-erosion was used on the notch tips and then another series of tests was carried out where fatigue loading was used.
Fig. 4 CT specimen shape used (side notches)
Table 1 shows the results of analyses conducted by Mitsui on ten CT specimens.
Table 1 Table of the loading data and test duration with CT specimens, at 340°C
Specimen Material Load
[kN]
Stress
σ ref***
[N/mm²]
Time between loading and fracture
[minutes]
KIC*
[MPa√m]
dL/dt (LLD)
[mm/sec]
da/dt
[mm/sec]
CT-1 Kardia 1 16,230 500 Immediately 59.14 CT-2 Kardia 1 14,478 450 2 53.17 CT-3 Original
23,949
350 775
∞
at once 90.41
CT-4 Kardia 1 10,288 400 < 60 47.27 CT-5 (PC 1) Kardia 1 10,031 390 < 60 45.97
CT-6 (PC 2) Kardia 1 9,713 375 < 60 44.23
CT-7 (PC 3) Kardia 1 8,880 340 ∼ 660 40.08 7.93 x 10⁻⁸ 3.96 x 10⁻⁸
CT-8 (PC 4) Kardia 1 8,236 320 325 330 ⋅ ⋅ ⋅ 388.5 **** 211,440 * 130,800 ** 126,840 ** Duration 637,920
∼ 60
37.7 37.88 ⋅ ⋅ ⋅ 45.79 CT-9 (PC 5) Kardia 1 335 2 37.3 CT-10 (PC 6) Kardia 1 330 2 36.7 * No fracture
** No fracture
*** n
2 2
n
ref wherem 2m(1-a / w)-(1-a / w) 0andB
w B m P σ + = ⋅ ⋅ =
**** Weekly load increase approx. 5 N/mm²
Specimen CT-3, which was made of the original material (original pipe from plant store), produced a KIC* value of approx. 90 MPa√m. The calculated KIC* values in respect of elasticity, which resulted in
the failure, were made using material that had already been subjected to operational loading for approx. 130,000 hours at a temperature of 340°C and, at 36 to approx. 60 MPa√m, is far below the original value (as a minimum approx. 40% of the initial value).
As can be seen here, only with specimen CT-7 has it been possible to observe a measurable crack extension of over 11 hours. The remaining specimens either failed abruptly after the load was applied or within a maximum of one hour sustained loading. The only usable results for determining da/dt came with 3.96 x 10⁻⁸ mm/sec. from specimen CT-7. In order to rule out possible influencing of the results by the electro-erosion processing of the notches (possible H2 embrittlement), the second series
of tests were carried out at MPA using CT specimens produced by cyclic loading. The results are shown in Table 2. This series of tests involved measuring and recording the notch opening on the specimens using a high-temperature clip.
Table 2 CT specimens in the series of tests conducted by MPA
Specimen Material Temperature (°C)
Load (kN)
KI*
(MPa√m)
Duration (h)
Comment
E 63.21 Kardia 1 340 10 43.2 4,708 No crack propagation
E 63.26 Kardia 1 340 11 47.6 653 No crack propagation
E 63.22 Kardia 1 340 13 56.2 5,037 Crack prop. approx. 5 µm
(Crack initiat.)
E 63.23 Kardia 1 350 13 56.2 25,023 Crack propagation 300 µm
E 63.29 Kardia 1 340 13 56.2 2 Notch eroded, no crack
As can be seen here, the cracks on specimens E 63.22 and E 63.23 were initiated at a stress intensity of 56.2 MPa√m. The result with specimen E 63.29 demonstrates that there are no differences between the two methods of processing the crack tips in respect of crack initiation (no H2 deposit by
electro-eroded notches).
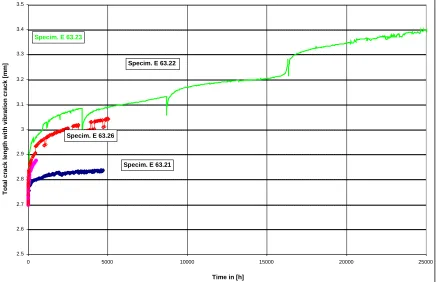
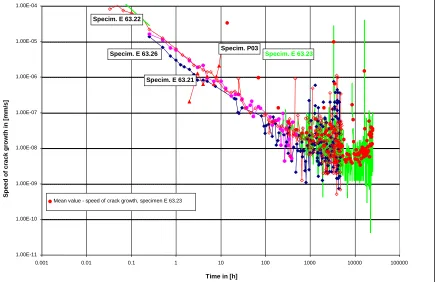
Figure 5 and Figure 6 respectively show the results of the deformation measurements over the duration of the test and the da/dt rates calculated on the basis of these. In Figure 4 one can see a typical deformation curve after loading the CT specimens. Initially, during the loading phase it can be seen that the notch opening grows quickly. It flattens out after the maximum load is applied and, after a few hours, settles at a constant rate of deformation growth over time, with the time being plotted in linear form. What is important is that the rate of increase adopted is seen to be constant for the entire duration of the test. This means that the deformation that occurs at the tip of the crack does not stop. If one calculates the openings measured in the crack extension speed (in accordance with ASTM), in the case of all specimens - as in Figure 5 - an initial steady reduction in the speed by approx. three decades can be seen when compared to the theoretical initial speed. Even the CT-7 specimen from the Mitsui series, which was the only one to deliver usable da/dt results approx. 11 hours before the specimen failed, initially exhibits a da/dt reduction in this chart. A steep da/dt increase can only be observed approx. 3 hours before failure (specimen break). At the lowest point of the speed characteristic it must be assumed that initiation took place over the entire width of the crack tip and that, as a result of the crack extension over the entire width of the specimen, an increase in the intensity of the stress then initiated an uncontrolled crack extension with the constantly applied force. The MPA specimens, which were subjected to the load for more than 5,000 hours, produced similar curves. Here, too, the rate of reduction in the da/dt values in the first 5,000 hours duration of the test could be clearly seen. The load was applied to the last specimen at MPA for approx. 25,000 hours in order to obtain crack extension that would furnish clear proof regarding the type of crack extension. The mean values calculated indicate initiation across the entire crack at approx. 10,000 hours. At the lowest point the crack extension rate was at 10-8 mm/sec. It increased relatively steeply by approx. one decade in the last 15,000 hours of the test duration.
2.5 2.6 2.7 2.8 2.9 3 3.1 3.2 3.3 3.4 3.5
0 5000 10000 15000 20000 25000
Time in [h]
Tot a l c rack l e n g th wit h v ibr ati o n cr ac k [m m ]
Specim. E 63.26
Specim. E 63.21 Specim. E 63.22 Specim. E 63.23
1.00E-11 1.00E-10 1.00E-09 1.00E-08 1.00E-07 1.00E-06 1.00E-05 1.00E-04
0.001 0.01 0.1 1 10 100 1000 10000 100000
Time in [h]
S
p
eed
of
cr
ack
gr
ow
th
i
n
[m
m
/s]
Mean value - speed of crack growth, specimen E 63.23
Specim. E 63.26 Specim. P03
Specim. E 63.21 Specim. E 63.22
Specim. E 63.23
Fig. 6 Speed of crack growth as a function of time
4. METALLOGRAPHIC AND FRACTOGRAPHIC ANALYSES OF THE SURFACE OF FRACTURE
All fracture surfaces of the specimens were subject to fractographic and, if required, metallographic assessments /3/.
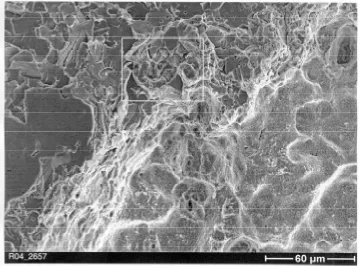
As an example, the surface of fracture of specimen CT 7 (PC-3), which has a largely transgranular characteristic, is shown in Figure 7. In individual cases, grain boundary separations can also be verified along the crack extension.
Fig. 7 Transgranular surface at the fracture of specimen PC-3
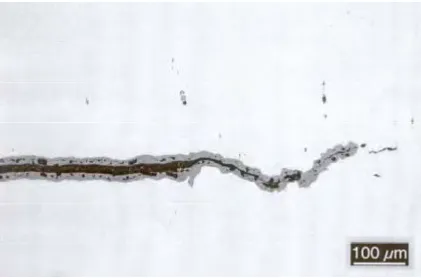
(Figure 9 and 10). The metallographic findings (Figure 11) also indicate intergranular crack propagation in the course of crack extension by 300 µm.
Fig. 8 Creep-related crack extension on specimen E 63.23
Fig. 10 Detailed record of intergranular separations from Figure 9
5. CONCLUSIONS
During the relief of high stress peaks, time-dependent crack propagation at a constant load is to be
expected at temperatures above approx. 320°C. The measured crack propagation rates of
10-8 mm/sec are obtained. Over the operating period of 100,000 hours and an extension in crack length of 3.6 mm can be expected. For 60 years of operation (510 000 h) it means theoretical crack extension about 18 mm. If such a crack runs into the material zone that has become brittle during operation /4/, it may trigger an initiation process that can bring about sudden component failure. For this reason, the requirements for basic safety in respect of the manufacture of pressure boundaries such as smooth transitions between geometries must be observed very carefully. As a redundant measure, the areas of the component where the stress concentrations are present are to be regularly inspected using non-destructive examinations (NDE).
It is advisable to check the materials used beforehand to ascertain how sensitive they are to notches when exposed to a constant load at operating temperatures above 320 °C. The inspection intervals for such examinations are to be up to 50,000 hours in order to rule out possible damage during operation at a later date. The lower the load, the longer the period of time that is required for initiation. Only when a material lies below the stress intensity threshold, which still has to be examined for each material at the respective temperatures, can it be expected that this process does not occur or the speed of crack extension da/dt is so small that it would not be noticeable over a period of operation of 60 years (service life time extension). If we take the results presented here into account, the answer to the question that forms the title of this contribution must be "yes".
REFERENCES
(Ex. 1)
Ralf J. Hellmig: Festigkeit und Plastizität – WS 2004/05, Institute for Materials Science and Materials Technology, University of Clausthal
(Ex. 2)
J. Jansky, T. Andrä and K. Albrecht: Feedwater piping guillotine breaks at 340°C operation temperature (Kardia – feed piping explosion) SMIRT 12, 1993
(Ex. 3)
BTB Jansky GmbH, Reports on the Kardia failure (Ex. 4)
Altpeter et al: Copper precipitates in 15 NiCuMoNb 5 (WB36) steel: material properties and