Measured Crop Performance
SMALL GRAIN
1969
JOHN C. RICE, Professor
A. R. ADAMS, Research Assistant
E.L.JONES, Agricultural Research Supervisor
G. C. OLIVER, Agricultural Research Assistant
Department of Crop Science NORTH CAROLINA STATE UNIVERSITY
TABLE OF CONTENTS
INTRODUCTION •••••.•.•••••••••••••••••.••••••••••••••••
EXPERIMENTAL PROCEDURE ••••••••••••••••••••••••••••••••
Agencies Sponsoring Entries ••••••••••••••••••••••
Test Locations •••••••••••••.•••••••••••••••••••••
Cultural Practices •••••••••.•••••••••••••••••••••
Seasonal Conditions ••••••••••••••••••••••••••••••
RESULTS AND DISCUSSION ••••••••••••••••••••••••••••••••
Barley •••••••••••••••••••••••••••••••••••••••••••
Oats •••••••••••••••••••••••••••••••••••••••••••••
Wlleat ••••••••••••••••••••~•••••••••••••••••••••••
Lodging
Milling Tests
TABLE AND FIGURES
Cultural practices
Characteristics of 'varieties •••••••••••••••••••••
Barley performance in the Piedmont •••••••••••••••
Barley performance in the Coastal Plain ••••••••••
Oat performance in the Piedmont ••••••••••••••••••
Oat performance in the Coastal Plain •••••••••••••
Wheat performance in the Piedmont ••••••••••.•••••
Wheat performance in the Coastal Plain •••••••••••
Lodging Data
Milling Data
3
5
5
6
7
8
10
10
11
12
12
13
14
15
17
18
19
20
21
22
23
PERFORMANCE OF SMALL GRAIN VARIETIES IN NORTH CAROLINA
John C. Rice, E. L. Jones, G. C. Oliver, Ray Adamsl /
INTRODUCTION
In the major small grain producing areas of the state, tests are
conducted annually on varieties and breeding lines of oats, wheat and
barley. These Official Variety Tests are conducted to determine the
value and suitability of conunercially available and prospective
varie-ties of small grain for planting in North Carolina. The results of
these tests are intended to aid the growers and agricultural workers
throughout the Southeast in the selection of a variety best suited for
their particular area of the state or region.
In North Carolina the wheat production for the 1968-69 season is
expected to be 9,090,000 bushels. This production will be harvested
from 202,000 acres estimated to be ten percent below the previous
season's acreage. In spite of lower number of acres, the North Carolina
production for the current season is expected to be four percent above
the 1967-68 production. For 1969, the state average yield for wheat
is estimated to be 45 bushels per acre--six bushels above the record
set in 1968.
For the harvest year of 1968, the average state oat yield
surpassed the previous high by two bushels at 50 bushels per acre and
the new barley record of 49 bushels per acre broke the old state record
by three bushels.
Information on varietal performance is presented from six test
locations in the state, three in the Piedmont and three in the Coastal
Plain Area. In comparing the performance of varieties, data from the
area which most nearly represents the growers'conditions should be used.
Seasonal conditions differ from year to year; therefore a variety which
looks superior for one year may not be consistently good, hence,
varie-ties should be evaluated on the basis of performance over several years.
Depending upon the release date of the entry, data is presented for
performance from one to five years. All available
dat~1
were used indetermining the pathologic and agronomic characteristics of the varieties.
EXPERIMENTAL PROCEDURE
Commercial varieties and experimental lines de'veloped by public
and pri'vate agencies are included in these tests. Any individual or
firm may make application for having entries included by writing the
Department of Crop Science, North Carolina State University at Raleigh.
A fee is charged on an entry basis for all private entries. Personnel
of the testing program may include entries about which further
infor-mation is desired.
Agencies Sponsoring Entries
Arkansas Agricultural Experiment Sta. Coker's Pedigreed Seed Company McNair Seed Company, Inc.
North Carolina Agricultural Experiment Sta. South Carolina Agricultural Experiment Sta. Virginia Agricultural Experiment Sta.
Test Locations
Fayett~ville, Ark. Hartsville, S. C. Laurinburg, N. C. Raleigh, N. C. Clemson, S. C. Blacksburg, Va.
Six locations were used in 1968-69 with three in the Piedmont and
three in the Coastal Plain as shown in Figure 1. All tests were located
on private farms.
l l
A randomized block design with four replications wasused at each location.
l l
11
Th . . . d · · . d d . d d b th- e cooperatLve sp1r1t an C1V1c-m1n e serV1ce ren ere y e farmers who pro'vided land and the necessary cultural practices for these trials and the cooperation of the county agents are gratefully acknowledged.
llStatistical analysis were made in the statistical laboratory under the supervision of Dr. J.
o.
Rawlings. This assistance1969
LOCATION OF SMALL GRAIN PERFORMANCE TRIALS
• SIGNIFIES OFFICIAL VARIETY TEST LOCATIONS
CO-OPERATORS
PIEDMONT
Alamance County: Mr. Jimmy E. Farrell, Route 1, Mebane, North Carolina
County Extension Chairman, George R. Coble
Stanly County: Mr. D. G. Harwood, Route 1, New London, North Carolina
County Extension Chairman, V. A. Huneycutt
Davie County: Mr. Kenneth Hoots, Advance, North Carolina County Extension Chairman, Leo F. Williams
COASTAL PLAIN
Edgecombe County: Mr. Jesse Summerlin, Route 1, Tarboro, North Carolina
County Extension Chairman, Charles H. Lockhart
Lenoir County: Mr. Parrott Gray, Route 1, Kinston, North Carolina
County Extension Chairman, F. J. Koonce
Cultural Practices
Cultural practices, such as seed bed preparation, date of planting,
fertilization and topdressing were in accord with good farming practices
and were uniform for all entries at a given location, Table 1. Several
months prior to planting each test location, soil samples were obtained
from the test field and fertilizer requirements made in accordance with
the soil analysis report. Lime was applied, if needed, to adjust the
pH to a desirable level.
Starting in 1966, all tests were mechanized for planting with a
tractor-mounted Planter Jr. Planter. Tests were seeded in a small
furrow with a Planter Jr. Planter mounted behind a tractor at the rate
of one gram of seed per foot of row. The rows were spaced one foot
apart. Each plot consisted of seven rows, 15 feet long with the two
outside rows used as borders. The border rows were removed prior to
harvest and only the five center rows were harvested. The date of
planting and fertilization at planting is shown in Table 1 for each
test location.
A seven foot combine was modified slightly for harvesting individual
plots. Grain from individual plots was collected as it came', from the
elevator and weighed. The combine was stopped at the end of each plot
for a short interval of time in order for the machine to clean out
between plots prior to weighing the grain from the plot. A sample of
grain was taken from each plot for the determination of test weight.
All barley samples were taken from the combine and run through a small
was used to more nearly simulate the conditions under which these varieties
would be harvested on farms and it appears to give very satisfactory
results.
Seasonal Conditions
With six locations for the 1968-69 Small Grain Official Variety
Test, the seasonal conditions were conducive for good growth and high
yields. October, normally a dry month in North Carolina, started as a
typical dry month until the passage of Hurricane Gladys through the
offshore waters on October 20. Rains associated with the storm
ranged up to eight inches and totals for the month up to eleven inches.
Over most of the state, totals were at least a little above normal.
Large temperature changes occurred twice in October. After readings
ranging up to 90 on the first few days, there was a drop to near
freezing on the morning of the 5th for some of the coldest weather on
record so early in the fall season.
Some of the earliest snow on record spread through the Piedmont
on November 11. Precipitation totals were near or a little above
normal with amounts well distributed throughout the month. December
was cold and dry with no unusual extremes.
March arrived with the traditional roar of the lion. Snow and
sleet spread over much of North Carolina as the month began and by
the end of the first day more than half of the state was covered with
one to fifteen inches. The total precipitation for March was near or
slightly above normal. Average temperatures were colder than for any
March since 1960. The entire four month period--December, 1968 through
North Carolina weather stations having records 80 years long.
The weather in April was remarkable, mainly for a temperature
pattern which failed to rise with the advancing spring season. The
first ten days averaged warmer than normal, the next ten days normal,
and the final ten days colder than normal. The most persistent
unseasonable cold came in a fi've day period ending on the 25th when
record low temperatures were recorded at a number of weather stations.
Rainfall was near normal and well distributed throughout the month.
An outstanding characteristic of May weather was the extreme
variability of the rainfall. Total amounts for the month ranged
from two to eight inches in the Coastal Plain. Temperatures were
moderate in May and averaged within a degree or two of normal in all
areas of North Carolina. Thunderstorms with locally damaging winds
were of perhaps less than average frequency and severity.
The Coastal Plain locations were planted in October at the
recommended seeding date for small grain crops. Two locations in
the Piedmont were planted in October and one in November depending
upon the soil moisture for each test. A good seed bed was present at
each location and this resulted in good stands. The specific planting
dates, fertilizer, topdressing and harvest dates are shown in Table 1.
Generally speaking, the 1968-69 growing season was satisfactory
for good grain yields for oats, wheat and barley. At some locations
wind and water damage was evident. Lodging data was obtained on all
entries in a specific location. All tests were harvested approximately
on schedule. The rainy period in early June delayed harvest for all
tests except for some of the barley which was cut prior to the wet
RESULTS AND DISCUSSION
The performance of the 1969 ~ests along with the previous four
years are presented by crop and area in a tabular form in this report.
Since the genetic expression of a variety is influenced greatly by the
environment, it is best to have several years' data from which to draw
conclusions. For example, if a variety appeared in the two-year average
but not in the three-year average, then it must be compared only within
the two years and not with the data in the three-year average since it
is possible that the third year could have been extremely good or poor
and not comparable.
The 1969 data presented in this report have been analyzed
statis-tically and the least significant difference (L.S.D.), in terms of
bushels per acre and pounds per bushel is given. Unless the difference
between two varieties is greater than the L.S.D., the varieties should
not be considered as being any different statistically.
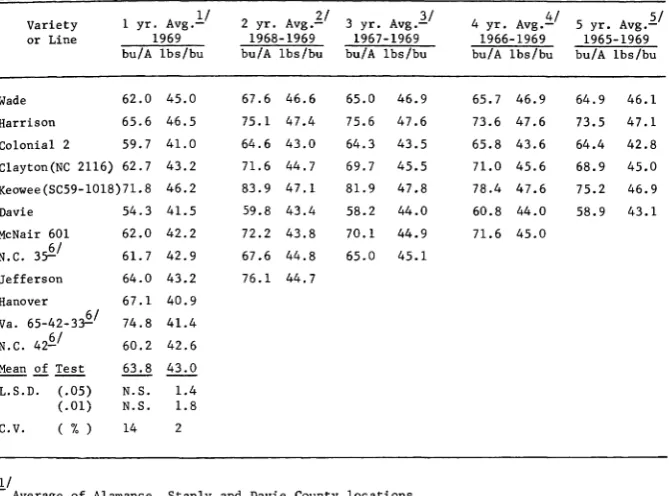
Barley
Table 5 shows the performance of barley in the Piedmont. The
yields varied from a high of 74.8 bushels per acre for the variety
Va. 65-42-33 to 54.3 bushels for the variety, Davie, for the 1969 season.
A five-year average also showed the variety Keowee to have the highest
yield at 75.2 bushels per acre.
The test weight of 46.5 and 46.2 pounds per bushel for the varieties,
Harrison and Keowee were the highest for the 1969 season. Harrison also
Keowee was very close with a 46.9 average for five years. All test
weights were low for the 1969 season due to extremely wet weather
during the harvest period.
In the Coastal Plain area, Table 6, shows the difference in yield
between varieties. The varieties, McNair 601 and Keowee, yielded higher
than other entries with an average of 65.9 and 64.6 bushels per acre,
respectively for the 1969 season. The Harrison variety had the highest
test weight with an average of 47.4 pounds per bushel. Most test weight
data was lower than for the 1968 season.
Over the five-year average, the variety Keowee had the highest
yield at 76.1 bushels per acre and the highest test weight with an
average of 46.2 pounds per bushel.
Oats
The data from the oat trials in the Piedmont are presented in
Table 7. The yields for 1968 were somewhat less with only two varieties
yielding in excess of 100 bushels per acre. The Coker lin~ 66-22 and Va. 65-32-2~were the highest yielding with an average of 100.5 and 102.4 bushels per acre, respectively. The test weights were generally
poor with the Coker lines, Coker 66-22 and Coker 68-23, having a top of
34.3 and 34.2 pounds per bushel. All test weights were somewhat less
than in 1968.
Carolee had the highest five-year yield with 101.9 bushels per
acre while Coker 242 and Roanoke had the highest test weight of 35.5
In the Coastal Plain area, Table 8, the oat yields varied from a
high of 98.2 bushels per acre for Va. 65-32-21 to 63.4 bushels for
Roanoke. There was a difference of 34.8 bushels per acre between the
high and low yielding entries. Ora and Nora had the highest test
weight of 36.8 pounds per bushel. Over a five-year average, Carolee
had the highest :yield of 97.7 and Coker 242 had the highest test
weight of 36.4.
Wheat
Table 9 shows the data on the wheat trials in the Piedmont. The
Blueboy variety had the highest yield with 63.1 bushels per acre.
Arthur, with an average of 57.9 pounds per bushel, had the highest
test weight.
Over a five-year period, Blueboy had the highest yield of 63.9 and
Knox 62 had the highest test weight of 59.7 pounds per bushel.
The Coastal Plain data are presented in Table 10. Blueboy led the
test with an average of 67.4 bushels per acre. Five entries had yields
above the mean of the test of 56.3 bushels per acre. Coker 68-19 had
the best test weight with 55.9 but all test weight data was below the
1968 season. There was a minimum of bird damage in 1969 on two locations.
Blueboy, Wakeland and Ga. 1123 were the only three varieties tested
for five years. B1ueboy had an average of 62.7 bushels per acre and
Ga. 1123 had an average test weight of 57.0 pounds per bushel.
Lodging
Lodging data age given in Table 11. A one-year, two-year, three-year
locations where lodging occurred. In 1969 a total of fi've locations
were used for lodging data. If no lodging was recorded at a specific
location, data on this location was used for the average along with
percent lodging from other locations.
Milling Tests
Grain from the wheat entries at all locations was obtained for
milling tests. In 1968 samples of seed for each entry from the fi've
Piedmont locations were composited and thoroughly mixed. Subsamples
were secured, coded and submitted to individual commercial wheat
labor-atories for analyses. The same procedure was followed for wheat entries
from the three Coastal Plain locations. Results of these milling tests
are gi'ven in Tables 12 and 13 for wheat analysis for percent protein,
test weight, percent flour yield and percent moisture. Flour analysis
data includes percent moisture, percent protein and ash for all entries.
The method used in milling the entries was the American Association
of Cereal Chemists Method 26-20; and the data was supplied by three
Area and Fertilizer Topdress
1/
Date of Date ofcooperator 1bs./..A-& G.rade 1bs./A and date planting harvesting
---Piedmont Area
Stanly Co. 500 1bs. 30 N. Oct. 11 Barley - June 12
D. G. Harwood 5-10-10 Feb. 11 Oats &Wheat - June 18
Davie Co. 1000 Ibs. 60 N. Oct. 25 Barley - June 12
Kenneth Hoots 5-10-10 Feb. 11 Oats &Wheat - June 19
Alamance Co. 500 lbs. 60 N. Nov. 1 Barley - June 18
Jinnny E. Farrell 10-10-10 Feb. 11 Oats &Wheat - June 18
Coastal Plain Area ...
.po.
Edgecombe Co. 500 1bs. 60 N. Oct. 28 Barley - June 6
Jesse Sunnneriin 5-10-10 Feb. 12 Oats &Wheat - Discarded
Lenoir Co. 600 1bs. 60 N. Oct. 28 Barley - June 6
Parrott Gray 6-6-12 Feb. 12 Oats &Wheat - June 20
Sampson Co. 500 Ibs. 60 N. Oct. 29 Barley - Discarded
Maxton Bass 5-10-10 Feb. 13 Oats &Wheat - June 23
smut Mildew rust Scald Lodging Winter Test
Variety resist- resist- resist- resist- resist- hardi- Maturity Weight
ance ance ance ance ance ness lb/bus.
McNair 601 Poor Good Fair Fair Good Good Early Low
Keowee Poor Good, Fair Fair Good Good Early High
Clayton Poor Good Excellent Fair Good Good Early Med.
Colonial 2 Poor Good Fair Poor Fair Good Early Low
Harrison Poor Good Fair Fair Excellent Excellent Early High
Wade Poor Poor Excellent Fair Good Good Early High
Davie Poor Poor Excellent Fair Good Good Early Low
Jefferson Poor Good Fair Fair Excellent Excellent Early Med.
Table 3. Characteristics of oat varieties*
t"--I
Crown 1I1
rust Smut Blight Mosaic Maturity Winter Lodging Height Test
Variety resist- resist- resist- resist- Hard- resist- of Weight
ance ance ance ance iness ance Straw lb/bu.
Ora Fair Good Good Poor Med. Good Excellent Med. High
Bruce Fair Good Good Good Med. Good Good Med. Med. High
Carolee** Fair Good Good Fair Med. Good Good Med. Med.
Yancey Fair Good Good Fair Med. Good Excellent Med. Med. High
Roanoke Fair Poor Good Good Late Good Fair Tall High
Coker 242 Good Good Good Fair Med. Fair Good Med. High
Nora Good Good Good Poor Late Excellent Excellent Med. High
Leaf Mildew Mosaic Winter Lodging Height Test Soft
Variety rust resist- resist- Maturity Hardi- resist- of Weight Wheat
resist- ance ance ness ance Straw lb/bu. Milling
ance Quality
Ga. 1123 Fair Poor 'Good Med. Fair Good Med. Med. Good
Hadden Good Good Poor Early Fair Fair Short High Fair
Wakeland Good Fair Poor Early Fair Poor Short Med. Fair
Arthur Good Good Good Med. Good Good Short High Good
Blueboy Fair Good Good Med. Good Excellent Semi-dwarf Low Good ...
(J\
Coker 65-20 Fair Good Fair Med. Fair Good Med. Med. Good
Knox 62** Good Fair Good Early Good Poor Med. High Good
Table 5. Summary of BARLEY performance trials in the PIEDMONT Variety 1 yr. Avg.1 1 2 yr. Avg.~1 3 yr. Avg.11
or Line 1969 1968-1969 1967-1969
bu/A 1bs/bu bu/A 1bs/bu bu/A 1bs/bu
4 yr. Avg.!!./ 1966-1969
bu/A 1bs/bu
5 yr. Avg.2 1 1965-1969
bu/A 1bs/bu
Wade 62.0 45.0 67.6 46.6 65.0 46.9 65.7 46.9 64.9 46.1 Harrison 65.6 46.5 75.1 47.4 75.6 47.6 73.6 47.6 73.5 47.1 Colonial 2 59.7 41.0 64.6 43.0 64.3 43.5 65.8 43.6 64.4 42.8 Clayton(NC 2116) 62.7 43.2 71. 6 44.7 69.7 45.5 71.0 45.6 68.9 45.0 Keowee(SC59-1018)71.8 46.2 83.9 47.1 81.9 47.8 78.4 47.6 75.2 46.9 Davie 54.3 41.5 59.8 43.4 58.2 44.0 60.8 44.0 58.9 43.1 McNair 601 62.0 42.2 72.2 43.8 70.1 44.9 71.6 45.0
N.C. 3:P../ 61. 7 42.9 67.6 44.8 65.0 45.1 Jefferson 64.0 43.2 76.1 44.7
Hanover 67.1 40.9 Va. 65-42-3~1 74.8 41.4 N.C. 42~.1 60.2 42.6 Mean of Test 63.8 43.0 L.S.D. (.05) N.S. 1.4 (.01) N.S. 1.8
C.V. ( % ) 14 2
II
- Average of Alamance, Stanly and Davie County locations. ~/Averageof eight locations.
llAverage of twelve locations.
~/Averageof sixteen locations.
ilAverage of twenty locations.
Table 6. Summary of BARLEY performance in the COASTAL PLAIN Variety 1 yr. Avg.!1 2 yr. AVg.l l 3 yr. Avg.11 or Line 1969 1968-1969 1967-1969
bu/A 1bs/bu bu/A 1bs/bu bu/A 1bs/bu
4 yr. Avg.!!.1 1966-1969 bu/A 1bs/bu
5 yr. Avg.2.1 1965-1969 bu/A 1bs/bu Wade 54.4 45.6 76.6 46.2 77.4 47.2 76.8 46.8 71.7 45.9 Keowee(SC59-1018)64.6 45.9 83.6 46.4 81.5 47.1 80.5 46.9 76.1 46.2 Colonial 2 58.1 42.1 74.4 42.6 73.7 43.4 72.8 43.7 69.0 43.0 C1ayton(NC 2116) 53.5 43.0 74.6 44.0 75.4 45.0 76.5 45.0 71.7 44.1 McNair 601 65.9 44.7 81.4 45.0 76.6 45.8 78.4 45.6
N.C. 3:P
J
46.4 42.7 70.8 44.2 69.5 44.9 Harrison 46.7 47.4 63.2 47.0 68.2 47.6 N.C. 422../ 54.8 43.8Va. 65-42-3~1 58.5 43.8 Hanover 58.2 43.8 Mean of Test 56.1 44.3 L.S.D. (.05) 5.8 .8 ( .01) 7.8 1.1
C.V. ( % ) 10 2
!/Average of Lenoir and Edgecombe County locations. llAverage of four locations.
4 yr. Avg.~1 5 yr. Avg.1 1 1966-1969 1965-1969
bu/A lbs/bu bu/A lbs/bu
Table 7. Summary of OAT performance trials in the PIEDMONT 1 yr. Avg)J 21 3 yr. Avg.1
.1
Variety 2 yr.
Avg.-or Line 1969 1968-1969 1967-1969
bu/A 1bs/bu bu/A 1bs/bu bu/A 1bs/bu
Caro1ee 86.5 32.9 103.4 33.4 104.7 33.4 Roanoke 70.2 33.7 84.9 34.8 90.2 35.8 Bruce 85.8 33.9 99.6 35.0 99.3 35.3 Coker 242 91.0 33.8 103.4 35.0 104.3 35.7 Yancey (NC 2534) 88.5 33.5 101.2 34.2 104.0 34.2 Ora 84.0 32.8 100.6 34.6 102.8 35.5 Nora 83.5 34.1 103.6 35.6 106.0 36.5 Coker 66-222.1 100.5 34.3 108.2 35.0 110.1 35.8 N.C. 8:).1 74.5 31.7 95.0 32.8
Va. 65-32-21~1 102.4 33.6 109.4 34.4
61
80.8 31.4 97.6 32.3 N.C.
8-SC60-C1~.1 89.2 33.0 94.2 33.4
Coker 68-2:;§..1 84.7 34.2 N.C. 2469-2&.1 83.0 31.8 Mean of ~ 86.0 33.2 L.S.D. (.05) N.S. 1.5 (.01) N.S. 2.0
c.v. ( % ) 17
l/Average of Alamance, Stanly and Davie County locations. ~/Averageof eight locations.
llAverage of eleven locations. ~/Averageof fifteen locations. 11Average of nineteen locations. §./Experimental lines.
101.6 33.3 89.1 35.6 96.0 35.1 102.7 35.6 100.9 34.2
101.9 87.9 94.2 99.2 99.9
Table 8. Summary of OAT performance trials in the COASTAL PLAIN Variety 1 yr. Avg.!1 2 yr. Avg.~1 3 yr. AVg.1 1 or Line 1969 1968-1969 1967-1969
bu/A 1bs/bu bu/A lbs/bu bu/A lbs/bu
4 yr. Avg.~1 5 yr. Avg.11 1966-1969 1965-1969
bu/A lbs/bu bu/A 1bs/bu
Caro1ee 83.1 34.1 10LO 35.2 102.0 35.0 100.3 34.4 97.7 34.1 Roanoke 63.4 34.9 76.0 36.4 76.3 36.0 75.5 35.5 73.3 35.2 Bruce 81.7 34.6 95.0 35.8 94.4 35.7 90.4 34.9 87.3 34.9 Coker 242 81.3 35.2 96.4 36.6 97.7 36.6 99.0 36.5 96.1 36.4 Yancey (NC 2534) 86.2 34.7 101.2 35.9 102.2 35.6 96.8 35.2 94.5 35.1 Ora 89.8 36.8 107.8 37.6 109.0 37.6
Nora 82.6 36.8 104.6 37.8 105.8 37.7 N.C. 8rj./ 81.2 33.6 97.8 34.6
Va. 65-32-21~1 98.2 34.8 112.6 35.8 N.C. 8&.1 74.1 32.5 88.4 34.0 Coker 66-22~1 79.1 34.9 97.4 35.9
sc60-C1~1 68.0 34.1 80.4 35.4 Coker 68-2~1 85.6 35.7
N.C. 2469-2&.1 75.8 33.8 Mean of Test 80.7 34.7 L.S.D. (.05) N.S. 1.5 (.01) N.S. 2.0
C.V. ( % ) 14 3
l/Average of Sampson and Lenoir County locations. ~/Averageof four locations.
llAverage of six locations. ~/AVerageof nine locations. ~/Averageof twelve locations.
Table 9. Summary of WHEAT performance trials in the PIEDMONT Variety 1 yr. Avg.1 1 2 yr. Avg.~1 3 yr. Avg.11 or Line 1969 1968-1969 1967-1969
bu/A 1bs/bu bu/A 1bs/bu bu/A 1bs/bu
4 yr. Avg.!:!.1 1966-1969
bu/A 1bs/bu
5 yr. Avg.2.1 1965-1969
bu/A lbs/bu
Wakeland 53.6 56.5 56.2 58.0 52.8 58.5 Ga. 1123 52.7 55.5 57.4 57.4 53.0 58.1 Knox 62 48.1 57.6 52.2 59.2 51.2 60.0 Blueboy 63.1 55.3 69.6 56.4 66.5 57.2 Coker 65-20 60.6 56.6 64.1 58.2 61.1 58.6 Arthur 57.7 57.9 62.4 58.8
Va. 66-54-lr:P.I 62.9 52.2 N.C.
72.
1 62.3 55.0 Coker 68-82..1 58.4 56.2 Coker 68-1~1 54.7 57.4 Mean of Test ?L..!i 56.0 L.S.D. (.05) 9.4 2.3 (.01) N.S. 3.2C.V. ( % ) 8 2
l/Average of Alamance, Stanly and Davie County locations. ~/Averageof eight locations.
llAverage of twelve locations. ~/Averageof fourteen locations. 21Average of seventeen locations. ~/Experimentallines.
51.5 53.6 50.3 66.1 59.5
58.2 58.2 59.6 56.7 58.6
49.2 52.2 49.9 63.9
Table 10. Summary of WHEAT performance trials in the COASTAL PLAIN
Variety yr. AVg.l l 2 yr. Avg.~1 3 yr. Avg. 1 1 4 yr. Avg.~1 or Line 1969 1968-1969 1967-1969 1966-1969
bu/A lbs/bu bu/A lbs/bu bu/A 1bs/bu bu/A 1bs/bu
5 yr. Avg)J 1965-1969
bu/A 1bs/bu
Wakeland 51.0 53.6 56.2 55.4 50.7 56.5 47.2 56.0 47.3 56.5 Ga. 1123 58.6 54.9 61.4 56.4 52.0 57.4 50.8 56.9 49.9 57.0 Blueboy 67.4 53.8 72.4 55.0 69.1 56.2 64.8 55.6 62.7 55.7 Coker 65-20 55.0 54.5 59.3 56.2 53.2 57.1 50.8 56.5
Hadden 49.6 53.4 58.2 55.6 Va. 66-54-l5~1 48.0 53.6
N. C. 7~1 64.1 54.0
Arthur 49.4 55.3 Coker 68-8~1 56.5 54.2
61 63.5 55.9
Coker
68-19-Mean of Test 56.3 54.3 L.S.D. (.05) 5.3 1.0 (.01) 7.1 1.3
c.v. ( % ) 2
l/Average of Lenoir and Sampson County locations.
~/Averageof four locations.
llAverage of six locations.
~/Average of nine locations.
21Average of twelve locations.
Table 11. Lodging Data Variety or Line McNair 601 Clayton Colonial Harrison Wade Davie N. C. 35 Va. 65-42-33 Jefferson Keowee Hanover
N. C. 42
Bruce Caro1ee Yancey Roanoke Coker 242 Nora Coker 66-22 Ora Va. 65-32-21 N.C. 85
N. C. 8
s. C. 60-C16 Coker 68-23
N. C. 2469-2 WHEAT Ga. 1123 Wakeland B1ueboy Coker 65-20 Hadden Arthur Knox 62 Va. 66-54-15
N. C. 7
Coker 68-8 Coker 68-19
1 yr. Avg.
196~.1 34.0 41.5 45.7 15.3 39.3 39.2 34.2 26.7 8.2 33.2 33.8 34.0 19691.1 48.9 41.1 40.5 34.3 31.2 40.0 46.2 34.2 26.0 37.2 47.1 17.2 28.2 18.5 196~/ 23.5 54.5 .8 31.0 13 1 57.r-16.314 1
31.7-1.2 3.0 32.0 6.7
2 yr. Avg.
1968-196c}:.1 37.9 38.4 58.6 12.0 36.8 43.8 37.4 28.2 8.7 33.4 1968-196~.I 43.0 36.4 31.1 41.2 26.2 27.8 48.4 25.8 21.4 25.3 46.9 18.3 1968-196~1 16.5 41.9 3.9 23.2 15 1 36.~
14.816 1
29.4-3 yr. Avg. 1967-196~1 29.9 26.4 61.6 8.0 27.8 41.7 39.5 1967-196~1 50.4 36.4 25.7 47.8 26.7 23.4 52.3 24.1 1967-1969-11/ 16.0 35.9 3.0 21.8
4 yr. Avg. 1966-1969~/ 34.8 31.2 69.7 8.3 33.8 53.7 1966-1969.§.1 51.2 41.0 26.6 48.3 32.0 1966-l96~/ 15.3 41.6 2.7 18.5
l/Average of five locations. J..£"verage of five locations. J:..IAverage of eleven locations. 10/Average of twelve locations.
I~.IAverage of twelve locations. .11/Average of thirteen locations.
~/Averageof fourteen locations. 11.1Average of eighteen locations.
Table 12. Comparisons of Wheat Entries for Wheat and Flour Qualities for 1968. Average of Three Laboratories for Piedmont Entries
PIEDMONT
Wheat Ana1ys is Flour Analysis %
Variety F1our* Test % % % % Ash
or Line Yield Weight Moisture Protein Moisture Protein
N. C. 4719 66.4 57.7 12.55 11. 75 13.04 9.84 .442* B1ueboy 70.6 57.7 12.47 11.05 13.03 9.54 .434* Ga. 1123 69.6 58.9 12.34 11.75 12.93 10.33 .443* McNair 2203 67.4 58.4 12.39 11.46 12.76 9.75 .496* Andnox 67.8 60.5 12.42 12.10 12.83 10.37 .450* Wakeland 65.3 59.5 12.06 12.64 12.84 11. 39 .482* Va. 66-54-10+12+15 72.7 57.3 12.47 11.85 12.29 10.37 .445 McNair 312 69.4 58.2 12.36 12.96 12.68 11.81 .469 Coker 65-20 71. 6 59.7 12.48 11. 36 12.35 10.16 .416 Hadden 66.3 59.8 12.71 12.74 12.06 11.62 .480 Knox 62 70.0 60.7 12.57 11.62 12.11 10.47 .463 Arthur 67.4 59.9 12.45 11. 95 12.21 10.58 .426* *Average of two laboratories.
Table 13. Comparison of Wheat Entries for Wheat and Flour Qualities for 1968. Average of Two Laboratories for Coastal Plain Entries
COASTAL PLAIN
Wheat Analysis Flour Analysis %
Variety F1our* Test % % % % Ash
or Line Yield Weight Moisture Protein Moisture Protein
N. C. 4719 66.5 57.7* 13.22 11. 02 13.26 9.25 .451* B1ueboy 71. 2 56.4 13.55 9.99 13.12 9.12 .437* Ga. 1123 68.4 58.6 13.56 10.78 13.14 9.72 .408* McNair 2203 68.7 55.6 13.50 10.35 12.96 9.02 .431*
Andnox 68.1 59.1 13.46 10.94 13.47 9.26 .357