INVESTIGATION
The Effect of Genomic Inversions on Estimation
of Population Genetic Parameters from SNP Data
Nafisa-Katrin Seich al Basatena,* Clive J. Hoggart,†Lachlan J. Coin,‡and Paul F. O’Reilly§,**,1 *Department of Immunology,†Department of Pediatrics,§Department of Epidemiology and Biostatistics, and **Medical Research Council–Health Protection Agency Centre for Environment and Health, Imperial College London, London W2 1PG, United Kingdom, and‡Department of Genomics of Common Disease, Imperial College London, London W12 0NN, United Kingdom
ABSTRACT In recent years it has emerged that structural variants have a substantial impact on genomic variation. Inversion polymorphisms represent a significant class of structural variant, and despite the challenges in their detection, data on inversions in the human genome are increasing rapidly. Statistical methods for inferring parameters such as the recombination rate and the selection coefficient have generally been developed without accounting for the presence of inversions. Here we exploit new software for simulating inversions in population genetic data, invertFREGENE, to assess the potential impact of inversions on such methods. Using data simulated by invertFREGENE, as well as real data from several sources, we test whether large inversions have a disruptive effect on widely applied population genetics methods for inferring recombination rates, for detecting selection, and for controlling for population structure in genome-wide association studies (GWAS). Wefind that recombination rates estimated by LDhat are biased downward at inversion loci relative to the true contemporary recombination rates at the loci but that recombination hotspots are not falsely inferred at inversion breakpoints as may have been expected. Wefind that the integrated haplotype score (iHS) method for detecting selection appears robust to the presence of inversions. Finally, we observe a strong bias in the genome-wide results of principal components analysis (PCA), used to control for population structure in GWAS, in the presence of even a single large inversion, confirming the necessity to thin SNPs by linkage disequilibrium at large physical distances to obtain unbiased results.
I
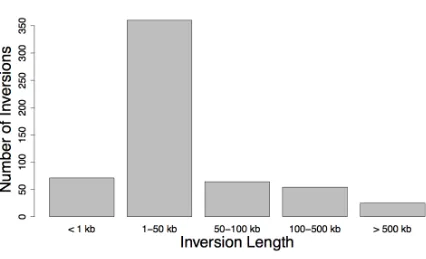
NVERSION polymorphisms are a copy-neutral form of structural variant, which although largely uncataloged in human populations, are likely a common feature in the hu-man genome (Kiddet al.2008). The study of inversions in human populations is in its infancy but early indications suggest that their influence on genetic variation (Stefansson et al.2005) and phenotypic traits (Tantisiraet al.2008) may be significant. One of thefirst large inversions (1.1 Mb) to have been discovered in the human genome is located at the MAPTlocus on chromosome 17 (Boettgeret al. 2012; Steinberget al.2012). The inverted sequence was found to be associated with elevated fertility in women and an increased recombination rate genome-wide (Stefansson et al. 2005). Another study found that three of five detected inversionswere located at sites of recurrent microdeletion associated with human disease (Kidd et al. 2008), adding to several studies linking inversions with susceptibility to disease (Lakich et al.1993; Osborneet al.2001; Koolenet al.2006; Tantisira et al.2008; Antonacciet al.2009).Supporting Information, Figure S1 shows the distribution of known human inver-sions according to the TCAG database.
To complement the investigation of the biological impact of inversions, it is important to establish their effect on methods that exploit genetic variation data to infer pop-ulation genetic parameters without accounting for the pre-sence of inversions in the genome. While there have been indications that inversions may bias statistical methods for detecting selection (Denget al. 2008; O’Reillyet al.2008), measuring population structure (Priceet al.2008), and es-timating recombination rates (Wegmannet al.2011), there has been no formal study to test this. Here we perform such a study. We simulate genome-wide SNP data with and with-out inversions using invertFREGENE (O’Reilly et al. 2010) and then, using these data, estimate the effect of inversions on leading methods for inferring recombination rates, detecting
Copyright © 2013 by the Genetics Society of America doi: 10.1534/genetics.112.145599
Manuscript received September 3, 2012; accepted for publication October 26, 2012 Supporting information is available online athttp://www.genetics.org/lookup/suppl/ doi:10.1534/genetics.112.145599/-/DC1.
1Corresponding author: Department of Epidemiology and Biostatistics, Imperial College
London, St. Mary’s Campus, London W2 1PG, United Kingdom. E-mail: paul.oreilly@ imperial.ac.uk
recent selection, and for controlling for population stratifi -cation in genome-wide association studies (GWAS). We in-vestigate whether there is support for our simulation
findings in real data, using several resources including the HapMap (Frazeret al.2007) and Wellcome Trust Case–Control Consortium (WTCCC 2007) data sets. While our focus is on humans, our results may generalize to other species to which these methods are applied and that have inversions with similar characteristics.
Materials and Methods
To test the effect of inversions on estimates of population genetics parameters we simulate genetic data with and without inversions, using invertFREGENE (O’Reilly et al. 2010). We test the effect of inversions on LDhat for estimat-ing recombination rates (McVean et al. 2004; Myerset al. 2005); on the iHS statistic for detecting selection (Voight et al.2006), which extends the extended haplotype homo-zygosity (EHH) method (Sabetiet al.2002); and on principal components analysis (PCA) for controlling for population structure in GWAS (Priceet al.2006). For each we simulate slightly different data sets. We first describe the data simu-lated to test LDhat and then detail how the data simusimu-lated for the subsequent two studies differ. We also describe the use of real data in the investigation relating to PCA, while we de-scribe the real data analyses relating to the investigations into recombination and selection in theResultssection.
To test the effect of inversions on LDhat recombination rate estimates, data are simulated by invertFREGENE ac-cording to a neutrally evolving panmictic population, under a hotspot model of recombination developed to reflect the principal features of human genome variation data (Schaffner et al.2005). The average recombination and mutation rates were set as 1.25 · 1028 and 2.5· 1028 per site, per
se-quence, per generation, respectively, reflecting human ge-nome-wide averages (Jobling 2003; Matise et al. 2007). Gene conversions are modeled with a fixed tract length of 500 bp and occur independently, across inverted and non-inverted sequence, at a constant rate of 2 ·1028per start
site, per sequence, per generation (Padhukasahasramet al. 2004). We generated one hundred 2-Mb pseudochromo-somes, sampled from a simulation with a population size of 20,000 chromosomes (N = 10,000), with an inversion simulated to span a 500-kb locus at the center of each 2-Mb region (0.75–1.25 Mb). According to the invertFRE-GENE model, recombination events are not viable within the span of an inversion for“individuals”that are heterozy-gous for inversion status (gene conversions are viable), but the recombination process continues normally directly out-side the inversion. While the suppression of recombination may in fact drop off gradually adjacent to breakpoints (Navarro et al.1997), our discrete-breakpoint assumption has no effect on the conclusions that we reach (seeDiscussion).
invertFREGENE was first run, without modeling an inversion, until an equilibrium state was reached (50,000
generations) so that the data have levels of heterozygosity and linkage disequilibrium reflecting those observed in humans (Hoggart et al. 2007), and then these data were used as input to a second invertFREGENE run that modeled inversions. An inversion mutation occurs at the specified locus in thefirst generation and segregates in the population of sequences until it either is lost or reaches the specified frequency; if the latter, then in a large population the final frequency will be very close to that specified. The age of the inversion is a function of its frequency and genetic drift, with the relationship the same as for a single variant and thus predicted by standard population genetic theory (Kimura 1985). If an inversion exceeds a frequency of 5% and is then lost in the population, the inversion simulations are started with a new seed to ensure negligible influence of historic inversions in thefinal data. Thus thefinal data reflect a locus with only a single inversion mutation in the history of the population. This simulation was repeated to produce inver-sion data with the inverted sequence at different frequen-cies, from 10 to 90% (with 10% increments). Ninety-six individuals were then sampled from the final generation be-cause the largest LDhat likelihood table available is based on 192 chromosomes. The data were then thinned from sequence-level density byfirst removing SNPs with minor allele frequency
,1%, to reflect the common SNPs targeted by genotyping arrays and large-scale genotyping projects, and then further thinned at random to produce SNP data at a density reflecting that of HapMap project (phases II and III) data (Frazer et al. 2007). We then applied LDhat to each of the simulated data sets to obtain recombination rate estimates across the loci (see File S1). We compare the performance of LDhat on the data simulated without inversions (using data outside the central 500-kb inversion locus, unaffected by the inversion according to our model) and at inversion loci at the range of inverted sequence frequencies. We also test whether false recombination hotspots are inferred at the inversion breakpoints.
To examine the distribution of the iHS statistic, de-veloped to detect loci subject to selection (Voight et al. 2006) (seeFile S2) at inversion loci, we used the simulated inversion data described above. To compare the iHS distri-bution calculated from these neutrally evolved inversion loci with that from loci subject to selection we also generated 100 sets of 1-Mb locus genotype data under different strengths of positive selection, using SelSim (Spencer and Coop 2004) (seeFile S3). We considered neutrality andfive intensities of positive selection: (i) neutral selection, (ii)s = 0.375%, (iii)s =1%, (iv)s =2%, (v)s =5%, and (vi)s = 10%, and set the frequency of the selected allele in the population to be 70%, at which the method has approxi-mately greatest power (Voight et al. 2006). We used the same recombination map in the model of both the inver-tFREGENE and SelSim simulations, and all SNP data were at HapMap (phases II and III) density. We compared the distribution of the iHS statistic at loci containing inversions to those without inversions under neutrality and subject to selection, considering inversions of length 500 kb and 4 Mb.
We performed PCA (Priceet al.2006) on both simulated and real genome-wide SNP data to estimate the effect of inversions on inferring population structure. The real data comprised 1480 population-based (control) samples from the 1958 British Birth Cohort used in the Wellcome Trust Case–Contol Consortium study (WTCCC 2007), genotyped using the 550k Affymetrix chip. While the real data contain many known inversion loci, allowing us to use these data alone to assess the impact of inversions on PCA, we also combined the data with a simulated inversion whose charac-teristics we could control. The inversion locus was simulated as described above to produce inversions of length 500 kb and 4 Mb (with a 50-kb noninverted locus flanking each end), and we sampled 1480 individuals from the simulated population to match the sample size of the WTCCC data. The data were simulated to produce replicates of an inver-sion with inverted sequence frequencies of 20%, 50%, and 80%, and the SNP data were then thinned as above but to the SNP density of the 550k Affymetrix chip. With the sim-ulated and real data matched in this way, we could then insert the simulated inversions into the real data and per-form PCA on the total data to assess the impact of the sim-ulated inversions. We also combined the simsim-ulated inversion data with simulated genome-wide noninverted and unstruc-tured data and subsequently performed PCA. We added a single inversion locus to each genome-wide simulated/real data set. The data on which we performed PCA were of four types: (i) unstructured, simulated; (ii) unstructured, simu-lated, incorporating simulated inversions of different sizes/ frequencies; (iii) real (WTCCC), structured; and (iv) real, structured, incorporating simulated inversions of different sizes/frequencies. We assessed the impact of inversions on the results by inspecting the SNP loading contributions (Jolliffe 2002) to each of thefirst six principal components.
Results
Recombination rate estimation
Patterns of linkage disequilibrium (LD) in samples of high-density SNP data can be used to infer recombination rates over the genome at afine scale (Stumpf and McVean 2003). Recombination events between two SNPs tend to reduce the association between the alleles of the SNPs and thus reduce LD. LDhat is an approximate-likelihood method that infers historical recombination according to the breakdown of LD between pairs of SNPs in a sample (McVean et al. 2004). LDhat has been applied to estimate recombination rates and detect recombination hotspots across the human genome, to contrast recombination rates between humans and chimpan-zees, while LDhat-derived recombination maps are used in most GWAS to verify the validity of association signals at loci (Myerset al.2005; Winckleret al.2005; Newton-Cheh et al.2009). Since LDhat exploits LD patterns, the presence of inversions, which have been found to be associated with strong long-range LD in humans (Deng et al. 2008; Price
et al.2008; O’Reillyet al.2010) andDrosophila(Schaeffer et al.2003; Muntéet al.2005), may affect the accuracy of estimates. We note that because inversions suppress viable recombination between diploid chromosomes at loci that have inverted and noninverted sequences, the true contem-porary recombination rate is affected by inversions, so we expect the estimates to be affected accordingly. However, the recombination rate that is estimated by LDhat exploits LD that is formed over many generations, while the suppres-sion of recombination is a function of the present inverted sequence frequency; therefore the estimated rate may not reflect the contemporary rate at inversion loci. A recent study (Wegmannet al.2011) found that many of the largest discrepancies between admixture-based and LDhat-based recombination rate estimates correspond to inversion loci, which may be explained by inaccurate LDhat estimates at inversions.
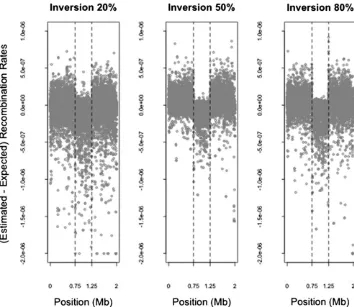
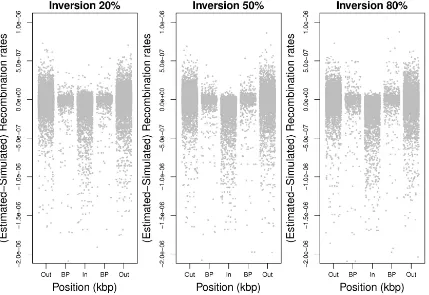
We now assess LDhat on the data simulated with an inversion, where the inverted sequence has reached a certain frequency (10–90%) in the sample. Figure 1 shows that LDhat tends to produce systematically lower recombination rate estimates at inversion loci compared to loci without inversions. Table 1 shows that there is a general trend of reducing average recombination rate estimates with increas-ing inverted sequence frequency from 10 to 80% and a slight increase in estimates at 90%. For example, the recombina-tion rate estimated by LDhat is a mean55% lower than the mean simulated rate within inversions of frequency 20%, while it is 86% lower within inversions of frequency 80%. Table S1 shows the median reductions in rate esti-mates at the inversion loci, although we focus on the mean rates because they reflect the reduction over any physical distance and because the genetic distance over a region is usually of interest when considering recombination (see Ta-ble S1 legend for more explanation). We also compare the mean LD-based estimates with those that would be expected from pedigree-based estimates, which should reflect con-temporary recombination rates (Table 1). These results in-dicate that population-based recombination rates, estimated from LD, are biased downward relative to contemporary pedigree-based estimates. See theDiscussionfor further con-sideration of these findings.
To find out whether these results are supported by real data we first recorded the locations of all autosomal in-versions $500 kb in the TCAG database (http://projects. tcag.ca/variation/), which lists all reliably discovered hu-man inversions. This provided 16 large real inversions to investigate. Next we downloaded the latest pedigree-based recombination map (Konget al.2010) and the LDhat-based recombination map from the HapMap project website (http://www.hapmap.org/) and recorded the ratio of the two rates computed over 100-kb sliding windows (10-kb increments) across the entire (autosomal) genome. To as-sess whether the ratio of the two rates was unusual at the 16 large inversions we took the maximum and minimum values of these ratios within each inversion (multiple windows
within each inversion) and compared them to an empiri-cal null distribution formed by taking the maximum and minimum values from 1000 randomly selected loci of the same length as the inversion being tested; for example, the maximum and minimum ratios within a 700-kb inver-sion are compared to those from 1000 randomly selected 700-kb regions. We find strong evidence for a downward bias in LDhat recombination rates compared to pedigree-based rates (P = 0.0005) and also some evidence (P = 0.04) for an upward bias in LDhat rates (Table 2). It appears that there may be a downward bias at some inversion loci, an upward bias at others, and possibly a bias in both direc-tions at some inversions given that both high and low values of the ratio of the rates were observed at one of the inver-sions [Table 2; chromosome (chr) 16, 21.5–22.6 Mb]. Therefore, the evidence from real data is highly supportive of our simulation-based predications that LDhat produces a downward bias in recombination rate estimates, while there is also evidence that an upward bias may exist (see Discussion).
Next we test the hypothesis that recombination hotspots are falsely inferred by LDhat at inversion breakpoints. For large inversions, where the inverted sequence is at high frequency, there will likely have been many recombination events between SNPs spanning an inversion breakpoint and physically close according to the reference map of the genome, because their true separation will be large in all inverted sequences. Therefore, LD may be low between such SNPs despite their apparent proximity, so we may expect
recombination hotspots to be inferred at inversion break-points irrespective of the true recombination intensity. We investigate this by examining the differences between simu-lated and estimated recombination rates between pairs of SNPs that span inversion breakpoints and comparing those to the differences in rates between pairs of SNPs that are Figure 1 Difference between estimated and expected recombination rates for different frequencies of inversion. The difference between the recombination rates estimated from LDhat and those expected according to the simulated rates between each pair of SNPs and the expected reduction in those rates due to the proportion of heterozygotes for inversion status (see Table 1), de-scribed in the simulation study in the text, are shown for the simulations re-lating to inversions at frequencies of 20%, 50%, and 80%. Each point shows the difference (on the y-axis) between the estimated and simulated recombina-tion rates between a pair of adjacent SNPs and (on thex-axis) the position in the 2-Mb simulated region of thefirst of the two adjacent SNPs. A small number (,15) of outliers are truncated at a dif-ference in rates of22e-6. The inverted region is located between 0.75 and 1.25 Mb (dashed vertical lines highlight inver-sion breakpoints). A downward bias in estimated, compared to expected, re-combination rates is visible within the inversion region. For mean reductions in rates see Table 1.
Table 1 Reduction in LDhat recombination rate estimates relative to the simulated rates and expected pedigree-based rates
Inversion frequency (%) Mean % reduction in LDhat recombination rates Expected % reduction in pedigree recombination rates Expected mean ped/pop ratio of recombintation rates
10 26.9 18 1.12
20 55.0 32 1.51
30 68.0 42 1.81
40 75.3 48 2.11
50 81.4 50 2.69
60 84.2 48 3.29
70 85.7 42 4.06
80 85.8 32 4.79
90 84.1 18 5.16
The mean percentage of reduction in recombination rates estimated by LDhat compared to the simulated rates between adjacent pairs of SNPs within inversion loci is shown across the range of inversion frequencies, for the simulation study described in the text and illustrated in Figure 1. The reductions in observed recom-bination rate estimates are contrasted with those that would be expected for inver-sions at these frequencies from pedigree-based recombination rate estimates, based on the expected proportion of heterozygotes for the inversion (assuming Hardy– Weinburg Equilibrium and no viable recombination events for heterozygotes for the inversion). Ped/pop, pedigree/population.
inside or outside inversion loci.Figure S2shows that LDhat does not systematically overestimate recombination rates at the inversion breakpoints in our data, and therefore, accord-ing to these simulations, there is not an enrichment of falsely inferred recombination hotspots at inversion break-points as hypothesized.
Detecting selection
Since the availability of genome-wide SNP data, numerous scans to detect loci subject to recent positive selection across the human genome have been performed, using a variety of methods (Akey 2009), in the hope of revealing mechanisms of adaptive change in human evolution and highlighting genes of medical importance. One such method is the iHS test developed by Voight et al. (2006), which extends the leading approach to detecting recent positive selection based on the EHH (Sabeti et al. 2002, 2007; Frazer et al. 2007). The assumption underlying this approach is that hap-lotypes at a locus that harbor a beneficial allele will have little breakdown given their frequency compared to the al-ternative haplotypes at the locus, due to reduced opportu-nity to undergo recombination as they are “swept”to high frequency in relatively few generations. However, there may be a similar disparity in the breakdown of haplotypes at a neu-trally evolving inversion locus as a result of the suppression of recombination between sequences in the opposite orienta-tion. Haplotypes in the inverted orientation may have been subject to distinctly fewer recombinations than noninverted haplotypes because at low frequencies the inverted sequence will generally be present in a diploid pair with a noninverted sequence, with which it cannot recombine, while most
non-inverted sequence will be in homozygous form and will thus recombine as usual. Therefore, inversion loci may represent a potential source of false-positivefindings for the EHH ap-proach to detecting selection, which we test here in the form of the iHS statistic (Voightet al.2006).
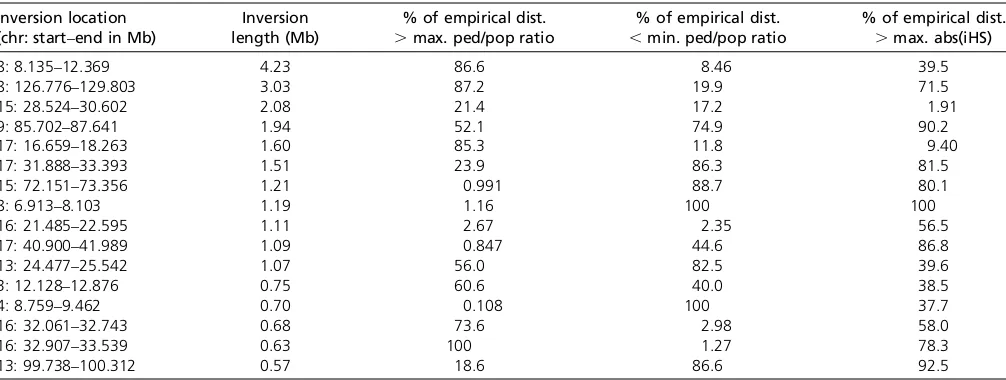
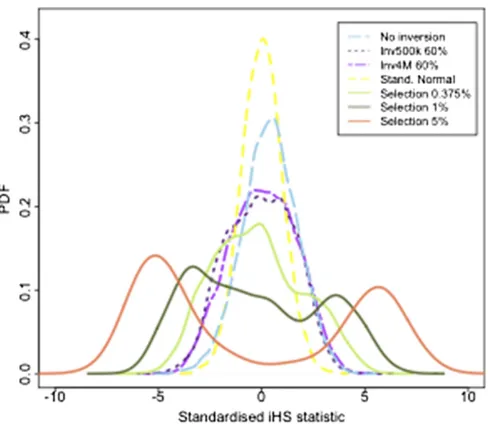
First, we ran the iHS method on the simulated neutral inversion data described inMaterials and Methods, comput-ing the standardized iHS statistic for all SNPs. We then applied the iHS to the data simulated under neutrality and five intensities of positive selection: (i) neutral selec-tion, (ii)s =0.375%, (iii)s =1%, (iv)s =2%, (v)s =5%, and (vi)s =10%, for selective sweeps where the beneficial allele has reached 70% in the population. Figure 2 displays the distributions of the iHS under neutrality and the differ-ent selection intensities and those corresponding to inver-sion loci of 500 kb and 4 Mb where the inverted sequence has reached 60%, which is the inverted frequency showing greatest deviation from the iHS null (Figure S3). These simulation results indicate that while there can be a notice-able deviation from the iHS null distribution, particularly in the lower tail, for large inversion loci, the deviation for even the smallest selection coefficient (s= 0.375%) tested here is considerably larger. Therefore, we would not expect the extreme tails of the iHS statistic computed genome-wide to be particularly enriched for inversion loci unless there were many more large inversions across the genome than beneficial alleles with selection coefficients$0.375. To investigate evidence for this in real data we compared the iHS values at the 16 large inversions ($500 kb) from the TCAG database with those from an empirical null dis-tribution of the iHS in the European HapMap population Table 2 Recombination rate estimates and the iHS statistic at the 16 largest known human inversions ($500 kb)
Inversion location
(chr: start–end in Mb)
Inversion length (Mb)
% of empirical dist.
.max. ped/pop ratio
% of empirical dist.
,min. ped/pop ratio
% of empirical dist.
.max. abs(iHS)
8: 8.135–12.369 4.23 86.6 8.46 39.5
8: 126.776–129.803 3.03 87.2 19.9 71.5
15: 28.524–30.602 2.08 21.4 17.2 1.91
9: 85.702–87.641 1.94 52.1 74.9 90.2
17: 16.659–18.263 1.60 85.3 11.8 9.40
17: 31.888–33.393 1.51 23.9 86.3 81.5
15: 72.151–73.356 1.21 0.991 88.7 80.1
8: 6.913–8.103 1.19 1.16 100 100
16: 21.485–22.595 1.11 2.67 2.35 56.5
17: 40.900–41.989 1.09 0.847 44.6 86.8
13: 24.477–25.542 1.07 56.0 82.5 39.6
3: 12.128–12.876 0.75 60.6 40.0 38.5
4: 8.759–9.462 0.70 0.108 100 37.7
16: 32.061–32.743 0.68 73.6 2.98 58.0
16: 32.907–33.539 0.63 100 1.27 78.3
13: 99.738–100.312 0.57 18.6 86.6 92.5
Pedigree-based and population-based (LDhat) recombination rate estimates from human genetic data arefirst compared by taking the ratio of the rates in 100-kb sliding windows genome-wide, as described in the text. Bias in these rates at inversion loci is investigated by computing the proportion of the empirical distribution that is greater and smaller, respectively, than the maximum and minimum“ped/pop ratios”observed within each of the 16 largest known human inversions (after omitting shorter inversions within, or overlapping, any of the 16 and any without markers between the breakpoints). The enrichment of values in the top 5% of the empirical maximum ped/ pop distribution among the inversions hasP= 0.000857 (5 of 16), and that in the top 1% hasP= 0.000508 (3 of 16), assuming a binomial distribution, while the enrichment of values in the top 5% of the empirical minimum ped/pop distribution hasP= 0.0429 (3 of 16) and there are no minimum ped/pop values in the top 1% of the empirical distribution at the inversion loci. Values of the iHS statistic were calculated genome-wide and investigated at the inversion loci similarly, with no enrichment of maximum absolute iHS values observed at the inversion loci (P= 0.560, 1 of 16 in the top 5% of the empirical distribution). dist., distribution; max., maximum; abs, absolute; ped/pop, pedigree/population.
(CEU), having retrieved genome-wide iHS values from http://haplotter.uchicago.edu/. To make this comparison we followed the same procedure as that described for re-combination rates in the previous section. Wefind no sig-nificant evidence for enrichment of extreme iHS values (P= 0.58) at the 16 inversion loci (Table 2), indicating that the iHS statistic is reasonably robust to the presence of inversion polymorphisms, as suggested by our simulation results.
Controlling for population structure
Systematic nonrandom mating in populations results in genetic stratification. A primary source of systematic mating in humans is geographic separation (Novembreet al.2008). The resulting genetic stratification can be problematic for GWAS because the phenotype under study may have envi-ronmental risk factors stratified by geography, producing the potential for false-positive associations between SNP geno-types and the phenotype because the genogeno-types may be associated with the phenotype via the risk factors. A rou-tinely used approach for controlling for such confounding is to perform PCA on the genotype data and to subsequently include the top principal components (PCs) as covariates in the GWAS analysis (Price et al. 2006). The PCs provide genome-wide summaries of the genotype data for each in-dividual and are thus reflective of the genetic similarity be-tween the individuals, which should correspond broadly to geographic separation. Each independent locus should
con-tribute equally to this estimate because each provides equal evidence in terms of relatedness. However, some loci have a large number of SNPs in high LD, which up-weight their contribution and make the PCs less reliable. Using simulated and real data, O’Reillyet al.(2010) show that inversion loci can have a particularly high proportion of SNPs either per-fectly or highly correlated with each other, and since inver-sions can be megabases in size, then they may compromise the results from PCA. While PCA is often performed on ge-nome-wide data that have been thinned to remove corre-lated SNPs, this is generally performed only locally using sliding windows of, say, 50 or 100 kb, and in some cases is not performed at all. We investigate the effect of the presence of large inversions ($500 kb) on PCA when SNP data are not thinned.
We performed PCA on both simulated and real genome-wide SNP data to estimate the effect of inversions on inferring population structure. The data on which we per-formed PCA were of four types: (i) unstructured, simulated; (ii) unstructured, simulated, incorporating simulated inver-sions of different sizes/frequencies; (iii) real (WTCCC), structured; and (iv) real, structured, incorporating simu-lated inversions of different sizes/frequencies. We assessed the impact of inversions on the results by inspecting the SNP loading contributions (Jolliffe 2002) to each of the first six principal components.
When PCA is performed on the simulated unstructured data, the SNP loadings contributing to each of the first six principal components are highly uniform across the genome. This finding suggests that the correlation between SNPs modeled in these simulations, which generates regions of high and low LD (Schaffneret al.2005), is not sufficient to compromise the PCA. Next we assess the loadings when a single simulated inversion locus is added to these data. When a 500-kb inversion is added to the data, the loadings, again, have a similar distribution across the genome. How-ever, the inclusion of a 4-Mb inversion has a substantial
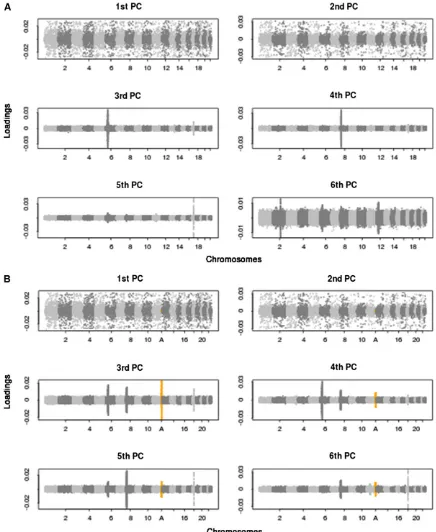
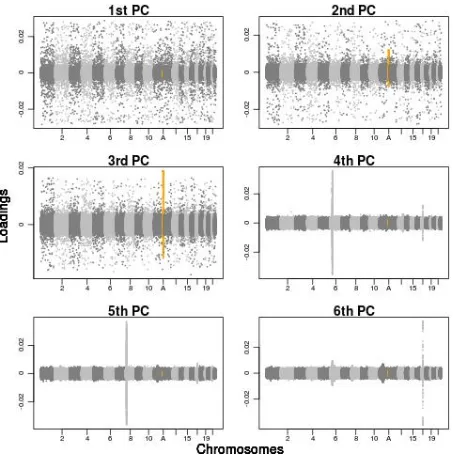
in-fluence, with thefirst PC strongly affected by the data of the inversion locus (Figure S4), while all other loci for each of thefirst six PCs display approximately the same distribution as each other, as observed when an inversion is not present. Next, we perform PCA on the WTCCC data with and without the inclusion of a simulated inversion locus. Figure 3A shows the genome-wide SNP loadings from the PCA on the data without simulated inversions and reveals that the third, fourth, andfifth PCs are strongly influenced by local-ized sources of variation. The three genomic regions that have a marked impact on PCs 3, 4, and 5 are, respectively, located at (i) the major histocompatibility complex (MHC), which is a 3.8-Mb immune-dense region found in chromo-some 6p23, exhibiting particularly strong and extended LD blocks (Yu et al. 2005; Kelley et al. 2008); (ii) a 3.8-Mb inversion polymorphism on chromosome 8p23 (Denget al. 2008); and (iii) a 1.1-Mb inversion polymorphism on chro-mosome 17q21 (Stefansson et al. 2005). Therefore, these results provide empirical evidence that inversions can disrupt Figure 2 The probability density function of the standardized iHS statistic
under different intensities of selection and at an inversion of frequency 60%. Shown are the probability density function (PDF) of the standardized iHS statistic computed from data from a 500-kb inversion with inverted frequency 60% under neutrality (dashed purple), a 4-Mb inversion with inverted frequency 60% under neutrality (dotted purple line), data simu-lated under several intensities of positive selection with no inversion pres-ent, compared to the standard normal distribution (yellow), representing theoretical data under neutrality with no inversions, and invertFREGENE simulation data under neutrality with no inversions (light blue).
PCA performed on genome-wide SNP data. When a 500-kb simulated inversion is added to the real data, there is little apparent impact on the first six PCs as assessed by SNP loadings (data not shown), while the inclusion of a 4-Mb inversion can be a distinct source of variation in the top PCs
in these data (Figure 3B andFigure S5). The frequency, as well as the size, of the inversion appears to be important, such that the higher the frequency of the inverted sequence is, the greater the tendency for the lower-order PCs to be disrupted.
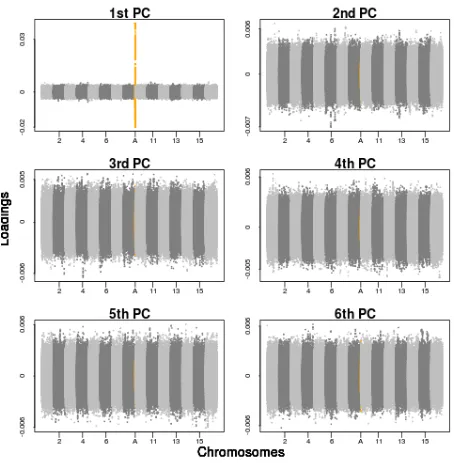
Figure 3 SNP loadings from principal components analysis corresponding to the top six PCs, on WTCCC data with and without the inclusion of a simulated inversion. The loadings of the SNPs on the top six PCs across the 22 human autosomal chromosomes of the WTCCC data are shown. (A) No simulated inversion included in the data. (B) A simulated 4-Mb inversion at frequency 50% included in the data (highlighted in orange and at position A), showing highly localized variance in SNP loadings in PCs 3–6. SeeFigure S5for more results at inversion frequencies of 20%, 50%, and 80%.
Discussion
Statistical methods that use population genetic data to infer parameters of interest, such as intensity of recent natural selection, have been developed over previous decades. Through the use of more appropriate models, such as the coalescent model (Hudson 1983), and greater knowledge of genetic variation data, such as the discovery that most re-combination in the human genome occurs in rere-combination hotspots (Jeffreys et al.2001; Myers et al.2005), methods for inferring parameters of interest have evolved to better capture the underlying data (Marchini et al. 2007; Price et al. 2009). A significant finding in recent years has been the ubiquity of structural variation in the human genome (Li et al. 2011), with copy-number variation regions spanning an estimated 12% of the human genome (Redon et al. 2006), yet most statistical genetics methods take no account of their presence. Here we tested the effect of one such type of structural variant, inversion polymorphisms, which are known to suppress recombination in individuals heterozygous for the variant (Navarroet al.2000) and thus have a substan-tial influence on local genetic variation and therefore poten-tially on methods of inference that exploit such data.
We formally investigated the impact of inversions on three widely used statistical methods that use SNP data on samples of individuals to estimate (i) recombination rates, (ii) recent selection acting at loci, and (iii) population structure. We used simulated and real data to assess the effect of inversions on the three methods. We found that inversions can lead to systematic inaccuracy in estimating recombination rates using LDhat (McVean et al.2004) and in measuring population structure using principal compo-nents analysis, while the iHS statistic for detecting selective sweeps (Voightet al.2006) appears robust to the presence of inversions.
We illustrate that within large inversions (500 kb) LDhat underestimates the recombination rate and underestimates by .80% for frequencies of the inverted sequence $50% (Table 1). We expect the estimated recombination rate to be reduced due to the actual reduction in recombination in individuals heterozygous for the variant, but the level of underestimation that we observe is greater than expected. For instance, inversions with inverted sequence frequency of 50% should reduce viable recombination by around half, yet LDhat estimates are 81.4% lower than the simulated rates for such inversions, and inversions with inverted sequence frequency of 80% reduce viable recombination by an aver-age 32%, yet LDhat estimates are an averaver-age 85.8% lower than the simulated rates. For inversions at low frequencies few individuals will have been heterozygous for the variant, with thus little overall historical suppression of recombina-tion, whereas those at high frequencies will have experienced greater suppression of recombination due to segregating for many generations with a high proportion of heterozygotes for inversion status. To check that the observed underesti-mation is not simply due to greater underestiunderesti-mation of
re-combination when the true rere-combination rate is lower than the genome-wide average, we assessed LDhat estimates at loci where the simulated rates were approximately half the genome-wide average. This should be a sufficient check because the maximum suppression of recombination at inversions is 50% (at inversion frequency of 50%). Wefind that the average recombination rate is marginally overes-timated at loci with simulated recombination rates be-tween 5.75e-9 and 6.75e-9 and that there is a tendency for LDhat to overestimate recombination rates simulated with rates lower than the mean. Therefore the downward bias in estimates that we observe at inversion loci cannot be explained by the behavior of LDhat at loci with low recombination rates, and so our findings are conservative in this way.
While our real data analysis provides strong support for a downward bias in LDhat rates at inversion loci, it also indicates that LDhat estimates may be biased upward compared to contemporary rate estimates (pedigree-based rates here) at some inversion loci. Wegmann et al.(2011) found that many of the largest discrepancies between their admixture-based recombination rate estimates and LDhat-based estimates were at the sites of inversions. The authors found that LDhat estimates could be both substantially lower and substantially higher than the admixture-based estimates, which should reflect contemporary recombination rates, at inversion loci. However, the admixture-based esti-mates are based on a hidden Markov model (HMM), which may be affected by unusual patterns of LD and assumes that all sequences are in the same orientation, and so these esti-mates may also be biased at inversion loci. Furthermore, no formal testing was performed to establish whether the dif-ferences between the estimates were statistically significant. Considering the evidence from our simulation study and from real data, we conclude that we would expect to ob-serve a downward bias in LDhat estimates at most inversion loci, but that there may be an upward bias in the estimates at some inversion loci. We consider the most likely reason for a downward bias in LDhat estimated recombination rates to be that particularly high LD is produced at inversion loci because recombination occurs only between homozygotes for inversion status (O’Reilly et al. 2010; Boettger et al. 2012), so that the high LD is due to not only the reduced recombination rate but also the stratification of recombina-tion among the sequences. Regions of high LD are inferred as having low recombination rates by LDhat. If there is in fact an upward bias in LDhat estimates relative to contem-porary recombination rates at some inversion loci, then there must be features of inversions, or of real genetic data, not fully captured by invertFREGENE as appled in our sim-ulation study. The recombination model used by invertFRE-GENE generates data that correspond well to average levels of homozygosity and LD observed in real genetic data, but, for example, may not reflect the large “recombination deserts”present in the human genome. LDhat tends to pro-duce overestimates when very low recombination rates are
simulated, so inversions in regions of particularly low re-combination may have high LDhat estimates relative to con-temporary rates. invertFREGENE assumes neutral evolution of sequences and so it may be that an upward bias in pop-ulation-based recombination rates is likely under certain scenarios of selective pressures. Furthermore, invertFREGENE assumes panmictic mating, so may produce data that do not reflect highly stratified or admixed human populations well. Additional limitations of the invertFREGENE software, which may explain differences between simulated and real data results, are discussed below.
Our results on recombination suggest the need for further development of methods such as LDhat or the reevaluation of recombination rate estimates at known inversion loci, to account for the presence of inversions in the human genome. Further investigation is also required to establish whether there is an upward bias in LDhat at some inversion loci and, if so, what the causes are, which should form an intriguing area of research as our knowledge of genetic data and real inversions increases over time.
Our finding that recombination rate estimates are not systematically higher at inversion breakpoints, and thus do not falsely infer recombination hotspots, is reassuring in terms of hotspot inference using LDhat, but highlights a potential problem with recent methods developed to infer the location of inversion polymorphisms from SNP data. An important assumption made by some methods for detecting inversions from SNP data (Bansal et al. 2007; Sindi and Raphael 2010) is that LD will be greatly reduced at inver-sion breakpoints because the separation of SNPs spanning the breakpoints can be large due to the inversion, despite being physically close according to their reference genome positions. However, inversions have been found to display strong LD between SNPs across their entire length (Deng et al. 2008; Price et al.2008; O’Reilly et al. 2010), so the reduction in LD due to distance of separation may be far lower than expected at inversion loci, as indicated by our results, owing to the particular effect that inversions have on local LD via their impact on the recombination process. However, further testing is required to establish the effect of this on specific methods for detecting inversions.
Although there has been concern that inversions may disrupt methods for detecting selection (Deng et al.2008; O’Reillyet al.2008), wefind that while the distribution of the iHS statistic for detecting selective sweeps is changed somewhat by the presence of inversions, the statistic is
suf-ficiently robust. Our real data anaylsis, in particular, sug-gests that any difference in haplotype breakdown between the inverted and the noninverted sequence caused by the suppression of recombination at inversion loci is insufficient to produce extreme values of the statistic that would be interpreted as recent positive selection.
While the disruptive effect of inversions on principal components analysis is evident from some empirical studies (Denget al.2008; Jakkulaet al.2008), the problem has not been formally investigated. By applying PCA on both real
(WTCCC 2007) and simulated genetic data, we find evi-dence that large inversion polymorphisms (.500 kb) can dominate the leading principal components, even in a struc-tured population. Our analyses of the real data showed that the data at known inversions, on chromosomes 8p23 and 17p21, bias some of the top six PCs. In an unstructured simulated population the effect of a simulated 4-Mb inver-sion is even more pronounced and affects thefirst PC, while there was no noticeable effect of a 500-kb inversion. Using PCs as covariates has become a standard strategy for con-trolling for population structure in GWAS. However, the correlation structure between SNPs across the genome is an inherent problem in using PCA to measure population structure, because each locus should contribute equally to the estimate of structure in a sample, yet loci with many SNPs in high LD will contribute more. We have found that the high LD between many SNPs at large inversions is
suf-ficient to generate pronounced bias in the low-order PCs. This suggests that it is critical to thin (or“prune”) SNP data according to LD over large physical distances prior to per-forming PCA to ensure its reliability. Such thinning should have little adverse impact on the results of PCA since 104
SNPs are generally sufficient for the PCs to capture popula-tion structure effects (Astle and Balding 2009).
The main limitation of this study is its reliance on one simulation software package, and thus specific model for inversion polymorphisms, in testing the population genetics methods on simulated data. invertFREGENE models inver-sions as having arisen from a single mutation event, after which neutral drift governs the frequency of the inverted sequence until a set frequency is reached. Real inversions may often be located at the sites of genomic instability and thus inversion loci may often be subject to several inversion, deletion, or duplication mutations. They may also frequently reside within repetitive sequence, more prone to the“errors” in recombination that can lead to inversions, where SNP coverage is typically reduced. It should also be noted that our simulated inversions are, on average, younger than real inversions of the same frequency because our simulations stop as soon as the specified frequency is reached, although we do not expect this to change our general conclusions since we explored a range of frequencies and thus ages of inversions. Our model for inversions assumes discrete break-points, in that the recombination process outside and even adjacent to the inversion is entirely unaffected by the inver-sion. However, we would expect the conclusions drawn from our main simulation results to hold if recombination were suppressed beyond the breakpoints as well; we would ex-pect the bias observed in LDhat recombination rate esti-mates to extend beyond the breakpoints, the iHS statistic to remain robust to inversions, and a slightly greater impact on PCA relative to inversions where suppression of recombi-nation is only the length of the inversion. However, modeling discrete breakpoints could have made a critical difference to the results of our investigation into the hypothesis that recom-bination hotspots are falsely inferred at inversion breakpoints;
discrete breakpoints should increase the probability of accepting this hypothesis, yet our results led to the rejection of the hypothesis and so we can conclude that “soft break-points”would only further support our conclusion.
Although invertFREGENE models gene conversion events, it does not model double-crossover events. While some evidence for a double-recombination event has recently been found within the inversion at theMAPTlocus (Steinberg et al.2012), this event was predicted to span only 30 kb of the1.1-Mb inversion, and no other evidence for a double-recombination event was found across the rest of the inver-sion after extensive investigation by two studies (Boettger et al.2012; Steinberget al.2012). To our knowledge, there is no other evidence for the occurrence of double crossovers within human inversions and thus no other information from which to model their characteristics (such as size and rate of occurrence); if they can potentially be large and occur frequently, then the resulting pattern of variation data could be very different from that considered here and so our predictions may not be accurate for such inversion loci. However, despite these reservations, there is no other soft-ware available for simulating inversions in population ge-netic data, and while the model used may not reflect the characteristics of all inversions, we believe that our results provide a good guide to the potential effects of inversions on these methods. The fact that our real data analyses were generally reflective of our simulation results in the three Results sections provides support for the reliability of the simulation model. However, further testing as more data on real inversions become available is required to assess how closely our simulation results compare to reality.
Another limitation of this study is the fact that we investigate only three population genetic methods, when there are many in use that do not account for the presence of inversions. Our findings on the effect of inversions on recombination rate estimates and principal components analysis suggest that large inversions can have a marked effect on local patterns of LD and may therefore compromise any method influenced by LD that does not account for extreme deviations in LD. Methods for detecting selection that combine evidence from test statistics calculated in-dependently at neighboring SNPs (Weir et al. 2005) and those that test“runs of homozygosity”(ROH) (Lenczet al. 2007) are examples of methods that may be biased by ge-nomic regions with unusually strong and extended LD, such as inversions. Our focus has been on methods of inference commonly applied to human genetic variation data, and invertFREGENE aims to model human population genetic data; we suggest that researchers interested in the impact of inversions on inference in other species should consider whether our conclusions are likely to generalize to their setting and, if not, to use our study as a guide to investiga-tions of their own.
Our study estimates the impact of inversion polymor-phisms on three widely applied population genetic methods of inference, covering inference of recombination rates,
selection intensity, and population structure. The results highlight the importance of accounting for large-scale sources of variation in the genome, such as inversions, in popula-tion genetic methodology development and suggest the need to reassess results from existing methods at known inversion loci.
Acknowledgments
The authors declare no conflict of interest. Funding for this work was provided by the Wellcome Trust (N.-K.S.), the European Network of Genetic and Genomic Epidemiology consortium (grant P12892_DFHM to P.F.O.), and the Na-tional Institute for Health Research Imperial College Health Care National Health System Trust Biomedical Research Centre (P.F.O.).
Literature Cited
Akey, J. M., 2009 Constructing genomic maps of positive selection in humans: Where do we go from here? Genome Res. 19: 711– 722.
Antonacci, F., J. M. Kidd, T. Marques-Bonet, M. Ventura, P. Siswara et al., 2009 Characterization of six human disease-associated inversion polymorphisms. Hum. Mol. Genet. 18: 2555–2566. Astle, W., and D. J. Balding, 2009 Population structure and
cryp-tic relatedness in genecryp-tic association studies. Stat. Sci. 24: 451– 471.
Bansal, V., A. Bashir, and V. Bafna, 2007 Evidence for large in-version polymorphisms in the human genome from HapMap data. Genome Res. 17: 219–230.
Boettger, L. M., R. E. Handsaker, M. C. Zody, and S. A. McCarroll, 2012 Structural haplotypes and recent evolution of the human 17q21.31 region. Nat. Genet. 44: 881–885.
Deng, L., Y. Zhang, J. Kang, T. Liu, H. Zhao et al., 2008 An un-usual haplotype structure on human chromosome 8p23 derived from the inversion polymorphism. Hum. Mutat. 29: 1209–1216. Frazer, K. A., D. G. Ballinger, D. R. Cox, D. A. Hinds, L. L. Stuve et al., 2007 A second generation human haplotype map of over 3.1 million SNPs. Nature 449: 851–861.
Hoggart, C. J., M. Chadeau-Hyam, T. G. Clark, R. Lampariello, J. C. Whittakeret al., 2007 Sequence-level population simulations over large genomic regions. Genetics 177: 1725–1731. Hudson, R. R., 1983 Testing the constant-rate neutral allele
model with protein sequence data. Evolution 37: 203–217. Jakkula, E., K. Rehnström, T. Varilo, O. P. H. Pietiläinen, T. Paunio
et al., 2008 The Genome-wide patterns of variation expose significant substructure in a founder population. Am. J. Hum. Genet. 83: 787–794.
Jeffreys, A. J., L. Kauppi, and R. Neumann, 2001 Intensely punc-tate meiotic recombination in the class II region of the major histocompatibility complex. Nat. Genet. 29: 217–222.
Jolliffe, I., 2002 Principal Component Analysis. Springer-Verlag, New York.
Kelley, J. M., L. B. Hughes, R. Feng, N. Liu, M. A. Padilla et al., 2008 Evaluating linkage disequilibrium and recombination pro-vides a haplotype-tagging SNP panel of the major histocompati-bility complex in African Americans. Genes Immun. 9: 271–273. Kidd, J. M., G. M. Cooper, W. F. Donahue, H. S. Hayden, N. Sampas et al., 2008 Mapping and sequencing of structural variation from eight human genomes. Nature 453: 56–64.
Kimura, M., 1985 The Neutral Theory of Molecular Evolution. Cam-bridge University Press, CamCam-bridge/London/New York. Kong, A., G. Thorleifsson, D. F. Gudbjartsson, G. Masson, A.
Sigurdssonet al., 2010 Fine-scale recombination rate differ-ences between sexes, populations and individuals. Nature 467: 1099–1103.
Koolen, D. A., L. E. L. M. Vissers, R. Pfundt, N. de Leeuw, S. J. L. Knight et al., 2006 A new chromosome 17q21.31 microdele-tion syndrome associated with a common inversion polymor-phism. Nat. Genet. 38: 999–1001.
Lakich, D., H. H. Kazazian, S. E. Antonarakis, and J. Gitschier, 1993 Inversions disrupting the factor VIII gene are a common cause of severe haemophilia A. Nat. Genet. 5: 236–241. Lencz, T., C. Lambert, P. DeRosse, K. E. Burdick, T. V. Morganet al.,
2007 Runs of homozygosity reveal highly penetrant recessive loci in schizophrenia. Proc. Natl. Acad. Sci. USA 104: 19942– 19947.
Li, Y., H. Zheng, R. Luo, H. Wu, H. Zhu et al., 2011 Structural variation in two human genomes mapped at single-nucleotide resolution by whole genome de novo assembly. Nat. Biotechnol. 29: 723–730.
Marchini, J., B. Howie, S. Myers, G. McVean, and P. Donnelly, 2007 A new multipoint method for genome-wide association studies by imputation of genotypes. Nat. Genet. 39: 906–913. Matise, T. C., F. Chen, W. Chen, F. M. De La Vega, M. Hansenet al.,
2007 A second-generation combined linkage physical map of the human genome. Genome Res. 17: 1783–1786.
McVean, G. A. T., S. R. Myers, S. Hunt, P. Deloukas, D. R. Bentley et al., 2004 Thefine-scale structure of recombination rate var-iation in the human genome. Science 304: 581–584.
Munté, A., J. Rozas, M. Aguadé, and C. Segarra, 2005 Chro-mosomal inversion polymorphism leads to extensive genetic structure: a multilocus survey inDrosophila subobscura. Genet-ics 169: 1573–1581.
Myers, S., L. Bottolo, C. Freeman, G. McVean, and P. Donnelly, 2005 A fine-scale map of recombination rates and hotspots across the human genome. Science 310: 321–324.
Navarro, A., E. Betrán, A. Barbadilla, and A. Ruiz, 1997 Re-combination and geneflux caused by gene conversion and cross-ing over in inversion heterokaryotypes. Genetics 146: 695–709. Navarro, A., A. Barbadilla, and A. Ruiz, 2000 Effect of inversion polymorphism on the neutral nucleotide variability of linked chromosomal regions in Drosophila. Genetics 155: 685–698. Newton-Cheh, C., T. Johnson, V. Gateva, M. D. Tobin, M. Bochud
et al., 2009 Genome-wide association study identifies eight loci associated with blood pressure. Nat. Genet. 41: 666–676. Novembre, J., T. Johnson, K. Bryc, Z. Kutalik, A. R. Boyko et al.,
2008 Genes mirror geography within Europe. Nature 456: 98– 101.
O’Reilly, P. F., E. Birney, and D. J. Balding, 2008 Confounding between recombination and selection, and the Ped/Pop method for detecting selection. Genome Res. 18: 1304–1313.
O’Reilly, P. F., L. J. M. Coin, and C. J. Hoggart, 2010 invertFREGENE: software for simulating inversions in population genetic data. Bio-informatics 26: 838–840.
Osborne, L. R., M. Li, B. Pober, D. Chitayat, J. Bodurtha et al., 2001 A 1.5 million-base pair inversion polymorphism in fam-ilies with Williams-Beuren syndrome. Nat. Genet. 29: 321–325. Padhukasahasram, B., P. Marjoram, and M. Nordborg, 2004 Esti-mating the rate of gene conversion on human chromosome 21. Am. J. Hum. Genet. 75: 386–397.
Price, A. L., N. J. Patterson, R. M. Plenge, M. E. Weinblatt, N. A. Shadicket al., 2006 Principal components analysis corrects for stratification in genome-wide association studies. Nat. Genet. 38: 904–909.
Price, A. L., M. E. Weale, N. Patterson, S. R. Myers, A. C. Needet al., 2008 Long-range LD can confound genome scans in admixed populations. Am. J. Hum. Genet. 83: 132–135; author reply 135–139.
Price, A. L., A. Tandon, N. Patterson, K. C. Barnes, N. Rafaelset al., 2009 Sensitive detection of chromosomal segments of distinct ancestry in admixed populations. PLoS Genet. 5: e1000519. Redon, R., S. Ishikawa, K. R. Fitch, L. Feuk, G. H. Perry et al.,
2006 Global variation in copy number in the human genome. Nature 444: 444–454.
Sabeti, P. C., D. E. Reich, J. M. Higgins, H. Z. P. Levine, D. J. Richter et al., 2002 Detecting recent positive selection in the human genome from haplotype structure. Nature 419: 832–837. Sabeti, P. C., P. Varilly, B. Fry, J. Lohmueller, E. Hostetter et al.,
2007 Genome-wide detection and characterization of positive selection in human populations. Nature 449: 913–918. Schaffner, S. F., C. Foo, S. Gabriel, D. Reich, M. J. Daly et al.,
2005 Calibrating a coalescent simulation of human genome sequence variation. Genome Res. 15: 1576–1583.
Schaeffer, S. W., M. P. Goetting-Minesky, M. Kovacevic, J. R. Peoples, J. L. Graybillet al., 2003 Evolutionary genomics of inversions in Drosophila pseudoobscura: evidence for epistasis. Proc. Natl. Acad. Sci. USA 100: 8319–8324.
Sindi, S. S., and B. J. Raphael, 2010 Identification and frequency estimation of inversion polymorphisms from haplotype data. J. Comput. Biol. 17: 517–531.
Spencer, C. C. A., and G. Coop, 2004 SelSim: a program to sim-ulate population genetic data with natural selection and recom-bination. Bioinformatics 20: 3673–3675.
Stefansson, H., A. Helgason, G. Thorleifsson, V. Steinthorsdottir, G. Masson et al., 2005 A common inversion under selection in Europeans. Nat. Genet. 37: 129–137.
Steinberg, K. M., F. Antonacci, P. H. Sudmant, J. M. Kidd, C. D. Campbellet al., 2012 Structural diversity and African origin of the 17q21.31 inversion polymorphism. Nat. Genet. 44: 872– 880.
Stumpf, M. P. H., and G. A. T. McVean, 2003 Estimating recom-bination rates from population-genetic data. Nat. Rev. Genet. 4: 959–968.
Tantisira, K. G., R. Lazarus, A. A. Litonjua, B. Klanderman, and S. T. Weiss, 2008 Chromosome 17: association of a large inversion polymorphism with corticosteroid response in asthma. Pharma-cogenet. Genomics 18: 733–737.
Voight, B. F., S. Kudaravalli, X. Wen, and J. K. Pritchard, 2006 A map of recent positive selection in the human genome. PLoS Biol. 4: e72.
Wegmann, D., D. E. Kessner, K. R. Veeramah, R. A. Mathias, D. L. Nicolaeet al., 2011 Recombination rates in admixed individu-als identified by ancestry-based inference. Nat. Genet. 43: 847– 853.
Weir, B. S., L. R. Cardon, A. D. Anderson, D. M. Nielsen, and W. G. Hill, 2005 Measures of human population structure show het-erogeneity among genomic regions. Genome Res. 15: 1468– 1476.
Winckler, W., S. R. Myers, D. J. Richter, R. C. Onofrio, G. J. McDonald et al., 2005 Comparison of fine-scale recombination rates in humans and chimpanzees. Science 308: 107–111.
WTCCC, 2007 Genome-wide association study of 14,000 cases of seven common diseases and 3,000 shared controls. Nature 447: 661–678.
Yu, H. X., J.-M. Chia, G. Bourque, M. V. Wong, S. H. Chanet al., 2005 A population-based LD map of the human chromosome 6p. Immunogenetics 57: 559–565.
Communicating editor: A. Di Rienzo
GENETICS
Supporting Information
http://www.genetics.org/lookup/suppl/doi:10.1534/genetics.112.145599/-/DC1
The Effect of Genomic Inversions on Estimation
of Population Genetic Parameters from SNP Data
Nafisa-Katrin Seich al Basatena, Clive J. Hoggart, Lachlan J. Coin, and Paul F. O’Reilly
N-‐K. Seich al Basatena et al.
2 SI
File S1
LDhat is a package of programs written in the C language for the analysis of recombination from population genetic data. The key feature of the package is the estimation of population recombination rates using the composite likelihood method (HUDSON 2001).
N-‐K. Seich al Basatena et al. 3 SI
File S2
iHS is an analytical method and statistic used to scan SNP data for signals of recent positive selection based on the EHH (extended haplotype homozygosity) statistic proposed by Sabeti et al. (2002). The software that calculates the unstandardised iHS statistic is available under request from the developers.
N-‐K. Seich al Basatena et al.
4 SI
File S3
SelSim is a program for Monte Carlo simulation of SNP data for a recombining region within which a single bi-‐allelic site has experienced natural selection. It allows simulation from either a fully stochastic model of, or deterministic approximations to, natural selection within a coalescent framework.
The simulated data generated with SelSim and invertFREGENE under the neutral model produce slightly different distributions of the iHS statistic. The two software were run under the same parameter settings (effective population size, mutation rate and recombination map) and therefore the observed differences can be attributed to the different
N-‐K. Seich al Basatena et al. 5 SI
Figure S1 Distribution of inversion lengths of known human inversions. Shows the length distribution of all human genomic inversion polymorphisms recorded on the TCAG database (http://projects.tcag.ca/variation/), accessed on 22/02/12.
N-‐K. Seich al Basatena et al.
6 SI
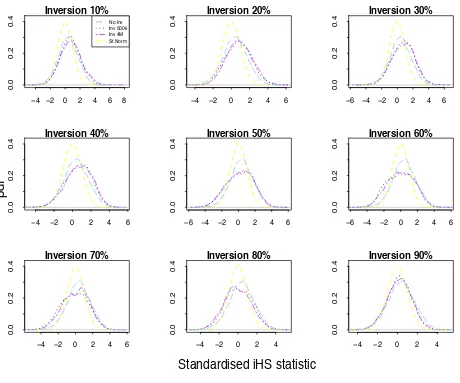
N-‐K. Seich al Basatena et al. 7 SI Figure S3 Distribution of standardised iHS statistic at different inversion frequencies compared to the null distribution. Compares the standard normal distribution (yellow), the distribution of the standardised iHS statistic from simulated data without inversions (light blue), the distribution of the standardised iHS statistic calculated at the centre of a simulated inversion of length 500 kb (dashed purple) and 4 Mb (dotted purple), as described in the text, at different frequencies of the inverted sequence.
−4 −2 0 2 4 6 8
0.0 0.2 0.4 Inversion 10% No Inv Inv 500k Inv 4M St.Norm
−4 −2 0 2 4 6
0.0
0.2
0.4
Inversion 20%
−6 −4 −2 0 2 4 6
0.0
0.2
0.4
Inversion 30%
−4 −2 0 2 4 6
0.0
0.2
0.4
Inversion 40%
−6 −4 −2 0 2 4 6
0.0
0.2
0.4
Inversion 50%
−6 −4 −2 0 2 4 6
0.0
0.2
0.4
Inversion 60%
−4 −2 0 2 4 6
0.0
0.2
0.4
Inversion 70%
−4 −2 0 2 4
0.0
0.2
0.4
Inversion 80%
−4 −2 0 2 4
0.0 0.2 0.4 Inversion 90%
p
df
N-‐K. Seich al Basatena et al.
8 SI
Figure S4 The presence of inversions can be captured in the leading principal components (PCs) in an unstructured population. The loadings of the SNPs on the top six PCs across 15 pseudo-‐chromosomes simulated as being from a population with no structure (as described in the text), with the addition of a simulated 4 Mb inversion locus with inverted sequence at 20% frequency (black squares) at position ‘A’. The variation attributed to the inverted region is captured in the 1st PC in this unstructured population, whereas the variation in loadings across the rest of the genome and the other PCs is
uniform.
N-‐K. Seich al Basatena et al.
10 SI
N-‐K. Seich al Basatena et al.
12 SI
N-‐K. Seich al Basatena et al.
14 SI
N-‐K. Seich al Basatena et al.
16 SI
N-‐K. Seich al Basatena et al.
18 SI
N-‐K. Seich al Basatena et al.
20 SI
N-‐K. Seich al Basatena et al.
22 SI
N-‐K. Seich al Basatena et al. 23 SI WTCCC data, with simulated 80% inversion included
N-‐K. Seich al Basatena et al.
24 SI
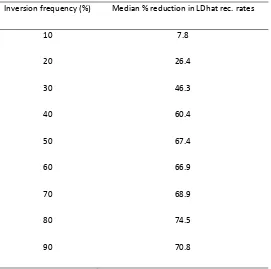
Table S1 Median reduction in LDhat recombination rate estimates relative to the simulated rates.
Inversion frequency (%) Median % reduction in LDhat rec. rates
10 7.8
20 26.4
30 46.3
40 60.4
50 67.4
60 66.9
70 68.9
80 74.5
90 70.8
The median percentage reduction in recombination rates estimated by LDhat compared to the simulated rates between adjacent pairs of SNPs within inversion loci (after adjustment for systematic over-‐estimation of median rates, which results from median recombination rates over short physical distance being low due to the non-‐uniform distribution of
recombination in the genome) is shown across the range of inversion frequencies, for the simulation study described in the text and illustrated by Figure 1 and Table 1. We show the median reductions as Supporting Information only as we consider the mean reductions (see Table 1) a more appropriate guide in the comparison of the rates because, (i) over larger regions the median rates converge to the mean rates (the latter are not dependent on the distance over which they are
N-‐K. Seich al Basatena et al. 25 SI Supplementary literature cited
Hudson, R. R. (2001). "Two-‐locus sampling distributions and their application." Genetics 159(4): 1805-‐1817.
Sabeti, P. C. et al. (2002). "Detecting recent positive selection in the human genome from haplotype structure." Nature
419(6909): 832-‐837.
Voight, B. F., et al. (2006). "A map of recent positive selection in the human genome." PLoS Biology 4(3): e72-‐e72.