Climate for Innovation Perceptions: An Application of Latent Profile Analysis. (Under the direction of Samuel B. Pond, III.)
In this research study, I conceptualized climate for innovation perceptions as representing subjective interpretations of the environment, and also as representing a complex and dynamic interaction between people and environments. Simple variable approaches and, as demonstrated by Young and Parker (1999), simple aggregation of climate survey scores to formal organizational groups seems inadequate to represent this complexity. The use of clustering techniques to identify homogeneous groups with regard to perceptions of climate (e.g., Schneider & Reichers, 1983; Mathisen & Einarsen, 2004; Joyce & Slocum, 1984) is an approach that can represent data complex interactions of people and environments. Researchers have not yet determined which clustering techniques best account for the complex influences on perceptions of climate or best predict associated organizational outcomes.
Latent profile analysis (LPA) is a clustering technique that may move the climate research forward. I used LPA to classify individuals by their climate for innovation perceptions and simultaneously to assess the relative contributions of situational and individual difference covariates, including company membership, functional membership, organizational level, and organizational tenure. Latent class membership was used to predict affective, normative, and continuance (ANC) commitment to the organization; ANC commitment to innovation, creative innovative work behavior (IWB), and implementation IWB to determine if latent class membership predicted these outcomes beyond the contribution climate for innovation perceptions.
analysis fit, maximal and internal consistency reliability, and expected factor interrelationships.
After I identified three viable latent class solutions using LPA, I used multivariate analysis of variance (MANOVA) to examine the relationships among situational and individual difference covariates. I concluded that individual differences contributed more to perceptions of climate for innovation than did situational variables. I next used multivariate analysis of covariance (MANCOVA) to test whether latent class membership predicted commitment and IWB, with ICCS scores entered as covariates. For two latent class solutions, class membership predicted normative commitment to innovation; for one solution, class membership predicted IWB. Power and effect sizes for all of these analyses were low. Finally, I tested the hypotheses that climate
perceptions decrease with increasing organizational tenure at the group and company level. Neither test was statistically significant but, at the company level, effect sizes were moderate and sample size was small.
Improving the Prediction of Commitment and Innovative Work Behavior from Climate for Innovation Perceptions: An Application of Latent Profile Analysis
by
April Renée Cantwell
A dissertation submitted to the Graduate Faculty of North Carolina State University
in partial fulfillment of the requirements for the Degree of
Doctor of Philosophy
Psychology
Raleigh, North Carolina
2010
APPROVED BY:
_________________________________ _________________________________
Mark A. Wilson S. Bartholomew Craig
_________________________________ _________________________________
Lynda Aiman-Smith Samuel B. Pond, III
Dedication
Biography
Acknowledgements
I would like to thank all of my friends, family members, professors, and colleagues for their support and encouragement throughout graduate school and during the process of writing this dissertation. I would like to thank the Center for Innovation Management Studies (CIMS) at North Carolina State University for
providing the data for this project. I am grateful to all of the members of my graduate committee. In particular, I want to thank Dr. Samuel B. Pond, III for chairing my committee, developing ideas with me, and sticking with me over these many years. I am very grateful to Dr. Lynda Aiman-Smith for her ongoing guidance and support, and for giving me so many opportunities to grow. I want to thank Dr. S. Bart Craig and Dr. Mark A. Wilson for their encouragement and contributions to this project.
I want to thank Dr. Donald W. Drewes for teaching me about systems and methodology, and for allowing me to go back to the well so often. I want to thank Jennifer J. Norton for everything, but in particular for her sense of humor and for reading and editing my dissertation twice. I am grateful to Kay Robin Alexander for her help in the technical editing of this dissertation.
Table of Contents
List of Tables ... vii
List of Figures ... xiv
Introduction ... 1
Innovation ... 2
Climate Focus ... 4
Climate and Levels of Analysis ... 7
Climate Dimensionality... 12
Climate for Innovation ... 14
Climate for Innovation Outcomes ... 16
Conclusion... 20
Theoretical and Methodological Framework and Implications... 22
Research Questions and Hypotheses ... 27
Method ... 28
Participants ... 28
Measures ... 29
Research Design ... 33
Results ... 39
Confirmatory Factor Analysis (CFA)... 39
Outlier Analysis ... 57
Latent Profile Analysis (LPA) ... 58
Multivariate Analysis of Covariance (MANCOVA)... 85
Homogeneity of Variance Tests... 101
Discussion ... 107
Contributions of the Present Study ... 107
Limitations of the Present Study ... 115
Directions for Future Research ... 117
Conclusion... 120
References ... 122
Appendices ... 132
Appendix A: Instruments ... 133
Appendix B: Comparison of the Theoretical Dimensions of the ICCS and Other Measures... 139
Appendix C: Results for Latent Profile Analysis (LPA) Model A and B Including Outlier Data... 142
Appendix D: Demographic and Summary Data and Latent Profile Analysis (LPA) ... 161
Appendix E: Logistic Regression Parameter Estimates and Tests of Significance ... 166
Appendix F: Estimated Marginal Means for MANOVA Results ... 179
List of Tables
Table 1 Theoretical Dimensions of the Innovation-Capacity Climate Survey (ICCS)……….…... ..30
Table 2 Demographic Variables and Levels for Companies A, B, C and D……… ..33 Table 3 Frequency Data for Company Membership for Two Random Splits of Complete Dataset………... ..39
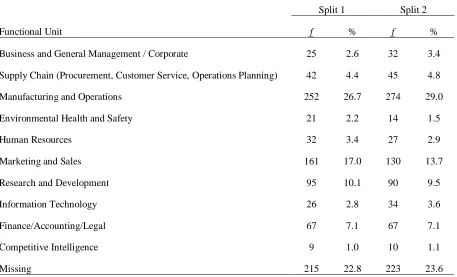
Table 4 Frequency Data for Functional Unit Membership for Two Random Splits of Complete Dataset…. ..40
Table 5 Frequency Data for Organizational level for Two Random Splits of Complete Dataset…………... ..40 Table 6 Frequency Data for Organizational Tenure for Two Random Splits of Complete Dataset………… ..41
Table 7 Fit Statistics for Innovation-Capacity Climate Survey (ICCS)………... ..43
Table 8 Standardized Estimates of Manifest Variable Equations for Innovation-Capacity Climate Survey
by Split……… ..44
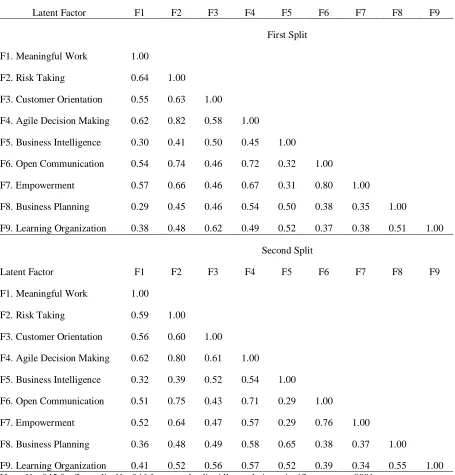
Table 9 Factor Intercorrelations for Innovation-Capacity Climate Survey (ICCS) for First Split and
Second Split of Dataset………... ..46
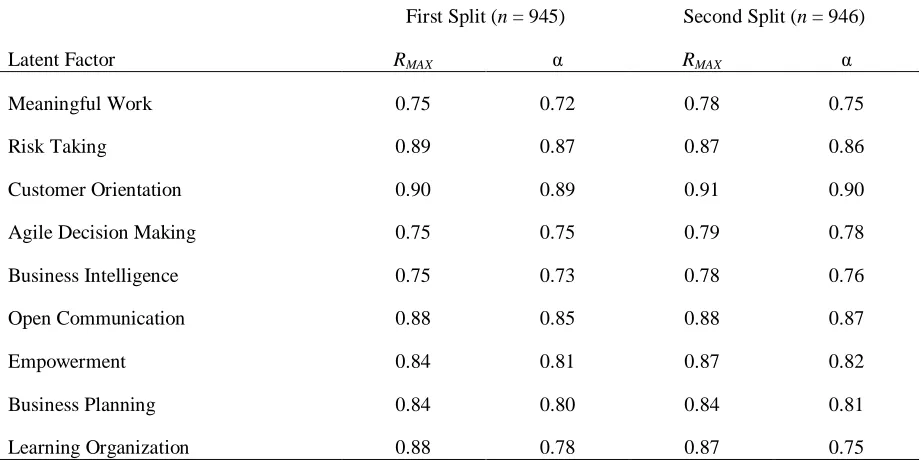
Table 10 Maximal Reliability and Internal Consistency Reliability for the Innovation-Capacity Climate
Survey (ICCS)………. ..47
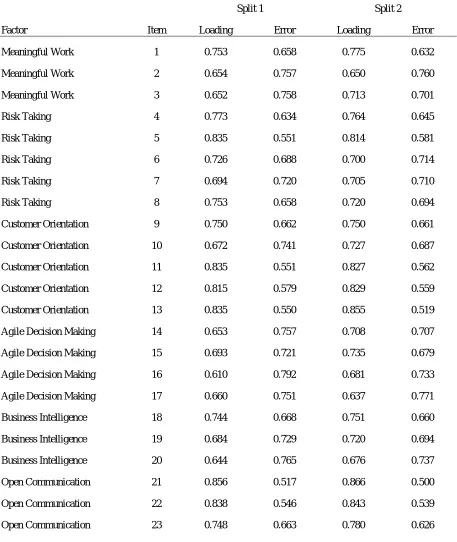
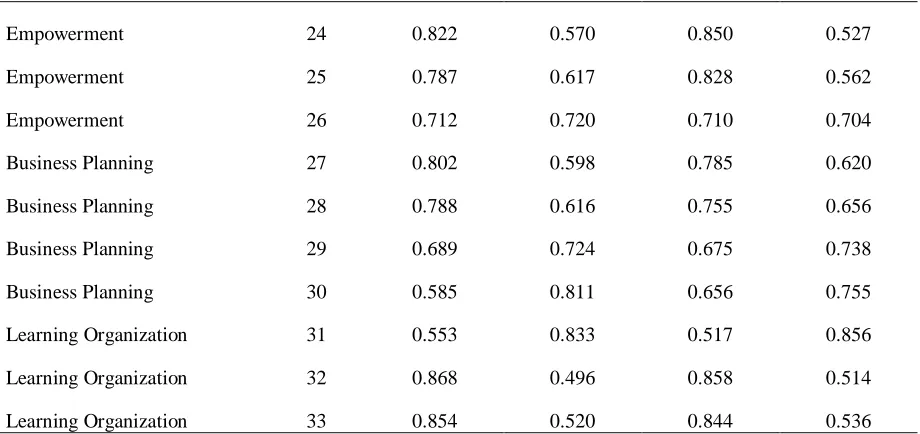
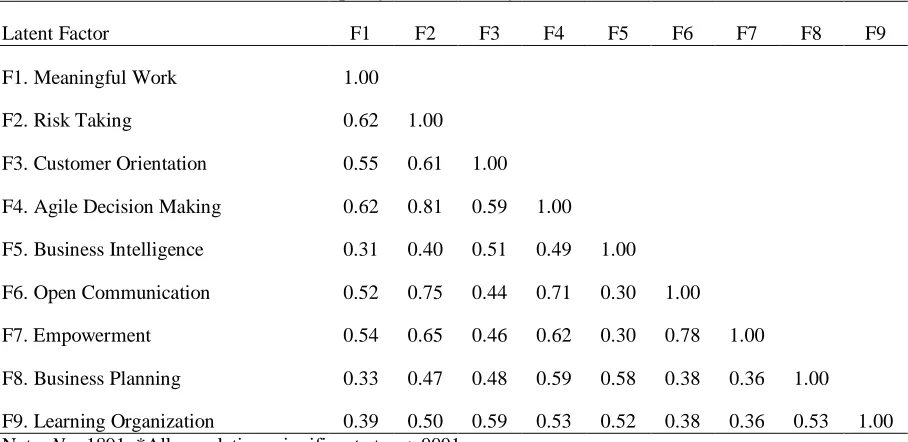
Table 11 Factor Intercorrelations for Innovation-Capacity Climate Survey (ICCS)………. ..48 Table 12 Standardized Factor Loadings, Error, and R2 values for Innovation-Capacity Climate Survey
(ICCS)………. ..49
Table 13 Confirmatory Factor Analysis (CFA) Fit Statistics for Outcome Scales……… ..52 Table 14 Standardized Factor Loadings, Error, and R2 for Affective, Continuance, and Normative
Commitment to the Organization (ACN-O) Subscales………... ..54
Table 15 Standardized Factor Loadings, Error, and R2 for Normative Commitment to Innovation (ANC-I)
Subscales………. ..54
Table 16 Standardized Factor Loadings, Error, and R2 for Innovative Work Behavior (IWB) Subscales…… ..55 Table 17 Maximal Reliability and Internal Consistency Reliability Estimates for Outcome Scales………… ..55
Table 19 Latent Profile Analysis (LPA) Model A Fit Statistics……… ..61
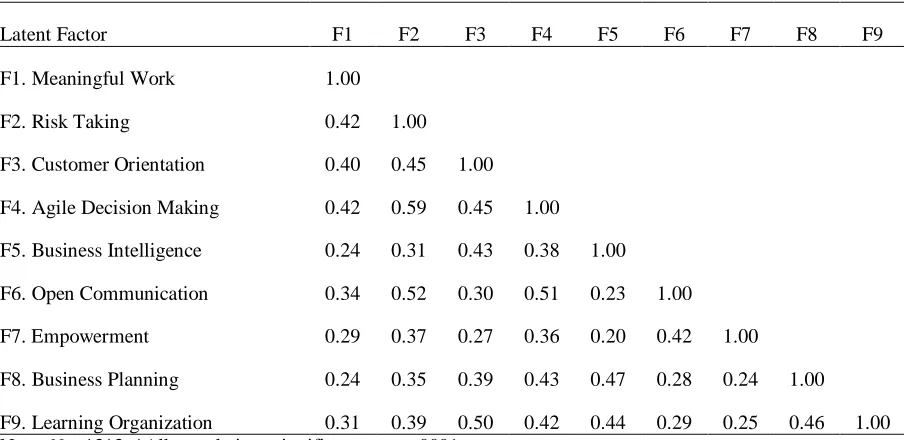
Table 20 Average Latent Class Probabilities for Latent Class Membership (Row) by Most Likely Latent Class (Column) for Latent Class Analysis Model A Two-Class Solution……….. ..62 Table 21 Innovation-Capacity Climate Survey (ICCS) Factor Intercorrelations Resulting from Latent
Profile Analysis Model A Two-Class Solution………... ..62
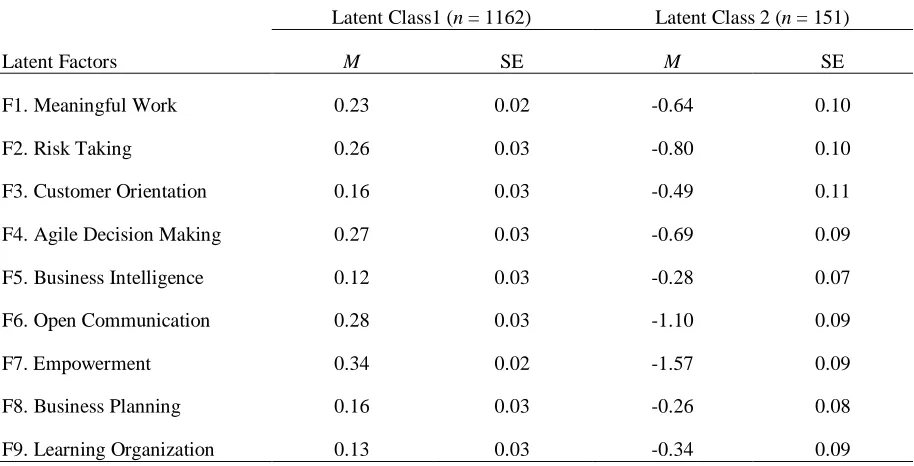
Table 22 Summary Statistics for Latent Profile Analysis Model A Class Solution for Innovation-Capacity Climate Survey (ICCS) Factor Scores……… ..63
Table 23 Demographic Covariate Tests of Significance for Latent Profile Analysis (LPA) Model A,
Two-Class Solution………. ..65
Table 24 Latent Profile Analysis (LPA) Model B Fit Statistics……… ..67
Table 25 Average Latent Class Probabilities for Latent Class Membership (Row) by Most Likely Latent Class (Column) for Latent Class Analysis Model B Three- and Five-Class Solutions……….. ..68 Table 26 Innovation-Capacity Climate Survey (ICCS) Factor Intercorrelations for Three- and Five-Class
Solutions………....69
Table 27 Summary Statistics for Latent Profile Analysis Model B Three-Class Solution on
Innovation-Capacity Climate Survey (ICCS) Factor Scores………. ..70
Table 28 Summary Statistics for Latent Profile Analysis Model B Five-Class Solution on
Innovation-Capacity Climate Survey (ICCS) Factor Scores………. ..71
Table 29 Comparison of Latent Profile Analysis (LPA) Model B Latent Class Assignments for Three- and Five-Class Solutions for ICCS Factor Scores………. ..75 Table 30 Logistic Regressions Global Tests of Significance Results for Latent Profile Analysis (LPA)
Model B, Three- and Five-Class Solutions………. ..76
Table 31 Logistic Regressions Global Tests of Significance Results for Latent Profile Analysis (LPA)
Model A……….. ..76
Table 33 Multivariate Tests for Multivariate Analysis of Variance (MANOVA) for Prediction of ICCS
Factor Scores from Demographic Covariates……….… ..80
Table 34 Between Subjects Effects for Multivariate Analysis of Variance (MANOVA) to Predict ICCS Latent Scores from Demographic Factors……….. ..82
Table 35 Summary Statistics for LPA Model A Covariate and Dependent Variable Factor Scores………… ..86
Table 36 Multivariate Tests for Multivariate Analysis of Covariance (MANCOVA) for Latent Profile
Analysis (LPA) Model A……….……... ..87
Table 37 Between Subjects Effects for Latent Profile Analysis (LPA) Model A Multivariate Analysis of
Covariance……….. ..89
Table 38 Estimated Marginal Means by Latent Profile Analysis (LPA) Model A Classes with Nine
Innovation-Capacity Climate Survey (ICCS) Factor Score Covariates……….. ..90 Table 39 Summary Statistics for LPA Model B Three-Class Solution, Covariate and Dependent Variable
Factor Scores……….……….. ..92
Table 40 Multivariate Tests for Multivariate Analysis of Covariance (MANCOVA) for Latent Profile
Analysis (LPA) Model B Three-Class Solution……….……… ..93 Table 41 Summary Statistics for LPA Model B Five-Class Solution, Covariate and Dependent Variable
Factor Scores……….. ..94
Table 42 Multivariate Tests for Multivariate Analysis of Covariance (MANCOVA) for Latent Profile
Analysis (LPA) Model B Five-Class Solution……… ..95
Table 43 Between Subjects Effects for Latent Profile Analysis (LPA) Model B Five-Class Solution
Multivariate Analysis of Covariance (MANCOVA)……….…………. ..96 Table 44 Estimated Marginal Means by Latent Profile Analysis (LPA) Model B Five-Class Solution with
Nine Innovation-Capacity Climate Survey (ICCS) Factor Score Covariates………. ..97
Table 46 Levene's Test of Equality of Error Variances for Tenure and Innovation-Capacity Climate Survey
(ICCS) Factor Scores……….. 103
Table 47 Transformation of Tenure from Categorical to Ratio Level Data………. 105 Table 48 Correlations of Mean Tenure with Innovation-Capacity Climate Survey (ICCS) Latent Factor
Variances for Functional Unit Groups……….…………... 105
Table 49 Correlations of Mean Tenure with Innovation-Capacity Climate Survey (ICCS) Latent Factor
Variances for Companies……….…………... 106
Table 50 Comparison of ICCS Theoretical Dimensions to Other Measures……….……… 140 Table 51 Frequency Data for Company Membership for Latent Profile Analysis (LPA) Model A
(Including Outliers) Sample……… 143
Table 52 Frequency Data for Functional Unit Membership for Latent Profile Analysis (LPA) Model A
Sample………. 144
Table 53 Frequency Data for Organizational level for Latent Profile Analysis (LPA) Model A (Including
Outliers) Sample………. 144
Table 54 Frequency Data for Organizational Tenure for Latent Profile Analysis (LPA) Model A
(Including Outliers) Sample……… 145
Table 55 Latent Profile Analysis (LPA) Model A (Including Outliers) Fit Statistics………... 145
Table 56 Average Latent Class Probabilities for Latent Class Membership (Row) by Most Likely Latent Class (Column) for Latent Class Analysis Model A (Outliers Included) Two-Class Solution…….. 146
Table 57 Innovation-Capacity Climate Survey (ICCS) Factor Intercorrelations Resulting from Latent
Profile Analysis Model A (Outliers Included) Two-Class Solution………... 147
Table 58 Summary Statistics for Latent Profile Analysis Model A (Including Outliers) Classes on
Innovation-Capacity Climate Survey (ICCS) Factor Scores……….. 148
Table 59 Demographic Covariate Tests of Significance for Latent Profile Analysis (LPA) Model A
Table 60 Latent Profile Analysis (LPA) results LPA Model B (Including Outliers)……… 151
Table 61 Average Latent Class Probabilities for Latent Class Membership (Row) by Most Likely Latent Class (Column) for ICCS Five-Class Solution Without Covariates……….. 152 Table 62 Innovation-Capacity Climate Survey (ICCS) Factor Intercorrelations Latent Profile Analysis
Five-Class Solution………. 153
Table 63 Summary Statistics for Latent Profile Analysis Model B (Including Outliers) Five-Class Solution on Innovation-Capacity Climate Survey (ICCS) Factor Scores………. 155
Table 64 Logistic Regressions Global Tests of Significance Results for Latent Profile Analysis (LPA)
Model B (Including Outliers)……….. 156
Table 65 Logistic Regressions Global Tests of Significance Results for Latent Profile Analysis (LPA)
Model A (Including Outliers)………. 157 Table 66 Frequencies of Outliers Identified by Mahalanobis Distances and Leverage Values Across ICCS
Latent Classes for Latent Profile Analysis Model B (Including Outliers)……….. 158
Table 67 Latent Class Assignments Among the LPA Model A (Including Outliers) and LPA Model B
(Including Outliers) Solutions………. 159 Table 68 Comparison of Latent Class Assignments for Five-Class Latent Class Solutions With and
Without Outliers……….. 160
Table 69 Comparison of Latent Profile Analysis (LPA) Model A Class Assignments With and Without
Outliers……… 160
Table 70 Frequency Data for Company Membership for Latent Profile Analysis (LPA) Model A Sample… 162 Table 71 Frequency Data for Functional Unit Membership for Latent Profile Analysis (LPA) Model A
Sample………. 162
Table 72 Frequency Data for Organizational level for Latent Profile Analysis (LPA) Model A Sample……. 163
Table 75 Frequency Data for Functional Unit Membership for Latent Profile Analysis (LPA) Model B
Sample………. 164
Table 76 Frequency Data for Organizational level for Latent Profile Analysis (LPA) Model B Sample……. 164 Table 77 Frequency Data for Organizational Tenure for Latent Profile Analysis (LPA) Model B Sample…. 165
Table 78 Latent Profile Analysis (LPA) Model A Parameter Results for Logistic Regression Analysis of Class Membership on Company Membership……… 167 Table 79 Latent Profile Analysis (LPA) Model A Parameter Results for Logistic Regression Analysis of
Class Membership on Functional Unit Membership……….. 167 Table 80 Latent Profile Analysis (LPA) Model A Parameter Results for Logistic Regression Analysis of
Organizational Level on Company Membership……… 168
Table 81 Latent Profile Analysis (LPA) Model A Parameter Results for Logistic Regression Analysis of
on Tenure……… 168
Table 82 Latent Profile Analysis (LPA) Model B Parameter Results for Logistic Regression Analysis of Class Membership on Company Membership for Three-Class Solution………... 169
Table 83 Latent Profile Analysis (LPA) Model B Parameter Results for Logistic Regression Analysis of Class Membership on Functional Unit Membership for Three-Class Solution……….. 169
Table 84 Latent Profile Analysis (LPA) Model B Parameter Results for Logistic Regression Analysis of Organizational Level on Company Membership for Three-Class Solution……….. 170
Table 85 Latent Profile Analysis (LPA) Model B Parameter Results for Logistic Regression Analysis of Class Membership on Company Membership for Three-Class Solution……….. 170 Table 86 Latent Profile Analysis (LPA) Model B Parameter Results for Logistic Regression Analysis of
Class Membership on Company Membership for Five-Class Solution……….. 171
Table 88 Latent Profile Analysis (LPA) Model B Parameter Results for Logistic Regression Analysis of Organizational Level on Company Membership for Five-Class Solution……….. 173
Table 89 Latent Profile Analysis (LPA) Model B Parameter Results for Logistic Regression Analysis of Class Membership on Company Membership for Five-Class Solution……….. 173
Table 90 Latent Profile Analysis (LPA) Model A (Including Outliers) Parameter Results for Logistic
Regression Analysis of Class Membership on Company Membership……….. 174 Table 91 Latent Profile Analysis (LPA) Model A (Including Outliers) Parameter Results for Logistic
Regression Analysis of Class Membership on Functional Unit Membership……… 174 Table 92 Latent Profile Analysis (LPA) Model A (Including Outliers) Parameter Results for Logistic
Regression Analysis of Organizational Level on Company Membership……….. 175
Table 93 Latent Profile Analysis (LPA) Model A )(Including Outliers) Parameter Results for Logistic
Regression Analysis of Class Membership on Company Membership……….. 175 Table 94 Latent Profile Analysis (LPA) Model B (Including Outliers) Parameter Results for Logistic
Regression Analysis of Class Membership on Company Membership……….. 176
Table 95 Latent Profile Analysis (LPA) Model B (Including Outliers) Parameter Results for Logistic
Regression Analysis of Class Membership on Functional Unit Membership……… 177
Table 96 Latent Profile Analysis (LPA) Model B (Including Outliers) Parameter Results for Logistic
Regression Analysis of Organizational Level on Company Membership……….. 178
Table 97 Latent Profile Analysis (LPA) Model B (Including Outliers) Parameter Results for Logistic
Regression Analysis of Class Membership on Company Membership……….. 178
Table 98 Estimated Marginal Means of ICCS Latent Factor Scores for Functional Unit Membership……… 180 Table 99 Estimated Marginal Means of ICCS Latent Factor Scores for Organizational Level……… 184
List of Figures
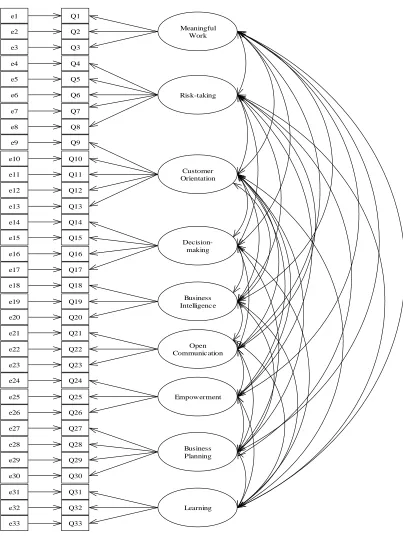
Figure 1. Measurement Model for Innovation-Capacity Climate Survey (ICCS) ... 42
Figure 2. Measurement Model for Affective, Normative, and Continuance Commitment to Organization ... 51
Figure 3. Measurement Model for Affective, Normative, and Continuance Commitment to Innovation ... 51
Figure 4. Measurement Model for Innovative Work Behavior ... 52
Figure 5. Theoretical Latent Profile Analysis Model A with Nine Latent Continuous Innovation-Capacity Climate Survey (ICCS) Factor Scores and Four Categorical Demographic Covariates ... 60
Figure 7. Innovation-Capacity Climate Survey (ICCS) Latent Profile Analysis (LPA) Mixture Model with Continuous Variables that Correlate within Class... 66
Figure 8. Latent Profiles for Model B, Three-Class Innovation-Capacity Climate Survey (ICCS) with Outliers Removed. ... 72
Figure 9. Latent Profiles for Model B Five-Class Innovation-Capacity Climate Survey (ICCS) with Outliers Removed. ... 73
Figure 10. Estimated Marginal Means of Dependent Variables by Latent Profile Analysis (LPA) Model A. .... 90
Figure 11. Estimated Marginal Means of Dependent Variables by Latent Profile Analysis (LPA) Model B Five-Class Solution (with Five-Class 1 omitted). ... 99
Figure 12. Latent Profiles for LPA Model A (Outliers Included) Two-Class Innovation-Capacity Climate Survey (ICCS). ... 149
There is sufficient evidence in the psychological literature to suggest that individual perceptions of a climate for innovation strongly and positively relate to outcomes such as innovative work behavior,
commitment to the organization, and commitment to innovation. These relationships, which occur at the individual level, show that when an individual perceives that the work environment is innovative, he or she demonstrates stronger affective commitment to the organization and innovation, and is likely to perform innovative work behaviors. Although organizational researchers and practitioners often want to make inferences at a higher level of aggregation than the individual-level, there is insufficient evidence to conclude that all individuals in the same environment perceive that environment in the same way. Nor is there sufficient evidence to conclude that individuals in the same environment feel equally committed or perform innovative behaviors to the same extent. Therefore, addressing climate for innovation research at an individual level seems most appropriate and effective.
This study represents a step toward greater understanding of psychological climate, particularly the psychological climate for innovation. It aims to identify whether individual differences affect the relationships between perceptions of climate and important outcomes (e.g., commitment to the organization, commitment to innovation, and the performance of innovative work behaviors). In addition, this work introduces a relatively new measure of the climate for innovation into the psychological literature.
Commitment to innovation is a very important outcome associated with worker perceptions of an organizational climate highly conducive to innovation. In this study, commitment is conceptualized according to Meyer and Herscovitch’s (2001) and Herscovitch and Meyer’s (2002) three-component model of
commitment (affective, normative, and continuance) extended to multiple targets (commitment to the
organization and commitment to innovation). This study is the first to measure commitment to innovation using an adaptation of this three-component model, and among the first to apply a new technique: latent profile analysis (LPA), which was applied to cluster organizational members according to their climate for innovation perceptions. Because LPA identifies individuals who share patterns of perception, its use accounts for
Use of the attraction-selection-attrition (ASA) model (Schneider, 1987) allows researchers to describe the climate of an organization in terms of the attributes of its members, and to assess these attributes by climate measures. When organizational climate is examined in this manner, analysis of an individual’s perception of climate may provide insight into the attributes of that individual and his/her observations of the situation. Although individuals in the same environment are likely to share similar perceptions of it, due to situational attributes, people with similar personalities in different environments are also likely to share perceptions of climate due to common characteristics that influence the way any environment is perceived. People dynamically interact with their environment (Terborg, 1981) in such a way that they are not only experiencing it, they are shaping it.
I begin this literature review by making a case for innovation as an important topic in the
psychological literature. Next, I review of the concept of climate and present a summary of related literature (the focus of climate research, climate levels of analysis, and climate dimensionality) and a discussion of the concept of climate in terms of innovation and its outcomes. Next, I summarize various literature streams to emphasize the key points addressed in this study. I conclude the literature review with the presentation of a theoretical and methodological framework, eight research questions, and two explicit research hypotheses. Innovation
Although innovation receives significant attention in the academic and popular business management literatures, its definition is often ambiguous (Adams, Bessant, & Phelps, 2006). For this study, I defined innovation as the development and introduction of a new idea and the ability to transform that idea into a product, process, object, or service. Innovation is not only for research and for development functions; it can occur within all parts of an organization and be practiced by people at all levels of an organization as they ideate and change the way they perform work (Kanter, 1983).
behavior in the workplace might provide a useful link between the business literature and work-world experiences. It is important to consider innovation in the psychological literature to assure its currency and utility.
Small businesses (fewer than 500 employees) create a significant number of new products and services and produce as many as 14 times more patents per employee than large businesses do (Leebaert, 2006). The patents produced by small businesses are twice as likely to be among the top 1% of patents cited by other researchers, which indicates that they are highly significant. In addition, small businesses employ 39% more scientists, engineers, and information technology (IT) workers compared to large businesses. Small businesses have other advantages and distinctive features as well: (a) they collaborate more openly to create new business partnerships and alliances; (b) they are more diverse, providing more opportunities for women and ethnic minorities; (c) they are more flexible and adaptable to changing economic conditions; (d) they account for 45% of U.S. technology spending; (e) they are more likely to deploy flexible production techniques; and (f) they offer improved job satisfaction and increased autonomy to their employees (Leebaert, 2006).
Large businesses are also innovating, of course, and taking a variety of approaches. Gillette spends millions of dollars globally each year on R&D and has set a goal of generating 40% of its revenues from new products (Center for Management Research, 2003). Its intensive R&D investments and strategy that involves developing product extensions have been largely successful for Gillette, which clearly views innovation as important and even launched an “Innovation is Gillette” marketing campaign. Nonetheless, R&D expenditures in an individual corporation or even across an industry are an insufficient measure to describe how and why innovation happens.
Another, wider model for innovation in a large company is seen at Proctor and Gamble (P&G), whose “Connect and Develop” program aims to build collaborative relationships and create partnerships with
As the U.S. economy becomes more knowledge-based and faces increased competition and an accelerated pace of change, it is a matter of survival for innovation to become a stronger area of focus for businesses both large and small (Adams, Bessant, & Phelps, 2006; Dougherty, 1996). Dougherty (1996) noted that despite the considerable attention paid to innovation in the industrial and management literatures,
organizations––and in particular large organizations––do not innovate effectively. Believing that the flexibility and collaboration characteristic of small businesses may come naturally to them, some large businesses are attempting to foster situations that will allow them to capture some of the innovation advantages of small businesses. The P&G model, for example, is similar to a small business model: it involves collaboration, the open sharing of ideas, flexibility, empowerment, and rewards for innovation. Despite real differences in implementation, both small businesses and large business, (P&G, and Gillette being examples of the latter), seek to create environments that promote innovation. One could say that P&G as well as the general model for small businesses offer unique psychological climates––climates for innovation––that make innovation more likely to occur.
In order to address climates for innovation in detail, it is important to first explore the concept of climate itself. Specifically, the climate for innovation concept is a derivative of the “climate for something” approach (Schneider & Reichers, 1983) in the psychological climate literature. The more general climate construct, however, has a long history related to investigating the general influence of the environment, and in particular the influence of organizational systems, on individual behavior (Denison, 1996). In the sections that follow, I review several interdependent streams of the climate research literature, including the focus of climate research, the appropriate level of analysis in climate research, and the dimensionality of the climate construct. Despite its history, climate research still contains important, unresolved issues that are relevant to climate for innovation research.
Climate Focus
the subjective interpretation of two objective events (wind speed and temperature) and concluding that the combination and interaction of objective characteristics and subjective interpretations is likely the truly important characteristic. In fact, the frequent use of survey methods by psychological researchers to collect climate data (Denison, 1996) implies their general satisfaction with the use of subjective interpretations.
The “structural approach” to climate research proposes that the characteristics of the organization, for example its structure and policies, affect individual perceptions of climate (Schneider & Reichers, 1983). From this perspective, the organizational environment shapes member perceptions of climate. James and his
colleagues (James, Choi, Chia-Huei, McNeil, Minton, Wright, & Kim, 2007; James & James, 1989) described the importance of description and evaluation in assessments of climate but also noted that individuals’ description of climate does not occur in the absence of their interpretations of its value. Inherent in this observation is the idea that an individual’s values are part of the assessment of climate.
Schneider and his colleagues made notable contributions to climate research through the development and testing of the attraction-selection-attrition (ASA) model. Lewin’s (1951) classic field theory postulates that behavior is a function of a person in an environment, expressed as B = f(P,E). In a seminal article that modified Lewin’s field theory, Schneider (1987) stated that behavior is not a function of a person in environment; instead, the environment is a function of the people behaving in it, or E = f(P,B). Lewin, who posited that behavior is a function of people in an environment, places great emphasis on the importance of the environment in determining behavior. In contrast to field theory, Schneider’s proposition that people are the environment emphasizes the roles of people and their personalities, tendencies, and behaviors in creating and shaping environments. This idea led to the development of the attraction-selection-attrition (ASA) model, which states that: (a) people are attracted to and self-select into organizations based on organizational characteristics that are similar to their own personal characteristics; (b) organizations select people with personalities or tendencies similar to those inherent to the organization; and (c) if people do not “fit” the organization, they leave it by one means or another (Schneider, 1987).
individual members. In other words, selection and attrition procedures reproduce and reinforce climate. Similar types of people self-select into an organization, and organizational incumbents select new members viewed as similar in terms of their attributes, values, and other characteristics. Once in an organization, individuals stay or leave based on conditions of person-organization congruence. According to Bretz, Ash, and Dreher (1989), ASA predicts that organizations become more homogenous over time, and are therefore less able to change, or to respond to threats or opportunities in the environment. Alternately, homogeneity might provide the steadiness an organization needs in order to resist reaction or, more important, overreaction to insignificant, transient, or superficial turbulence within its environment. This steadiness may allow the organization to focus on innovation or other processes critical to its success.
Schneider’s first proposition, relating to attraction and selection of people into organizations based on congruence of characteristics, may obscure other important choices people make. Although ASA is based in part on research and thinking about vocational choice (Holland, 1985; Super, 1953), it is possible that person-vocation congruence is more critical to individuals than person-organization congruence. Functional units within organizations, such as manufacturing or sales, are likely to display distinguishable sets of attributes because the people who pursue manufacturing and sales occupations do so based on their individual attributes, and in turn those attributes correspond to characteristics of the occupation and its existing members. A logical inference is that the organization as a whole might not be the only or best unit of analysis.
Although Schneider worded his third proposition strongly, it is equally clear that some people who do not “fit” an organization remain with it. Schneider’s proposition assumes that an individual has the option to either stay or leave and that either the individual or the organization recognizes the “misfit.” He also assumes that other factors do not interfere with the attrition process. For example, in order to save money companies may enact human resource practices that encourage early retirement, effectively enticing workers to leave the company when they otherwise would not do so. Alternately, companies may want to retain the tacit knowledge of older workers by offering them financial incentives to remain when they otherwise would retire.
simultaneous insight into both the respondent’s individual psychological reaction to the environment he/she observes, of which the respondent is a part, and also into the environment to which the respondent contributes. The total perception of environment comprises the combination and/or interaction of situational and
dispositional factors. For example, employees in the same environment are more likely to respond to climate measures similarly, and the ASA process will cause employees in the same environment, work group, functional unit, and organization to become more similar over time. James and his colleagues suggested that employees with similar personalities, tendencies, or values are more likely to respond to climate measures similarly (James & James, 1989; James, et al., 2007).
The ASA model suggests the possibility of aggregating individual perceptions of climate based on shared environment, which can represent both situational and individual difference factors. Although ASA predicts greater homogeneity in work groups, functional units, and organizations over time, it specifies neither that those are the only meaningful groupings of people in an organization nor precludes, in the absence of a shared situation, grouping people based on individual differences. This point leads directly to the next major stream of research in climate: levels of analysis. More specifically, it enables examination of which level of analysis (i.e., individual, group, and organization) is appropriate for climate research.
Climate and Levels of Analysis
climate perceptual agreement among employees in the same organizations or work groups is often not sufficiently high to justify aggregation (Glick, 1985; James, 1982).
Another unit of climate analysis is organizational climate (Argyris, 1958; Glick, 1985). Researchers and practitioners who use this perspective treat climate as an organization-level construct and operationally define it as the average psychological climate, assuming an appropriate level of individual agreement. The absence of agreement at the organizational level is an indication that the climate construct does not exist there (Glick, 1985). The organizational perspective essentially obscures or dismisses the individual and the variability among individuals within organizations.
A third approach, which postulates climate at the sub-group level (Hellriegel & Slocum, 1974; Powell & Butterfield, 1978), contends that climate analysis may be undertaken at the individual, group, and
organizational levels, depending on the chosen theoretical underpinning or specific constructs of interest. Glick (1985), who agreed that climate research at the individual, group, and organizational level is appropriate, advocated the use of multilevel modeling techniques to analyze resultant data. Clearly, various perspectives on climate analysis level can be complementary or in conflict. The rest of this section elaborates on such
similarities and differences in an attempt to resolve them in terms of the present research.
According to the structural approach, organizational characteristics such as mission, reporting
relationships, or policies affect climate perceptions (Schneider & Reichers, 1983). The basic justification for the aggregation of climate data from this perspective is the belief that shared environments or experiences in the organization lead to shared perceptions of organizational climate. At each increase in hierarchical level (i.e., team, work group, department, business unit, organization), data can be aggregated. In the absence of measures of agreement, however, researchers and practitioners should not aggregate climate data to a higher level.
Although it has become relatively common practice to measure agreement before aggregating individual-level climate data to higher levels, the measurement of agreement is in itself problematic. Climate research suffers from findings of low interrater agreement and reliability (Glick, 1985). James (1982) examined 13 published studies and found that individual perceptual agreement, measured by intraclass correlation coefficients, ranged from ICC = 0.00 to 0.50, with a median value of ICC = .13. In the absence of agreement, aggregation to the level of work group, functional or business unit, or organization cannot be justified. Schneider and Reichers (1983) pointed out that in many studies, work groups in the same organization do not agree on the organization’s climate. Accordingly, they suggested that members of work groups develop shared meaning at the work group level because of their frequent interaction. From these results, one could conclude that social interaction is a basis for the development of shared meaning and shared perceptions of climate. Rather than conceptualizing climate as something that is communicated from the top down within an
organization and thereby justifying aggregation of climate scores up to higher levels, it appears that climate may develop horizontally as individuals within smaller organizational segments interact with each other and create their own “micro-climates” (Schneider & Reichers, 1983).
1984). Methodologically, the agreement statistics for climate studies (James, 1982) suggest that in many cases, agreement scores may be too low for aggregation of climate data.
There is theoretical support for the idea that sharing a work environment is not the only influence on one’s perception of climate; instead, one’s attributes, personality, or values may also influence these perceptions (James & James, 1989; James, et al., 2007; Schneider, 1987). Although it is probably true that group and organizational factors influence individually reported perceptions of climate, and that those perceptions have influence at the organizational, group, and individual levels, it is not clear that changes in the work environment will necessarily be equally noticeable, important, or desirable to all people in accordance with formal
organizational boundaries. Shared perceptions may be due to structural features of the organization, informal relationships in the organization, individual differences, or combinations of these factors. Simple aggregation to the work group and organizational levels seems inadequate to represent this complexity.
Schneider and Reichers (1983) advocated use of clustering techniques in the study of climate.
Mathisen and Einarsen (2004) and Joyce and Slocum (1984) suggested that, because individuals fulfill multiple organizational roles that are not always reflected by organizational boundaries, artificial organizational
boundaries should not be the sole basis for aggregation. Young and Parker (1999) demonstrated this empirically when they found that perceptions of the work environment related to interactions at work rather than formal work department membership. This finding supports the view that social interaction is a basis for the development of shared meaning (Schneider & Reichers, 1983).
outcomes according to cluster after grouping people by means of a traditional clustering technique. By doing so, they demonstrated that shared perceptions of climate are not necessarily tied to formal work groups and that other models of aggregation can produce meaningful results. This important contribution suggests the potential effectiveness of the aggregation approach employed in the present research.
Payne (1990), however, argued that collective climates are not meaningful in the absence of
correspondence to formal organizational roles. He contended that non-corresponding clusters of individuals in an organization only demonstrate that clustering techniques work and argued that such clusters might arise from shared personalities, values, or interests, rather than from the organizational environment or from climate as he defined it. Payne’s logic suggests that the presence of collective climates that do not correspond to formal organizational groups undermines the usefulness of identifying collective climates with clustering techniques. To establish this point further, Patterson, Payne and West (1996) used a clustering technique to compare cluster membership with membership in formal organizational groups. Not only did they find that clusters were unrelated to formal organizational structure, they commented that the resultant clusters in their study were “remarkable only in the diversity of the different organization segments (regions, construction sites, and offices) to which they belonged” (p. 1683). However, their sample was small (n = 133) and the number of clusters they identified was relatively large (n = 10).
Even if perceptions of climate result from a non-organizational cause, this finding does not necessarily negate the use of clusters to interpret organizational data. In other words, it may not matter why people think similarly. The fact remains that they do think similarly and therefore clustering may be useful for interpreting climate data. However, the views of Payne and his colleagues are important, particularly (as is often the case) when the goal of practice or research is to characterize group or organizational climates in terms of the average psychological climate. Other goals, however, are also possible. Groups, including organizations, may be viewed as salad bowls instead of melting pots. From this perspective, the usefulness of clustering group members based on their perceptions is particularly promising and may indeed be a more correct way of characterizing
macro-climate, in terms of the presence and dispersion of various perceptions of climate, i.e. micro-climates, throughout the organization.
As reviewed in the preceding section, researchers have conceptualized climate as the objective characteristics of an organization, as the subjective interpretation of objective environmental or organizational characteristics, and as a reflection of the personal attributes of the members in an organization. The research discussed in this section most often treats climate as an individual or psychological level concept but also aggregates climate data to higher levels of analysis in accordance with organizational boundaries, guided by agreement statistics. One issue with that type of aggregation, however, is that measures of agreement are often not high enough to justify it. With this in mind, some researchers have used clustering techniques as an alternative. Rather than aggregating to groups that adhere to formal organizational boundaries, it would appear that informal group membership or social interaction may represent a more meaningful and justifiable way to cluster individuals into groups that share perceptual agreement. In addition, the meaningfulness of these groups may extend beyond demonstrating perceptual agreement of climate; this type of aggregation may allow differential predictions of important criteria from climate. To date, the literature does not show resolution of these issues. In addition, a third major issue remains: the dimensionality of climate, specifically the dimensions of the climate construct and how they relate to important criteria.
Climate Dimensionality
identification, and lack of management concern and awareness. The job challenge and autonomy factor involves job challenge and variety, job autonomy, and job importance. The leadership facilitation and support factor involves concepts such as leader trust and support, leader goal facilitation, leader interaction facilitation, psychological influence, and hierarchical influence. Finally, the work-group cooperation, friendliness, and warmth factor involves concepts such as work-group cooperation, work-group friendliness and warmth, and responsibility for effectiveness (James & James, 1989).
Researchers have criticized the climate construct for conceptually overlapping with other constructs in the psychological literature, including:
structure, technology, formalization (James & Jones, 1974);
satisfaction (Guion, 1973; Hellriegel & Slocum, 1974; Johannesson, 1973);
psychological distance (Payne & Mansfield, 1973);
managerial function (Schneider, Parkington, & Buxton, 1980);
leader facilitation and support (James & Jones, 1974); managerial trust and consideration (Gavin & Howe, 1975);
open-mindedness (Payne & Mansfield, 1973);
superior and subordinate information (Bass, Valenzi, Farrow, & Solomon, 1975); warmth (Downey, Hellriegel, & Slocum, 1975);
communication flow (Drexler, 1977); competence (Lawler, Hall & Oldham 1974);
risk orientation (Lawler, Hall & Oldham 1974); courtesy (Schneider, Parkington & Buxton, 1980); and
overall quality (Schneider, Parkington & Buxton, 1980).
The preceding list of climate dimensions represents a small sample of other constructs in the psychological literature that overlap conceptually with climate constructs.
climate dimensions on any one measure within the scope of the criteria of interest. Similarly, Bartram (2005) noted, “Researchers have asked questions like, ‘What does instrument X predict?’…We should be asking ‘How can we best predict Y?’ where Y is some meaningful and important aspect of organizational behavior” (p. 1185). Suggesting that researchers shift attention from predictors to criteria, Schneider and Reichers (1983) called the criterion-referencing of climate constructs the “climates for something” approach and contended that work settings have different climates for specific things such as safety, service, production, security, and quality. Delineation of climates for safety (e.g., Mearns, Whitaker, & Flin, 2003), climates for service (e.g., de Jong, Ruyter, & Lemmink, 2004; Dietz, Pugh, & Wiley, 2004), climates for creativity or innovation (e.g., Ekvall, 1996), and climates for teams (e.g., Anderson & West, 1998) are recent examples of this approach. Criterion-referencing provides focus for the selection of climate dimensions, while climate remains the construct of interest (Glick, 1985).
The discussion of the literature up to this point has largely focused on the origin, level of analysis, and dimensionality of climate. Bartram’s (2005) point, however, is worth further consideration due to its focus on important outcomes such as innovation, which are likely to be useful for identifying and validating important predictor-criterion relationships. Criterion-referencing of climate surveys may also provide valuable face validity for climate surveys to organization managers and incumbents, who are more likely to be interested in criteria than in predictors. Scott and Bruce (1994) noted that the dimensions of general climate measures are not always relevant to the criteria of interest. Another important link between climate and innovation occurs within the context of the “climate for something” approach, one of which is the climate for innovation (Ekvall, 1996). The shift to using a criterion-referenced climate for innovation measure contextualizes the climate construct and increases the likelihood of identifying predictor-criterion relationships. In the next section, I present research related to the dimensionality of the climate for innovation and relationships between the climate for innovation to related organizational outcomes.
Climate for Innovation
Researchers pay some attention to climate for creativity and climate for innovation in the
the creation of new ideas, they use climate for innovation to describe situations that promote the creation and implementation of new ideas (Janssen, 2003; Mathisen & Einarsen, 2004). Climate for innovation subsumes climate for creativity. Further research is needed about the origin and dimensionality of climate for innovation and the relationships between climate for innovation and important innovation and organizational outcomes.
As noted earlier, I defined innovation as the development and introduction of a new idea and the ability to transform that idea into a product, process, object, or service. Kwaśniewska & Necka (2004) defined climate
for innovation as a “… situation in which the generation, consideration and use of new products, services, and ways of functioning are promoted” (p. 188). Much like the dimensions found in the climate literature, the important attributes to consider in a climate for innovation are not consistent in the literature and demonstrate construct overlap. As in the general climate literature, climate for innovation researchers developed several competing theoretical models and measurement instruments to reflect conceptual differences and to meet their particular research interests or needs.
Mathisen and Einarsen (2004) analyzed four of the major theoretical models and instruments designed to assess climate for creativity and climate for innovation and concluded that there are more similarities than differences in the conceptual areas each attempts to address. They did find, however, four major areas of agreement among the models they reviewed. First, the models attempt to explain how work environments promote or inhibit innovation and creativity, though all place greater emphasis on promotion over inhibition. Second, the models include the idea of “support” for innovation (Amabile, Conti, Coon, Lazenby, & Herron, 1996; Ekvall, 1996; Siegel & Kaemmerer, 1978, West & Anderson, 1996). Third, the models reflect the notions of shared goals, ownership of ideas, or commitment (Siegel & Kaemmerer, 1978). Fourth, other theoretical dimensions occur frequently among the models, including the open exchange of ideas, open relationships among peers and leader/subordinates, freedom, challenge, trust, and collaboration (Amabile et al., 1996; Ekvall, 1996). All of these factors prove useful in the prediction of innovation or creativity at the individual or team level (Mathisen & Einarsen, 2004).
defined support for innovation as organizational support for members to work independently and pursue new ideas. They further defined resource supply as the adequate supply of resources such as equipment, facilities, and time. They selected these dimensions based on Abbey and Dickson’s (1983) research that used a general climate measure to determine that these two dimensions predicted innovation outcomes. Although Scott and Bruce did not replicate Abbey and Dickson’s findings with regard to resource supply, they did demonstrate that support for innovation predicts innovation outcomes.
Leebaert (2006) confirmed the broad categories in which innovation is defined: investment in research and development, success of new products, revenues from new products and services, and the number and significance of the patents produced. These group- or organizational-level variables are not appropriate
outcomes for the psychological climate for innovation concept directly, however. In the absence of measures of agreement to justify aggregation of climate for innovation data, research should focus on individual-level outcomes, particularly commitment and innovative work behavior.
Climate for Innovation Outcomes
Innovative Work Behavior (IWB). IWB is the main criterion in the criterion-based climate for innovation approach. Scott and Bruce (1994) described IWB as a discontinuous process involving problem recognition, the generation of ideas (novel ideas or adopted ideas), the seeking of sponsorship for ideas, coalition building, and the implementation or production of ideas. Janssen (2000) defined IWB as “…the intentional creation, introduction and application of ideas within a work role, group or organization, in order to benefit role performance, the group, or the organization” (p. 288). Although these and other definitions differ somewhat, the literature also reflects agreement about some specific components of IWB. At the individual level, IWB involves creative behaviors such as the recognizing problems and generating ideas, as well as implementation behaviors such as promoting and realizing ideas (Dorenbosch, van Engen, & Verhagen, 2005). This two-dimensional conceptualization of innovative work behavior is relatively consistent in the literature (Dorenbosch, van Engen, & Verhagen, 2005; Janssen, 2000; Kanter, 1988; Scott & Bruce, 1994).
Individual IWB should predict organizational-level innovation criteria of interest, such as the number of patents and their importance or significance, as well as the successful implementation of new organizational practices or business models. Empirical evidence is not yet apparent.
Commitment. Commitment is another variable related to the dimensionality of climate for innovation (Dougherty, 1996; Mathisen & Einarsen, 2004). Some models of climate for innovation include a commitment dimension (e.g., Amabile et al., 1996) while others use commitment as an antecedent (e.g., Dougherty, 1996), intervening variable (e.g., James & Jones, 1974), or criterion (e.g., Dickson, Smith, Grojean, & Ehrhart, 2001) in their models. Similarly, Kontoghiorghes and Bryant (2004) found employee commitment to be dependent on the extent to which:
(a) the employee functions in an environment that has few bureaucratic barriers to getting the job done properly;
(b) people on one step of the operation regard the people in the next step of the operation as their customers and try to meet their needs;
(c) the employee is expected to use newly learned skills and knowledge learned in training;
(d) the employee receives praise and recognition when applying new skills and knowledge on the job; (e) the employee is well rewarded for his or her learning;
(f) innovators get ahead in the organization;
(g) there is an organization focus on process improvement; (h) the employee is a member of a self-directed work team; (i) the amount of output by peers exceeds expectations;
(j) the employee is given the opportunity to do what he or she does best; (k) peer output is received in a timely fashion; and
(1) the job requires skill variety. (p. 5)
learning is incorporated into work, innovation and process improvements are implemented, and a focus external to the company is fostered.
Meyer, Srinivas, Lal, & Topolnytsky (2007) noted that change theorists accord commitment a prominent place in their models of implementation. Herscovitch & Meyer (2002) demonstrated that commitment is an important antecedent to organizational change. A study in the health care industry by McNeese-Smith (1996) demonstrated that employees who perceived their companies to value change and new technology had higher levels of organizational commitment.
The relationship found by Kontoghiorghes and Bryant (2004) between situations that enable innovation and commitment is significant. Commitment to the organization is important to companies for a variety of reasons, and particularly to high technology companies and companies that rely heavily on
innovation. In the absence of commitment, turnover wastes valuable resources and the time and money required to train and socialize new employees is high. Although highly committed employees are likely to remain with the organization and to exert greater effort on behalf of the organization, the conceptualization of commitment in the literature is inconsistent. Meyer and his colleagues have developed a particularly compelling framework of commitment (Allen & Meyer, 1990; Herscovitch, & Meyer, 2002; Meyer, Becker, & Vandenberghe, 2004; Meyer & Herscovitch, 2001; Meyer, Srinivas, Lal and Topolnytsky, 2007).
Allen and Meyer (1990) described a three-component model of commitment to the organization that includes affective, normative, and continuance (ANC). Affective commitment is an employee’s emotional attachment to, identification with, and involvement in the organization. Continuance commitment is an employee’s perceived cost of leaving the organization versus the perceived benefit of continuing an
organizational relationship. Normative commitment is an employee’s feelings of obligation to the organization. Consistent with theory, the strongest relationships between commitment and important outcomes such as job performance, organizational citizenship behavior (OCB), and attendance are found for affective commitment, followed closely by normative commitment (Meyer, Becker, & Vandenberghe, 2004).
supervisors, coworkers). They advocate the use of commitment measures that apply the three-component (ANC) model to targets that are within or are associated with the organization. For example, when Meyer, Srinivas, Lal and Topolnytsky (2007) investigated the pattern of relationships on the three types of commitment (ANC) to two targets (the organization and an organizational change initiative) they concluded that commitment to the change initiative accounted for more variance in support for the change than commitment to the
organization did. In addition, they concluded that ANC commitment predicted compliance with requirements for the organizational change initiative, although they also observed that higher levels of continuance commitment restricted employee behavior to compliance with only the minimum behavioral requirements. Showing that members of the organization hold different levels of different types of commitment to different targets enabled Meyer et al. (2007) to demonstrate that the complexity of commitments predicts organizational behavior of interest. They provided evidence that the three-component (ANC) model of commitment,
contextualized to specific targets (such as organizational change initiatives), may expand understanding of the complex relationships between employees’ commitment and behavior.
Ruppel and Harrington (2000) investigated innovative behavior and commitment to innovation as outcomes of a climate for ethical behavior. Using a three-item commitment to innovation scale and qualitative data, they found that ethical work climates characterized by high trust and communication predict innovative behavior and commitment to innovation. They concluded that individuals who perceive that their organization is good or ethical, perform better, innovate more, and demonstrate higher commitment to innovation.
Dougherty (1996) observed that organizational activities related to innovation (market-technology linking, organizing for creative problem solving, and monitoring and evaluation) require unusually high levels of commitment to the organization. In other words, for a company to innovate, individuals within it need to feel fully integrated with their work and also need to invest in their work with substantial time, energy, and
through the implementation stage. From a situational perspective, the organization must provide an environment that fosters creativity and independence and that requires accountability so that employee follow-through to implementation is assured.
Just as “climate for innovation” contextualizes climate, “commitment to innovation” contextualizes commitment and “innovative work behavior“ contextualizes work behavior. Individuals who hold different perceptions of the climate for innovation are likely to demonstrate varying levels of commitment to innovation and to the organization in general. In addition, individuals who hold different perceptions of the climate for innovation are likely to demonstrate differences in innovative work behavior. Although I specify these relationships at the individual level of analysis, when agreement is sufficiently high to justify aggregation of climate perceptions, I expect these predictions to hold at the group or organization level also.
Conclusion
In this literature review, I have identified outstanding issues and competing points of view related to: (a) the focus of climate research, (b) the level of analysis for climate research, (c) the dimensionality of climate, (d) climate as a criterion-referenced predictor, and (e) climate for innovation criteria. I briefly summarize these issues below and present my perspectives about them in relation to the current research study.
First, researchers continue to disagree about whether climate should focus on the objective
characteristics of an environment, on the subjective interpretation of those characteristics, or on the attributes of group members within the environment. Most research on climate, however, relies on subjective interpretation of climate gathered by climate survey instruments. The present study is no different. Although I acknowledge the importance of describing objective characteristics of organizations, when survey methodology is employed, I believe the resultant data represents subjective interpretations. Unfortunately, the degree to which those subjective interpretations represent organizational characteristics or individual differences cannot be fully known.
individual level. These differences complicate neither theory nor methodology; however, aggregation of climate perceptions does complicate both. Whereas some researchers argue that groups of people who share a
meaningful perception of climate may not be bound by formal organizational boundaries, others argue that a group must correspond to formal organization boundaries if meaning is to be inferred for it. For this study, the important task is to determine how to group individuals in a meaningful way. The issue is not whether or not to aggregate climate data to the formal levels of group or organization, but rather whether or not groups that share climate perceptions do so because of those memberships. Aggregation to the group level, from the latter perspective, does not involve checking formal groups for agreement, but instead depends on recognizing group formation based on agreement, and then assessing whether situational and individual differences predict group membership.
Third, the dimensionality of climate remains problematic. In general, researchers agree that
psychological climate is a second-order latent factor but disagree about which are the first-order latent factors. Many also lament the conceptual overlap in the psychological literature of many proposed first-order factors with other concepts. Criterion-referencing, which shifts focus from the taxonomy of climate dimensions to maximizing the prediction of climate outcomes, is one way to deal with the dimensionality of climate issue. The choice of criterion-referencing also addresses the issue of the meaningfulness of groups. In response to Payne and his colleagues, I take the position that the question of meaningfulness should be answered empirically. Instead of being limited to the formal structure of the organization, meaningfulness should be determined by the differential prediction of important criteria. It may be that unique sub-climates interact to create or define the larger organizational climates.
Finally, measuring innovation by group- or organization-level indicators may be inappropriate for the identification of individual-level predictors. Climate for innovation perceptions should combine to predict individual innovation outcomes such as commitment to the organization, commitment to innovation, and innovative work behavior. Although the literature still lacks an empirical demonstration, these individual-level outcomes should predict more commonly used group-level or organization-level criteria.
Theoretical and Methodological Framework and Implications
Theoretical Framework. Wapner and Demick’s (2000) articulation of person-in-environment psychology as “a holistic, developmental, systems-oriented perspective” (p. 25) has influenced my thinking about and interpretation of climate and its related literatures. The main ideas in person-in-environment psychology that I share and that relate to the present study are: (a) an organismic and transactional worldview, which emphasizes synthesis and wholeness of person-environment systems; (b) constructivist philosophy, in which reality is subject to perception and people actively and intentionally pursue goals; (c) use of the systems unit of analysis, in which individuals are conceptualized as systems, individuals in groups are systems, and so forth; (d) levels of analysis integration, in which functioning at one level of analysis relates to functioning at all other levels of analysis; and (e) methodological eclecticism (Wapner and Demick, 2000), which values all methods.
I also subscribe to complexity theory (Geyer, 2003), which recognizes that: (a) biological and organizational systems are complex and dynamic; (b) events are only partially predictable because they are caused by both orderly and nonorderly phenomena; and (c) systems have adaptive and emergent properties. Complexity theorists tend to favor modeling techniques and advocate for diversity in methods and
interpretations. In light of these theoretical and philosophical underpinnings, for the current study, I chose a methodology that integrates the variable and pattern approaches to data analysis in order to address the climate for innovation issues examined herein. I explain what I mean by the terms “variable approach” and “pattern approach” in the next section.
variables) of interest. This underlying premise offers a major advantage in the form of parsimony (Foti & Hauenstein, 2007). Most climate researchers have used the variable approach exclusively to address questions related to the dimensionality of climate, criterion-referencing of climate, climate for innovation criteria, and even levels of analysis. Regarding the latter, however, the variable approach often obscures individual variability by treating it as measurement error. Exclusive use of this approach therefore diminishes the importance of considering individual variation; such researchers tend to use linear or static models (Foti & Hauenstein, 2007) that also fail to represent the complexity in relationships.
The pattern approach, on the other hand, is person-centered. Individuals are treated holistically, as systems, and are the primary unit of analysis (Foti & Hauenstein, 2007). The main goal of using a pattern approach is to identify clusters, groups, or profiles of individuals and to study them over time. Researchers who use pattern approaches give attention to individual variability, interactions, complexity, dynamic relationships, and nonlinear relationships. By contrast, a researcher using the variable approach may assign a second-order climate score to each individual that represents an average of scores or a weighted average score across all climate dimensions.
In accordance with the systems and complexity ideas discussed above, the pattern approach is a modeling approach that allows for the possibility of emergent or adaptive characteristics of individuals or groups of individuals. Although researchers underutilize the pattern approach, it is a complement, not an alternative, to the variable approach. Patterns represent individuals by their positions on interacting variables. The pattern, in effect, becomes the variable used to predict criteria of interest.
Relevantly to the present study, Joyce and Slocum (1984) used a pattern approach when they clustered individuals based on their perceptions of climate and then used the climate perceptions to predict important organizational outcomes. They demonstrated both that shared perceptions of climate are not necessarily tied to formal work groups (exclusive variable approach) and that other models of aggregation (e.g., pattern
approaches) can produce meaningful results.
such as climate for innovation perceptions. Unlike traditional clustering techniques, such as k-means or Ward’s method, LPA is a model-based approach (Magdison & Vermunt, 2002). For model-based approaches, like LPA methods, the results for a sample are estimates for the population from which the sample was drawn. More practically, LPA methods allow researchers to generate probability-based classifications so that probability of class membership can be estimated for each case. Such estimates are not possible with traditional clustering techniques, because within them class membership is weighted by an indicator variable (where 0 = nonmember
and 1 = member).
In addition, the statistical assumptions of LPA comport with common characteristics of survey data. Researchers can analyze data that fail to meet standard assumptions, such as multivariate normality, equal variances, and factor independence, without violating the stated assumptions of LPA. Researchers can also incorporate many types of variables into LPA models, including nominal, ordinal, or continuous data and mixed scale-types, and the data need not be standardized. Scaling and standardization of variables is an issue for traditional clustering techniques, so researchers must estimate the relationships of demographic data or other covariates after the fact using techniques such as discriminant analysis. Furthermore, using LPA researchers can classify cases and analyze covariate contributions to the classification using data from mixed-scale types (Magdison & Vermunt, 2002). LPA techniques make it possible to simultaneously conceptualize climate perceptions as an individual-level, complex phenomenon; to group individuals based on profile similarity; and to estimate the impact of situational and individual difference covariates.