Full Reference Quality Assessment of Tone
Mapped Images
Hrudya V N 1, Dr. Priya S 2
M.Tech Student, Department of Computer Engineering, Model Engineering College, Thrikkakara, Kochi,
Kerala, India1
Professor, Department of Computer Engineering, Model Engineering College, Thrikkakara, Kochi, Kerala, India2
ABSTRACT: Tone Mapping is the process of converting High Dynamic Range Image to Low Dynamic Range
Images. It helps to visualize High Dynamic Range image on LDR Displays. In this paper, these methods are presented for detecting the quality of images after Tone Mapping. The quality assessment methods is used to measure perceived degradation. It compares quality of original image and resultant images which give a quality score as result. Quality Assessment is mainly done in two ways. Subjective Quality Assessment is expensive and difficult to embed in system. Objective Quality Assessment measures objectively and automatically by computer system. Objective quality assessment algorithms are mainly used in tone mapping algorithms. Applications are in the field of image denoising, image compression, parameter tuning.
KEYWORDS: HDR Images, LDR Images, Tone Mapping, Image Quality Assessment, Objective IQA, Subjective
IQA.
I.INTRODUCTION
In recent years interest of high dynamic range (HDR) images is increasing, where the range of intensity levels could be on the order of 10,000 to 1. It will make accurate representations of the luminance variations in real world. HDR images are most widely used in computer graphics and recent advances in imaging. A common ISSUE is encountered in that is how to visualize these HDR images on standard low dynamic range (LDR) display devices. To recover from this problem, an increasing number of tone mapping operators (TMOs) used, which convert HDR to LDR.
High dynamic range images are generated by special cameras where it capture multiple low dynamic range (LDR) images with different exposures times. Then these images are joined together in order to get a high dynamic range images. There are many techniques for combining multiple exposure images mainly classified into two classes; global and local methods.Global Method uses the entire image as the neighborhood value for each pixel. Local method uses the pixels neighborhood value to calculate the pixels adaptation level.
HDR images are generated by capturing LDR images using cameras. Here, Jinno et al. [4] created HDR image by joining multiple exposure images. It done with help of block matching method for motion compensation. Jo and Vavilin [5] used a different exposure time in order to increase the dynamic range of images. Tone mapping methods compress the brightness of an image by maintaining the contrast. Dargo et al. [8] proposed logarithmic compressing the luminance values by adaptively varying the logarithmic bases. Duan et al. [2] used histogram adjustment technique to make the visualization of the image obtained using global tone mapping operators.
II.RELATEDWORK
Tone mapping is the process of reducing the dynamic range of the HDR image to make display on the LDR displaying device . Various type of tone mapping operators can be used for reducing the dynamic range. Quality assessment of the tone-mapped image can be done by comparing statistical naturalness and structural fidelity.
Perceptual evaluation of tone mapping operators [2]. It is direct comparison between the appearance of real-world scenes and HDR images of these scenes displayed on a low dynamic range monitor.
Global Operator: It uses the entire image as the neighborhood value for each pixel.
Local operators use the pixels neighborhood value for computing the pixels adaptation level Frequency operators reduce the dynamic range based on the spatial frequency of a selected area.
Our system aims at use of Tone –Mapping operators. Tone-mapping operators [TMOs] convert high dynamic range [HDR] to low dynamic range [LDR] images. Conversion can be done with different tone mapped operators where Local operator, Frequency domain, Gradient domain operator gives less compression or less reduction in dynamic range. The global operator used as resultant operator to reduce dynamic range.
In the preprocessing modules, a Tone Mapping Algorithm can be applied to enhance the image. Tone Mapping Operator converts High Dynamic range to low dynamic Range Image called Tone mapped image. Conversion can be done with the help of Tone Mapped Operator. The algorithm steps are summarized as follows
.
1.
The intensity is calculated by averaging the color channels and then the required filter is applied in order to segregate detail and base layer.I=1/61*(R*20 + G*40 + B).
2.
Once the detailed layer is computed, the normalization procedure is carried out following which the reconstruction of image takes place.3.
This is done by combining the detail and base layer by Gaussian or Laplacian pyramids. Though the filter operates with a common procedure, the kernel design of the filter applied is different for each tone mapping operator used.After applying all these 3 steps, we get a tone mapped images.
III.IMAGE QUALITY ASSESSMENT
Algorithm Based on Subjective Method
In Subjective Methods [2], the human subjects are utilized to perform the task of assessing visual quality. The advantages of this method are, it is provide reliable methodology and it provides useful information for the modeling phase. It depends on human visuality. There are three types of Subjective Method.
Single Stimulus (SS) Method: This method is used for evaluating the IQA algorithms . Here, a set of stimuli is used one at a time and have a reference image in that set.
Quality Ruler (QR) Method: This method is combined a series of reference images and whose scale is already known.
Mean Opinion Score: Mean opinion score produce the accurate results using small number of quality scores. The disadvantage is time consuming and expensive. Due to that ,it is difficult to embedded into optimization framework.
Algorithm Based on Objective method
The goal of objective Image Quality Assessment (IQA) is to design mathematical models that are able to predict the quality of an image accurately and automatically..
Full reference method: In full reference IQA, the reference image wants to be known and predict the visual quality by comparing the distorted signal against the reference.
Quality Metric [4]: MSE value increases as the compression value also increases. (PSNR) Peak to signal noise ratio assess quality by compression. Visual Information Fidelity (VIF) is defined as the relation of distortion image information to the reference image information.
Human Visual Based System [16]: The HVS measure uses the psychophysical metrics to compute the visual quality. It include Structural similarity index and mean structural similarity index.
Reduced Reference Method: The idea of RR QA [18] was as approach used in real-time video quality monitoring communication networks. The reference image is not fully accessible. Some of features are taken as reference images.
Human Visual Based System [3]: The human visual system is used for extracting structural information from the scene. It will take as reference images.
Multi-Scale Structural Similarity Method: It is used to generate a texture with statistics matching an original texture, and a human subject then judges the similarity of the two textures.
No Reference Method: The idea of no-reference [3] is at the sender side, a feature extractor is applied to reference image. Here, there is no reference image. Only features are the reference information.
BLind Image Integrity Notator using DCT Statistics - II (BLIINDS-II) Index: It is used to observe how relevant statistical feature of image become changes when it distorted.
Blind/Reference less Image Spatial Quality Evaluator (BRISQUE) [19]: It extract point wise measure of normalized luminance signals and measure image naturalness.
IV.EXPERIMENTAL RESULTS
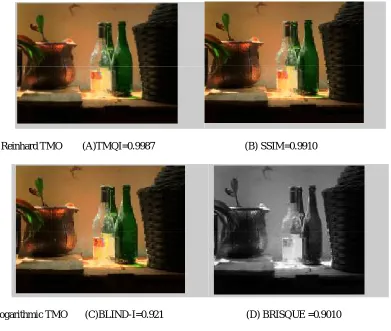
Input image is divided into R-channel, G-channel and B-channel. Then Tone Mapping is performed in each channel separately and preprocessed image is obtained by combining these three channels.
Reinhard TMO (A)TMQI=0.9987 (B) SSIM=0.9910
Logarithmic TMO (C)BLIND-I=0.921 (D) BRISQUE =0.9010
V.ANALYSIS
Using the code developed, various quality matrices of Low Dynamic Range Image converted from High Dynamic Range Image were calculated. Parameters used in this analysis are SSIM, MSSIM, TMQI, UQI, MSE, BLIND-I, BRISQUE and PSNR. While analyzing the output obtained, it is found that superior Low Dynamic Range Image is given by Reinhard Tone Mapping Operator.
TMO/QM SSIM MSSIM TMQI BLIND-I BRISQUE MSE PSNR
VANHATEREN 0.840 0.984 0.211 0.06 0.9600 0.943 0.432 0.558
KRAWCZYK 0.9981 0.211 0.216 0.9 0.923 0.90 0.532 0.548
REINHARD 0.998 0.9910 0.994 0.993 0.921 0.910 0.954 0.943
LOGRATHMIC 0.998 0.845 0.832 0.876 0.901 0.921 0.7540 0.546
Table 5.1: Quality Assessment of Tone Mapped Images
VI.CONCLUSION
REFERENCES
[1] H. Yeganeh and Z. Wang, Objective quality assessment of tone mapped images, in IEEE transactions on image processing, Vol. 22, No. 2, February 2013.
[2] A. Yoshida, V. Blanz, K. Myszkowski, and H. Seidel, Perceptual evaluation of tone mapping operators with real-world scenes, Proc. SPIE, Human Vis. Electron. Imag., vol. 5666, pp. 192203, Jan. 2005.
[3] Z. Wang, E. P. Simoncelli, and A. C. Bovik, Multi-scale structural similarity for image quality assessment, in Proc. IEEE Asilomar Conf.Signals, Syst., Comput., Paci_c Grove, CA, Nov. 2003, pp. 1398 1402. ases using texture features, Commission Internationale du Genie Rural(CIGR) journal, vol. 15, no.1, pp:211-217, March 2013.
[4] H. Yeganeh and Z. Wang, Objective assessment of tone mapping algorithms, in Proc. IEEE Int. Conf. Image Process., Sep. 2010, pp.2477 2480. [5] E. C. Larson and D. M. Chandler, Most apparent distortion: Full-reference image quality assessment and the role of strategy, J. Electron.Imag., vol. 19, no. 1, pp. 011006 1 011006 21, 2010.
[6] Wang and A. C. Bovik, Reduced reference and no-reference image quality assessment, IEEE Signal Process. Mag., vol. 28, no. 6, pp. 29 40, Nov.2011.
[7] Z. Wang and A. C. Bovik, Modern Image Quality Assessment. SancRafael, CA: Morgan and Claypool Publishers, Mar.2006.
[8] E. C. Larson and D. M. Chandler, Most apparent distortion: Full reference image quality assessment and the role of strategy, J. Electron.Imag., vol. 19, no. 1, pp. 011006 1 011006 21, 2010.
[9] Z. Wang, E. P. Simoncelli, and A. C. Bovik, Multi-scale structural similarity for image quality assessment, in Proc. IEEE Asilomar Conf. Signals, Syst., Comput., Paci_c Grove, CA, Nov.
[10]YasirSalih, AamirSaeed Malik and Wazirahbt.Md-Esa,A Comparative Study of Various Tone Mapping Methods, in proc. International Journal of Computer, Electrical, Automation, Control and Information Engineering Vol:5, No:10, 2011